🚀 MSFT Trader Buys $13M in $470 Calls — Pressing the Post-Earnings Azure Breakout
📅 July 30, 2026 | 🔥 Unusual Activity Detected
✅ UPDATE — July 31, 2026 pre-market: the OI check is in and it confirms a fresh OPENING buy. Open interest at the September 18 $470 call went 10,736 → 21,511 (+10,775) — an increase larger than the 9,953-lot print itself. This was Buy To Open, not an unwind. The bullish read below stands, confirmed. See the ✅ RESOLVED box for the full table.
🎯 The Quick Take
One trading day after Microsoft crushed fiscal Q4 earnings — Azure growth accelerating to +43% and crossing $100B in annual revenue — someone stepped up and paid the ask for ≈9,953 September 18 $470 calls, a ≈$13M bet that the post-earnings pop has more room to run. This wasn't a quiet fill; the buyer lifted the offer in the lit market, meaning they took liquidity rather than waiting for a better price — real conviction, not a passive order sitting in the background. With the stock still digesting an ≈8.9% overnight jump, this trader is betting the Azure story keeps pushing shares higher into September.
📊 Company Overview
Microsoft (MSFT) is one of the largest technology companies on the planet, built around three pillars that are all firing right now:
- Market Cap: ≈$3.38 trillion
- Sector / Industry: Technology — Software & Cloud Infrastructure
- What it does: Azure cloud computing, Microsoft 365 productivity software, Windows, LinkedIn, Xbox gaming, and — increasingly the market's main focus — an end-to-end enterprise AI stack (Copilot, Azure AI Foundry, and its ≈27% stake in OpenAI)
- YTD Performance: ≈+16.7% | P/E Ratio: ≈25.4x
💰 The Option Flow Breakdown
📊 What Just Happened
The Tape (July 30, 2026 @ 10:25:42 ET):
| Time | Buy/Sell | Call/Put | Expiration | Premium | Strike | Volume | OI | Size | Spot | Option Price | Option Symbol |
|---|---|---|---|---|---|---|---|---|---|---|---|
| 10:25:42 | BUY | CALL | 2026-09-18 | $13M | $470 | 13,000 | ≈10,385 | 9,953 | $448.65 | $12.80 | MSFT20260918C470 |
- ⚡ Mechanism: lit, at the ask. This traded on the regular displayed market and the buyer paid the full ask price to get filled — that's genuine aggression, not a negotiated block trade between two parties who already agreed on price.
- 🎯 No hedge attached. We checked the equity tape for a matching stock trade (the kind of "insurance" block you'd see if this were a delta-hedged package) and found none. This is a naked, directional bet — the buyer wants the stock to go up, full stop.
- 📏 Correction on open interest: the original screenshot flagged OI at 2,300 — that number was stale. The real OPRA open interest at this strike/expiration was ≈10,385 contracts heading into today's print, not 2,300. Always trust the live tape over screenshot software.
✅ RESOLVED — The Next-Day OI Check Confirms a Fresh Opening Buy
We flagged this trade as provisional because its size (9,953 contracts) sat right on top of the existing open interest (≈10,736) — from the tape alone we could not prove whether this opened a new bullish position or closed an old one. The July 31 pre-market OPRA snapshot settles it.
| Leg | Baseline OI (Jul 30 snap) | Resolving OI (Jul 31 snap) | Δ | Print size | Δ as % of print | Verdict |
|---|---|---|---|---|---|---|
| Sep-18-2026 $470 Call | 10,736 | 21,511 | +10,775 | 9,953 | ≈108% | ✅ OPEN (BTO) |
Open interest didn't just rise — it doubled. Contracts only get created when a position is opened, so a +10,775 increase against a 9,953-lot print means every contract our buyer took was brand new, plus roughly 800 more opened by other traders doing the same thing. The strike's full session volume was 14,206 contracts, so ≈76% of everything that traded created fresh open interest. There were no cancellations on the tape.
What this confirms: the far-less-bullish alternative — someone unwinding a prior short-call position — is now ruled out. This was a genuine Buy To Open: new money, paid at the ask, pressing the post-earnings move. The bullish framing throughout this article is confirmed rather than provisional, and our buyer had company.
🤓 What This Actually Means — Plain English
Here's the translation: someone thinks Microsoft isn't done moving. They bought calls that only pay off if MSFT is above $470 by September 18 — that's roughly 5% above where the stock was trading at the moment of the print ($448.65), and about 3% above where MSFT is trading right now (≈$455.6).
Because this is (provisionally) a BTO — Buy To Open — the buyer is putting new money to work betting on upside, not closing out an old position for a profit. They didn't buy the stock outright; they bought leverage. For roughly $13M, they control the upside on ≈995,300 shares worth of stock exposure (9,953 contracts × 100 shares) — a fraction of what it would cost to buy that many shares outright, but with much sharper gains (and losses) if the bet is wrong or the timing is off.
The timing tells the story: this print landed the morning after Microsoft reported fiscal Q4 revenue of $90B (+18%), Azure growth accelerating to +43% and crossing $100B annually for the first time, and a beat-and-raise combo that sent shares up as much as ≈8.9% after hours. This trader isn't discovering something the market doesn't know — they're pressing an already-confirmed move, betting that Azure's re-acceleration and Microsoft's aggressive-but-disciplined AI capex story ($255–260B guided for FY2027) keeps analysts raising targets and the stock grinding higher into September options expiration.
Unusual Score: the tape shows this print at ≈5.7x the recent average trade size for MSFT options — not a "once-in-a-blue-moon" event, more like something that shows up a handful of times a year. It's the size and the aggressive at-the-ask fill — not the frequency — that make it worth watching.
📈 Technical Setup / Chart Check-Up
YTD Performance Chart
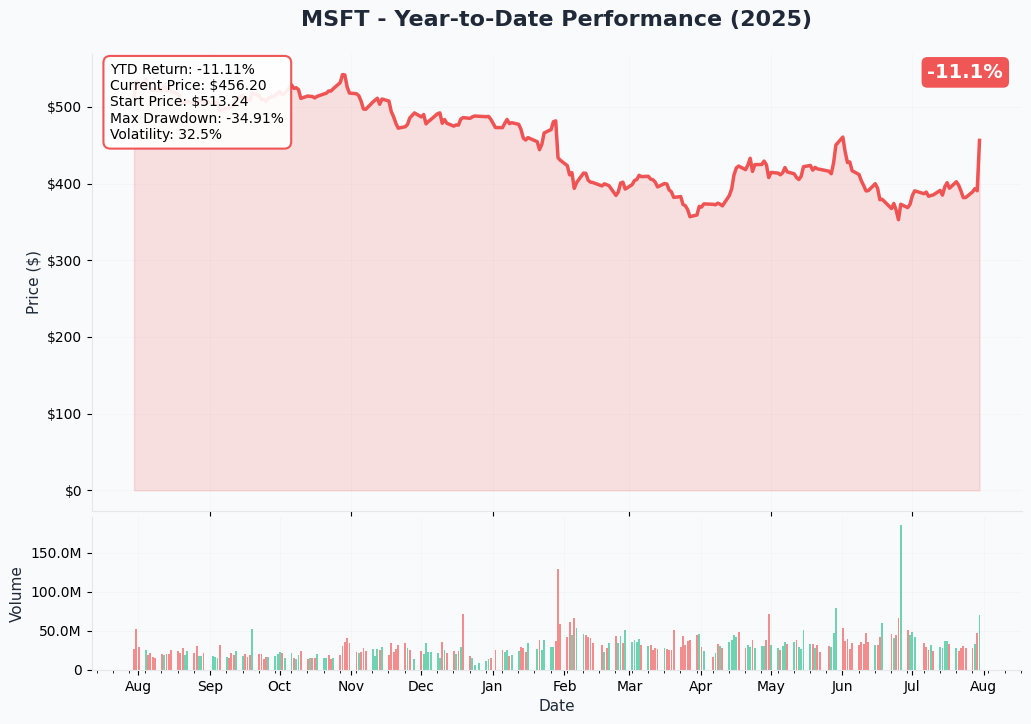
Microsoft is up ≈16.7% year-to-date, and the chart tells the story of a steady AI-infrastructure grind that just got a fresh jolt from Tuesday's earnings beat. The stock gapped from a pre-earnings close near $427 to briefly touch ≈$455 in the after-hours session — one of the bigger single-day repricings of the year for a $3.38 trillion company.
Gamma-Based Support & Resistance Analysis
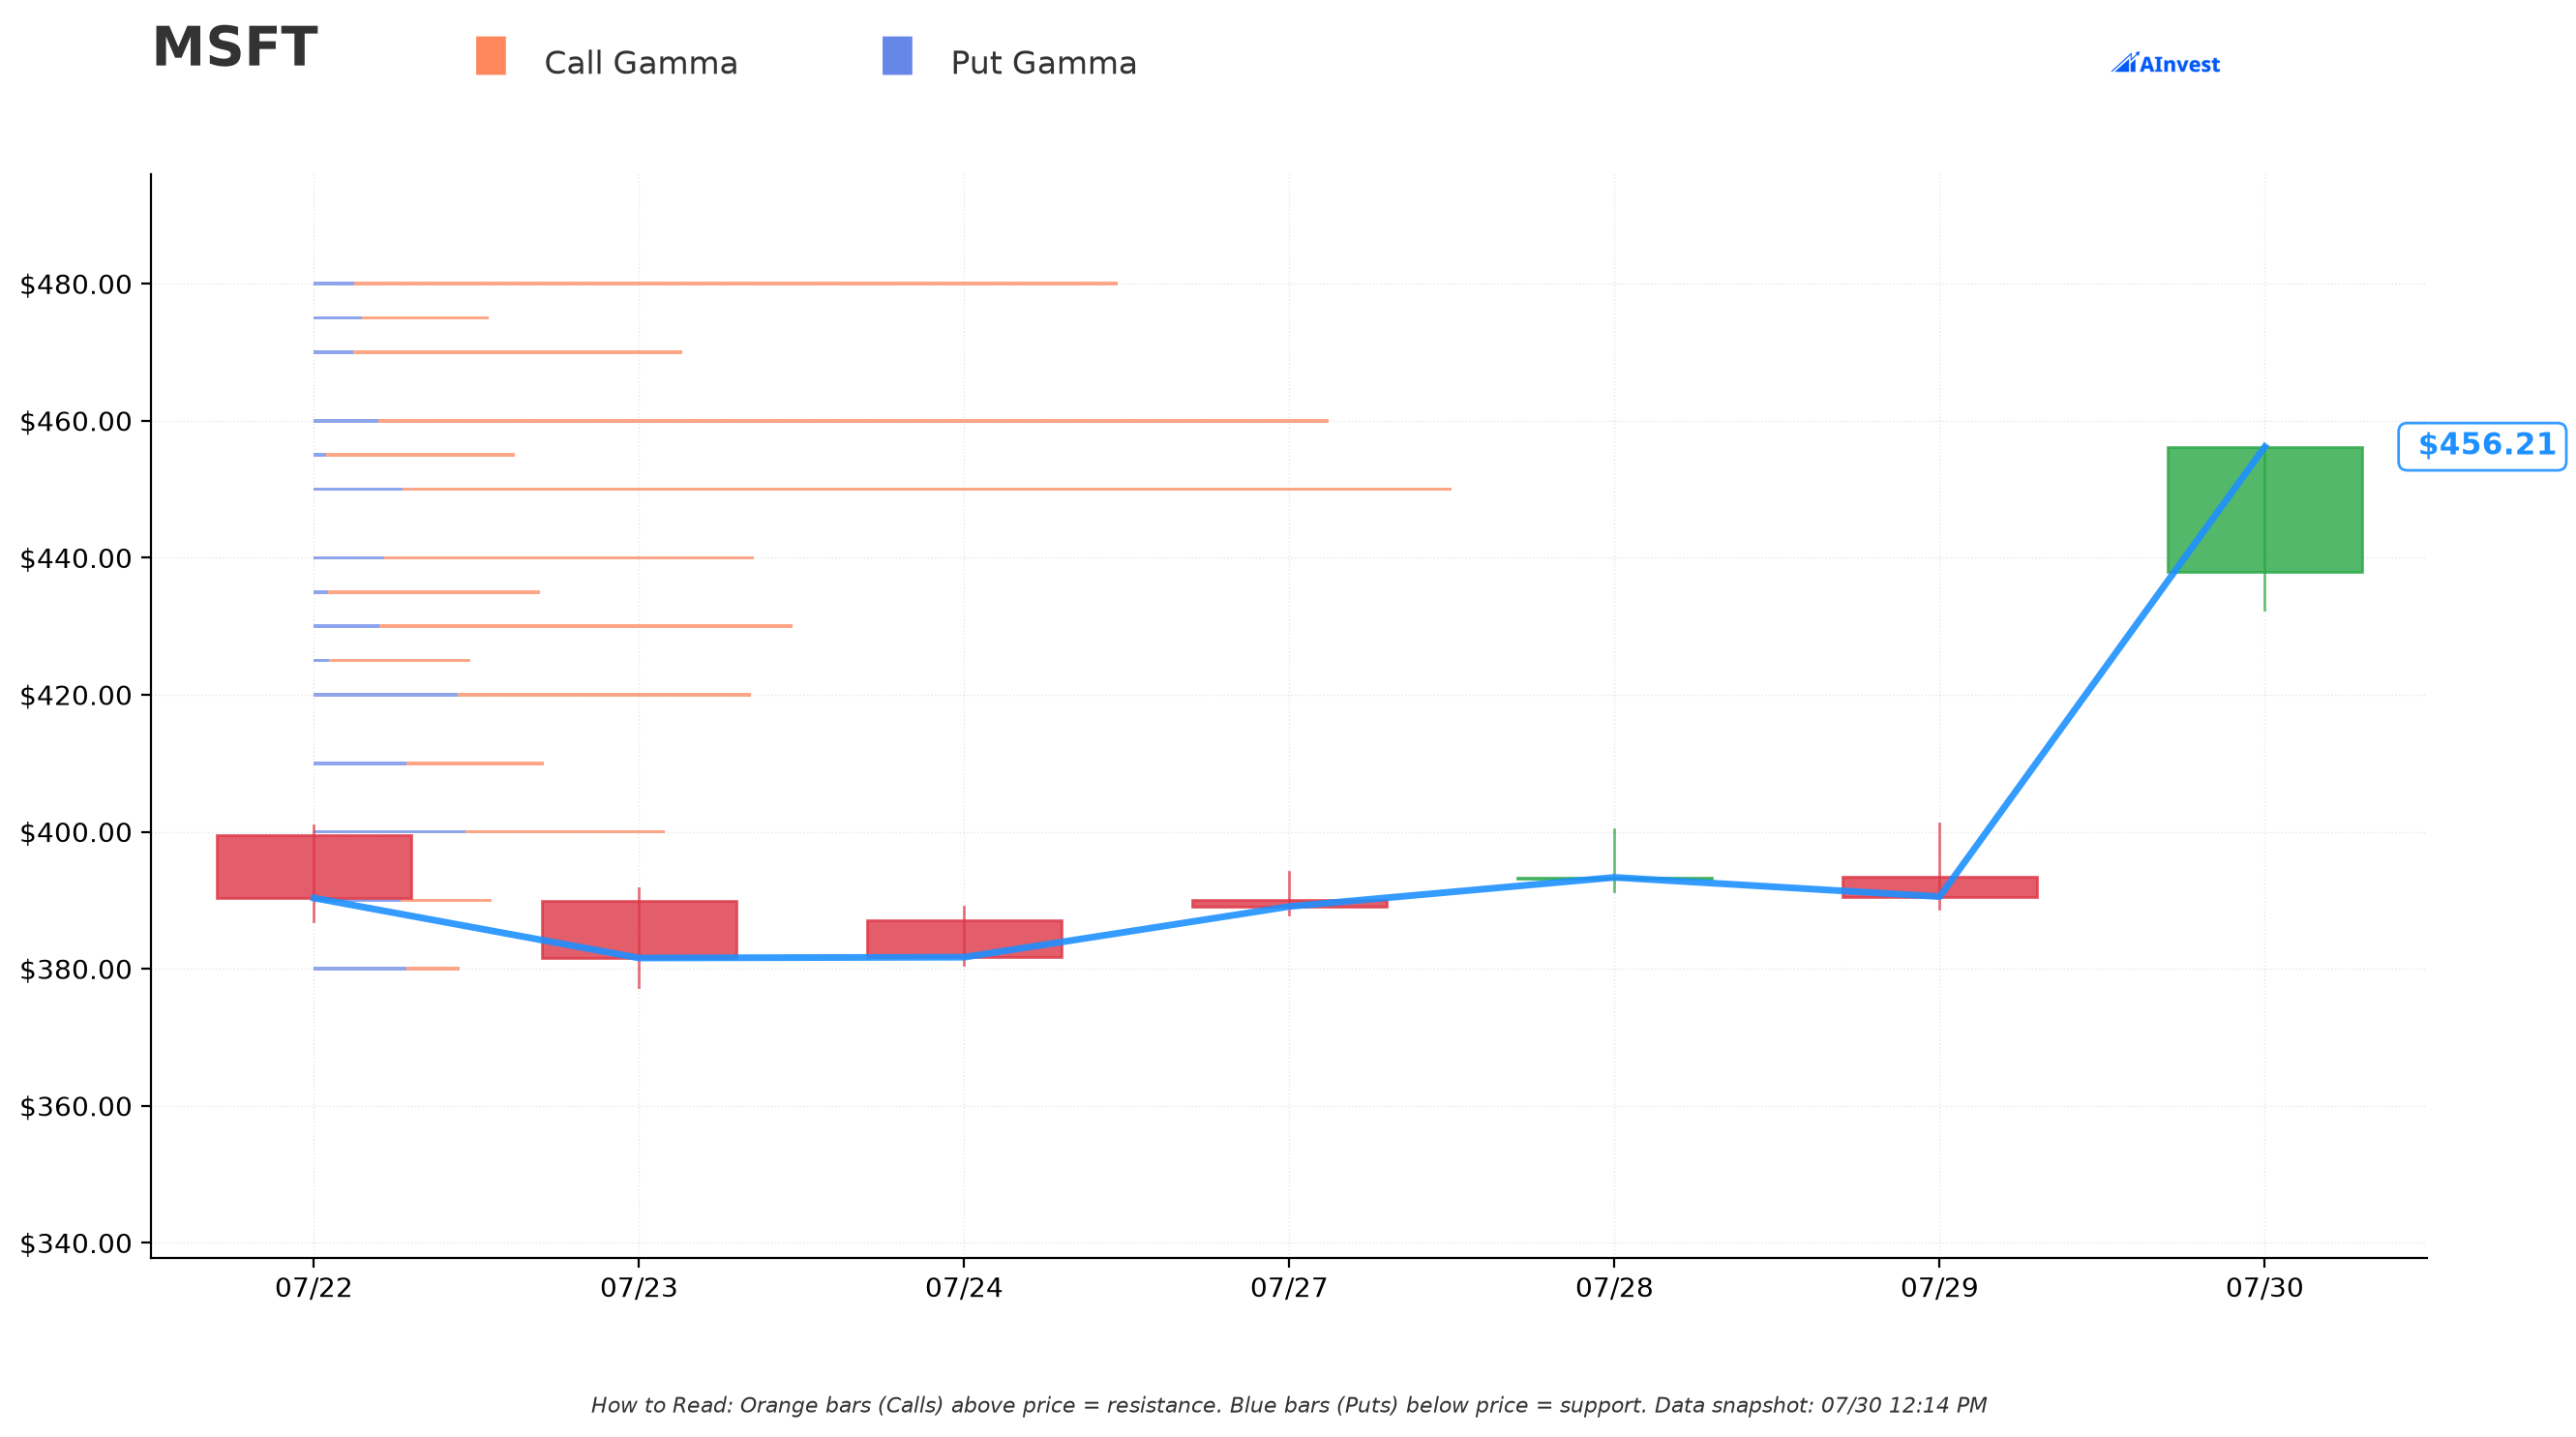
Current Price: ≈$455.6
The options market is showing dealers holding heavy positions clustered just above and below today's price — these are the levels where market-maker hedging tends to act like gravity, pulling price back or creating friction:
🔵 Support Levels (Put Gamma Below Price):
- $450 — the nearest and by far the strongest floor (≈1.2% below spot), where dealer hedging flows are heaviest
- $440 — a second, very strong support shelf (≈3.4% below spot)
- $430 — a deeper structural floor (≈5.6% below spot)
🟠 Resistance Levels (Call Gamma Above Price):
- $460 — the closest ceiling (≈1.0% above spot), almost as strong as the $450 support directly below it — expect chop here
- $470 — the exact strike this trader bought (≈3.2% above spot) — a real resistance zone, meaning the buyer needs the stock to fight through dealer hedging flows to get comfortably in the money
- $480 — the next major ceiling (≈5.4% above spot), where the heaviest call-gamma concentration above $470 sits
What this means for traders: MSFT is essentially pinned in a tight $450–$460 band right now, with dealers likely buying dips toward $450 and selling into pops toward $460. To make real money on this $470 call, the stock needs to punch clean through both the $460 and $470 gamma walls — a move the buyer is betting happens by September 18.
Implied Move Analysis
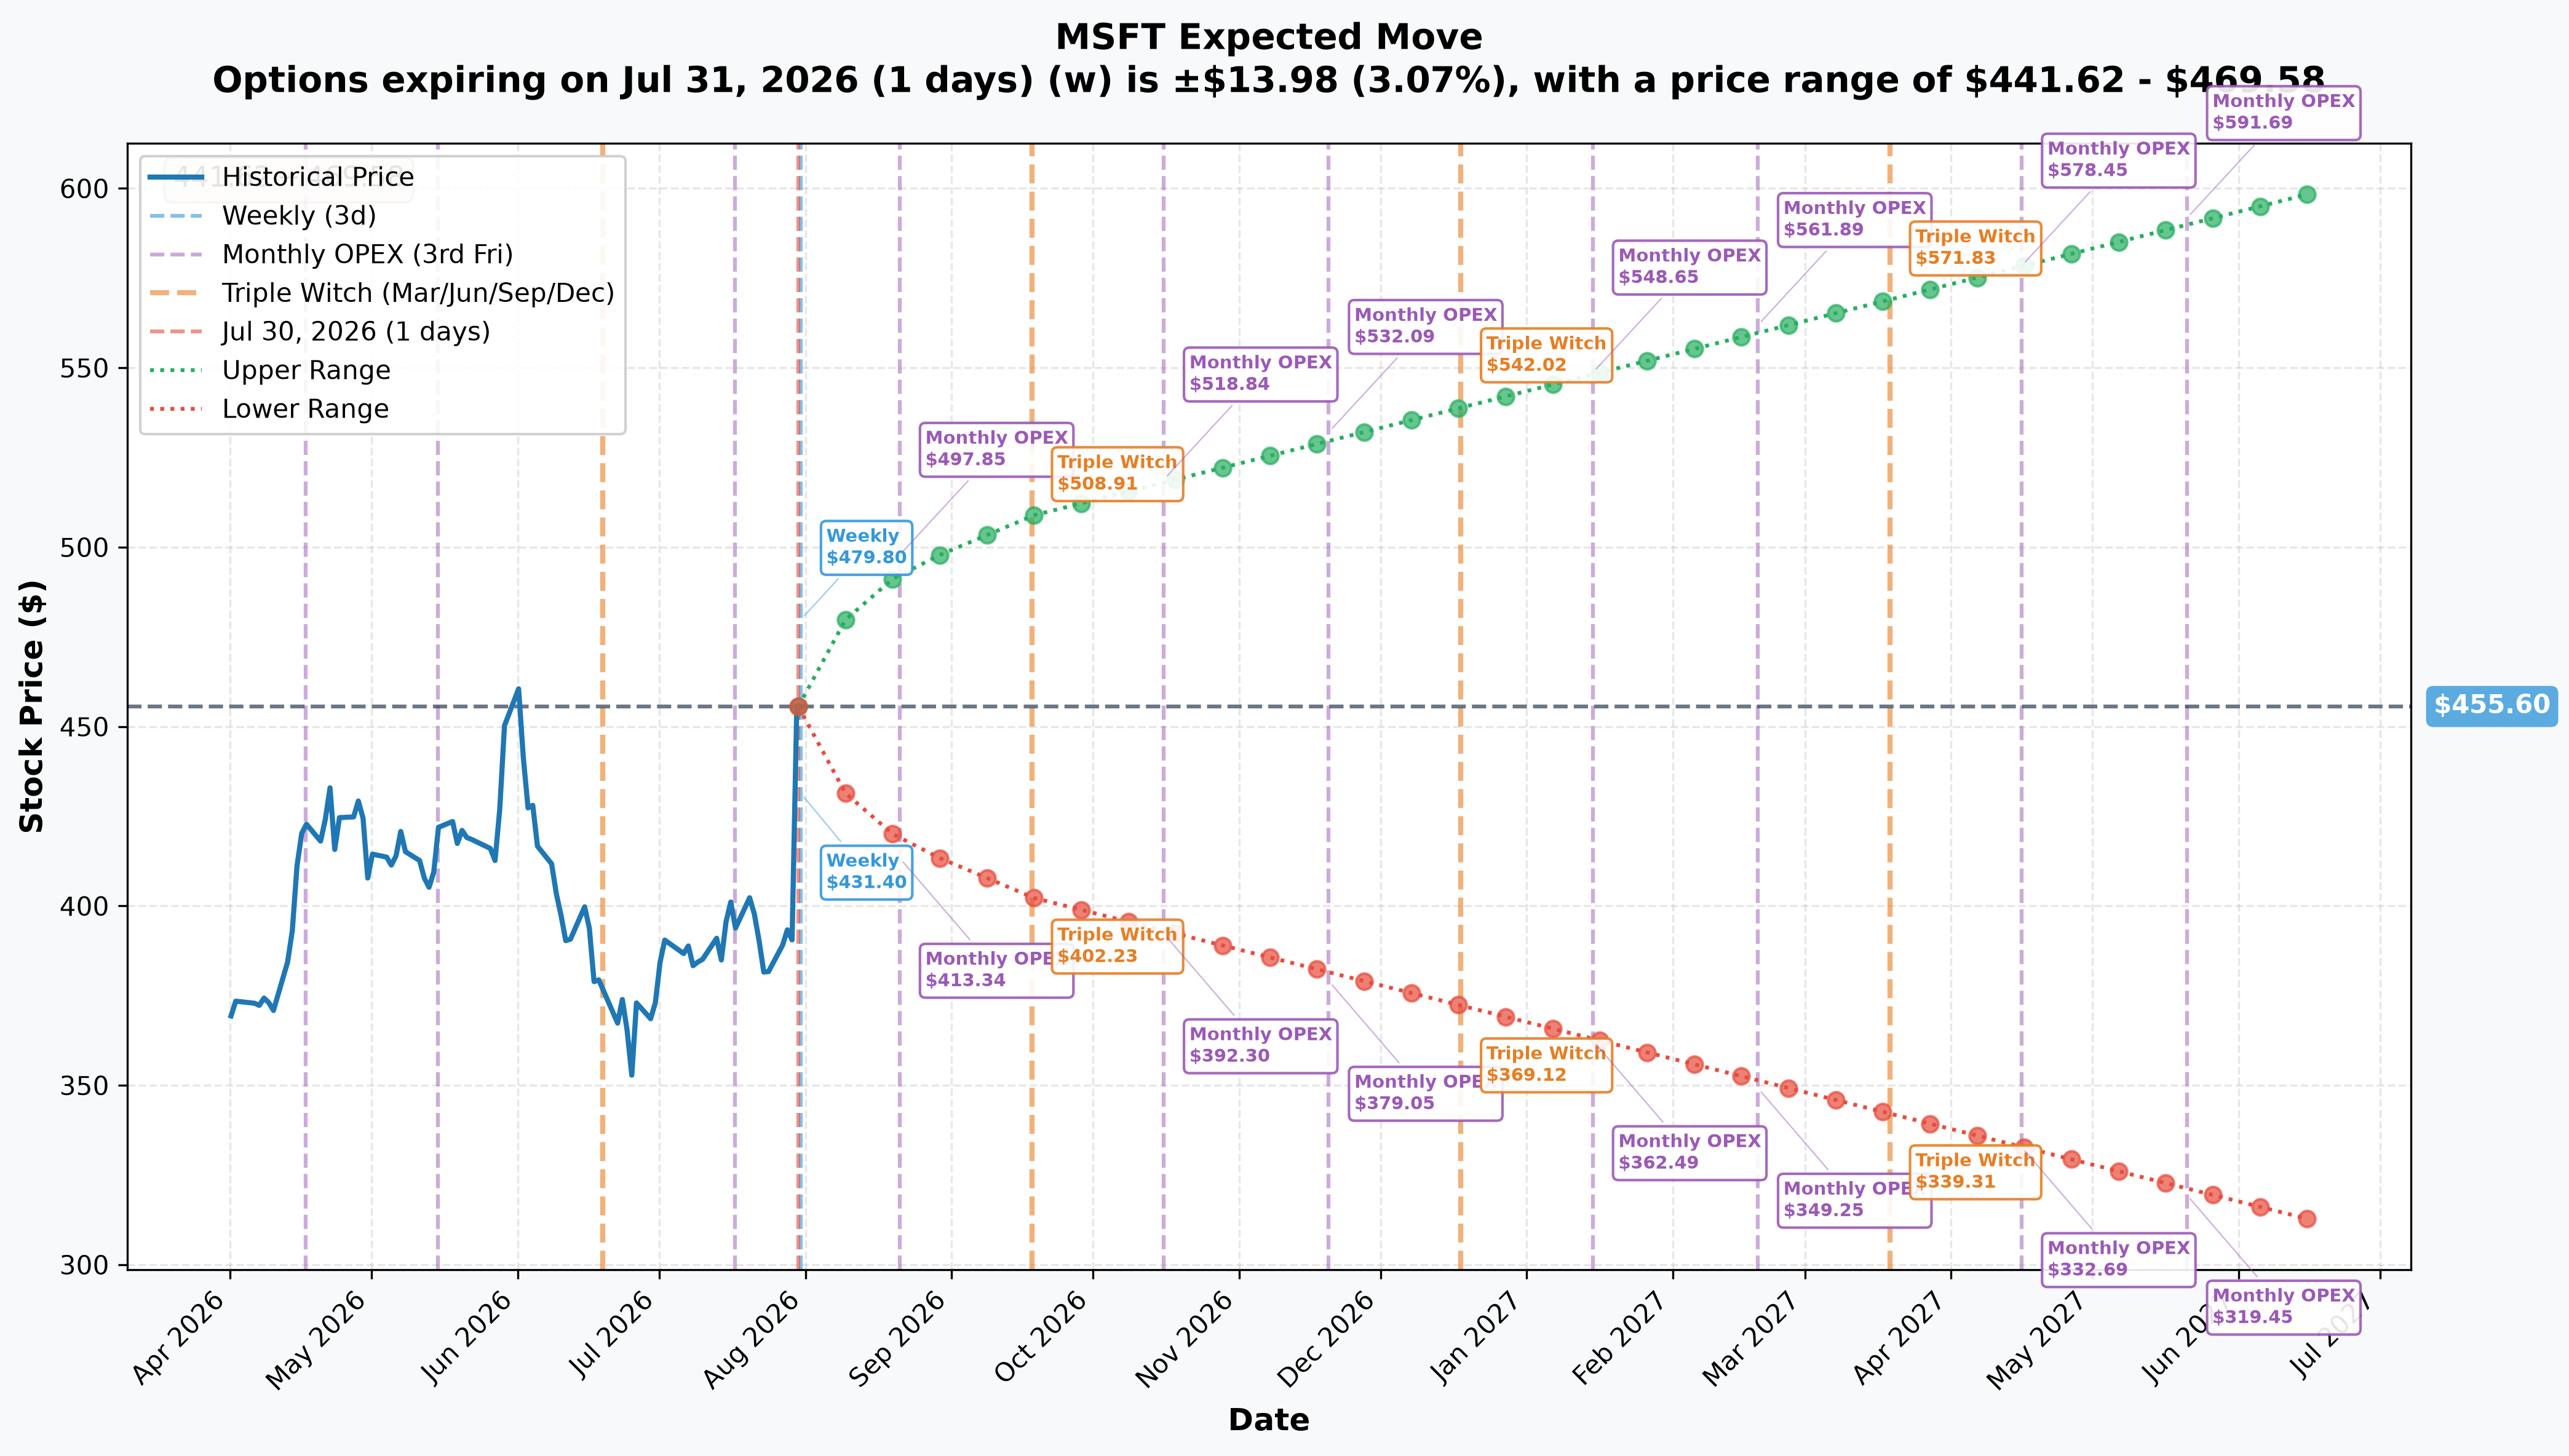
What the options market is pricing in for upcoming expirations:
- 📅 Weekly (July 31 — 1 day): ±3.1% (±$13.98) → Range: $441.62 – $469.58
- 📅 Monthly OPEX (August 21 — 22 days): ±8.3% (±$37.82) → Range: $417.78 – $493.42
- 📅 September 18 — 50 days, SAME EXPIRATION AS THIS TRADE: ±11.7% (±$53.34) → Range: $402.23 – $508.91
- 📅 Yearly LEAPS (June 2027 — 322 days): ±31.5% (±$143.41) → Range: $312.16 – $598.98
Translation for regular folks: by the exact date this $470 call expires, options pricing implies MSFT could realistically trade anywhere between $402 and $509. The $470 strike sits only about 27% of the way into that priced range above spot — meaning the market itself thinks a move to $470 (and beyond) is well within the realm of a "normal" 50-day move, not a moonshot. That's a meaningfully easier target than it might first appear.
🎪 Catalysts
✅ Already Happened (Last 3 Days)
Fiscal Q4 2026 Earnings — Reported July 29, After Close 📊
According to CNBC's earnings report, Microsoft posted revenue of $90.01B (+18% YoY) against a ≈$87.6B Street consensus, with EPS of $4.74 beating the $4.24 estimate. The headline number, per GuruFocus's earnings call highlights: Azure grew +43% and crossed $100B in annual revenue for the first time, accelerating from +40% the prior quarter.
Per InfotechLead's coverage, management guided FY2027 capex to a striking $255–260B — while simultaneously trimming calendar-2026 capex to ≈$175B, a "spend into demand but stay disciplined near-term" combination that 24/7 Wall Street reports drove shares up as much as ≈9% and lifted most Wall Street price targets.
Copilot Monetization Inflecting 🤖
Per Yahoo Finance's earnings call recap, Microsoft 365 Copilot surpassed 30 million paid seats, Copilot revenue accelerated more than 60% sequentially after usage-based billing rolled out, GitHub Copilot hit 50 million users, and Azure AI Foundry reached 100,000 customers.
Analyst Targets Moving Up 📈
Following the beat, ChartMill's analyst-ratings tracker shows KeyCorp upgrading MSFT to Overweight with a $630 price target, while Bernstein raised its target to $641 and Evercore ISI lifted its target to $528 — a cluster of new targets well above the $470 strike this trader bought.
🔮 Upcoming (Next 6 Months)
Fiscal Q1 2027 Earnings — Expected Late October 2026
The next major test: whether Azure hits the ≈45% constant-currency growth guide management just issued for the September quarter, per GuruFocus's earnings coverage — a date that falls after this September 18 call expires, meaning the buyer is betting on momentum into earnings, not the earnings print itself.
Ignite 2026 (Typically November)
Microsoft's flagship enterprise/AI conference is a likely venue for new Copilot, Azure AI Foundry, and agentic-AI product announcements, per Yahoo Finance.
AI Capex Execution — The Dominant Swing Factor
The $255–260B FY2027 capex plan is enormous, and per InfotechLead, investors will scrutinize every quarter for return-on-investment evidence versus margin pressure. This is the single biggest swing factor for where MSFT trades over the life of this option.
OpenAI's ≈$250B Azure Compute Commitment
Per The Hill's coverage of the OpenAI restructuring, OpenAI committed to purchase an incremental ≈$250B of Azure compute as part of its recapitalization — the cadence at which that commitment feeds into reported Azure bookings over coming quarters is a real near-term catalyst.
🎲 Price Targets & Probabilities
Using the gamma levels and implied-move data above, here's how the path to (and past) $470 breaks down through the September 18 expiration:
📈 Bull Case (≈30% probability)
Target: $480–$510
Azure's ≈45% constant-currency guide for the September quarter gets increasingly confirmed by trickle-down commentary, analyst targets keep drifting toward the new $528–$641 cluster, and the stock clears both the $460 and $470 gamma walls on continued institutional buying. The implied-move upper bound of $508.91 by September 18 is the outer edge of what options pricing considers plausible — this is where the $470 calls get genuinely exciting.
🎯 Base Case (≈45% probability)
Target: $450–$470 range (grinding higher, chopping at gamma walls)
MSFT spends the next several weeks fighting through the dense $450–$460 gamma cluster, digesting the post-earnings pop rather than extending it in a straight line. This is the most statistically likely outcome given how much dealer hedging is concentrated right at today's price — the $470 calls would be roughly breakeven-to-modestly profitable in this scenario, depending on how close to expiration MSFT gets there.
📉 Bear Case (≈25% probability)
Target: $420–$440 (fade back toward pre-earnings levels)
If capex-versus-monetization anxiety resurfaces — a common pattern after big AI-spending beats — or the broader market rotates out of mega-cap tech, MSFT could give back a meaningful chunk of Tuesday's gains. The $440 gamma support and the $417.78 lower bound of the monthly-OPEX implied move mark the levels to watch; a break below $440 would put real pressure on this $470 call expiring worthless.
👥 How Different Traders Should Read This
🎰 YOLO Trader
This is basically the trade you're already looking to make, just done bigger and earlier. If you believe Azure's re-acceleration keeps grinding MSFT higher into September, the $470 calls are a clean, liquid way to express that — but understand you're buying leverage on a stock that just made an 8.9% move, and a chunk of that enthusiasm may already be priced in. Size this like the speculative bet it is.
📊 Swing Trader
The setup here is textbook: a confirmed catalyst (the earnings beat), a clear technical level to lean on ($460–$470 gamma resistance), and a defined time horizon (September 18 OPEX, which conveniently lines up with the market's own implied-move pricing). Consider a tighter-dated call or a call spread targeting the $460–$470 zone rather than matching this trader's full 50-day time horizon, especially if you want to reduce theta bleed while still riding the post-earnings drift.
💰 Premium Collector
This print isn't your trade directly, but it tells you where the crowd's attention (and dealer gamma) is concentrated — $460, $470, and $480. A cash-secured put or covered call structured around the $440–$450 support zone lets you collect premium from elevated post-earnings implied volatility without needing to guess whether MSFT clears $470.
🌱 Just Getting Started
Before doing anything with options here, know this: this trader risked their entire $13M premium if MSFT is below $470 on September 18 — that's the whole bet, gone, no partial credit for being "close." Options like this are a leveraged, binary-ish bet on a price level and a date, not a way to "invest in Microsoft." If you're new, consider simply owning MSFT shares directly (no expiration date, no total-loss risk) rather than replicating this specific options trade.
⚠️ Risk Factors — What Could Go Wrong
-
✅ Open vs. close is now RESOLVED — and it came back opening. OI went 10,736 → 21,511 (+10,775 against a 9,953-lot print), so the position-unwind scenario is ruled out. This risk is retired; the remaining risks below are the ones that still matter.
-
💸 Capex/ROI risk is the central bear case. The $255–260B FY2027 capex guide is a multi-year bet on AI demand converting to durable, high-margin revenue. If monetization stalls even briefly, free cash flow and margins compress at a stock already trading ≈25x forward earnings — leaving little room for error.
-
🏭 Capacity constraints could cap near-term upside. Management has repeatedly flagged being capacity-constrained; how fast the new capex converts into bookable Azure AI capacity is a real near-term risk to the growth narrative this trade is betting on.
-
🤝 OpenAI dependency and optionality loss. Microsoft no longer holds first right of refusal as OpenAI's compute provider, and OpenAI is now free to run workloads on rival clouds — a strategic moat that could erode gradually over time.
-
📊 A single $13M trade is not "the market." This is one trader's bet, not proof that institutional money broadly agrees. Even with the bullish framing above, options flow data has historically shown limited reliable directional signal on its own — it's context, not a crystal ball.
-
🎢 Gamma walls cut both ways. The same $460–$470 dealer hedging that could create resistance on the way up would also create support-turned-resistance if the stock reverses — meaning a failed breakout attempt could stall out and decay this position through simple time value erosion even without bad news.
-
⏰ Time decay is real and unforgiving. With ≈50 days to expiration, theta accelerates as September 18 approaches. A slow, sideways grind in the $450–$460 zone — the base case above — erodes this position's value every single day even if the long-term Azure thesis is ultimately correct.
🎯 The Bottom Line
Real talk: the morning after Microsoft's best earnings reaction in a while, someone paid up — literally, at the ask — for ≈$13M of September $470 calls. The mechanics say this was real aggression, not a lazy fill or a hedged institutional package. The catalyst context (Azure re-accelerating past $100B, disciplined near-term capex, Copilot monetization inflecting, a fresh wave of analyst upgrades) gives the bullish read real support.
And the caveat that mattered most has now been settled — in the bulls' favor. We flagged that this trade's size sat right on top of existing open interest, so we could not prove it opened a brand-new position versus closing an old one — the difference between "smart money presses the breakout" and "someone just banked a profit and left." The July 31 pre-market OPRA snapshot answered it: OI 10,736 → 21,511, up 10,775 against a 9,953-lot print. This was a fresh opening buy, with other traders opening alongside it. The "banked a profit and left" reading is dead.
If you're bullish on MSFT: the $460–$470 gamma zone is your line in the sand — watch for a clean break above $470 as confirmation the market agrees with this trader's thesis.
If you're watching from the sidelines: the open/close question is resolved, so the $13M headline is real new risk capital — but one trader's confirmed opening bet is still context, not a signal to follow.
Mark your calendar:
- ✅ July 31, ≈06:30 ET — next-day OPRA open-interest snapshot (done — confirmed OPEN)
- 📅 August 21 — monthly options expiration
- 📅 September 18, 2026 — this trade's expiration date (also a quarterly triple-witch date)
- 📅 Late October 2026 — fiscal Q1 2027 earnings (Azure growth guide test)
Disclaimer: Options trading involves substantial risk of loss and is not suitable for all investors. This analysis is for educational purposes only and is not financial advice. Past performance doesn't guarantee future results. The open/close status of this trade has been resolved by the July 31 next-day OPRA open-interest snapshot: confirmed opening (BTO). What the tape still cannot reveal is the trader's identity, motive, or any offsetting position held elsewhere. Always do your own research and consider consulting a licensed financial advisor before trading.
Last updated: 2026-07-31 — next-day OPRA open-interest confirmed this trade as an OPENING buy (OI 10,736 → 21,511, +10,775).