🔄 MSFT $9.48M Roll — Someone Just HALVED Their Bet Into the Post-Earnings Pop
📅 August 3, 2026 | 🔥 Unusual Activity Detected
⚠️ UPDATE — August 4, 2026 pre-market: the October leg is confirmed open; the August leg's open/close test came back INCONCLUSIVE. The Oct $510 call rose 253 → 52,671. The Aug $460 call rose 59,187 → 81,378 (+22,191) — but that strike traded 53,456 contracts on the day (our print was 7,435), so our leg cannot be isolated. The roll read now rests on structure, not on OI. See the ✅ RESOLVED box.
🎯 The Quick Take
At 10:46:32 this morning, someone sold a deep-in-the-money August $460 call position — the structure says closing it, though the next-day open-interest test could not confirm that (see the ⚠️ box above) — and opened a smaller, higher-strike October $510 call — an electronically matched two-leg package, 7,435 contracts on each side. Net effect: $9.48 million collected in credit, and the underlying delta exposure roughly cut in half, from ≈597,328 shares to ≈304,315 shares. With MSFT sitting at $486.49 after a jaw-dropping post-earnings run, this reads like someone taking money off the table, not pressing the bet.
🏢 Company Overview
Microsoft Corporation (MSFT) trades on the Nasdaq with a market cap of ≈$3.62 trillion, operating in Information Technology — software and cloud infrastructure. The company runs three segments: Productivity and Business Processes (Microsoft 365, LinkedIn, Dynamics), Intelligent Cloud (Azure, servers, enterprise services), and More Personal Computing (Windows, Devices, Search, Xbox). Headquartered in Redmond, Washington, with ≈223,000 employees.
Despite the recent fireworks, MSFT is only ≈+3.0% YTD — this is a stock that spent much of 2026 in a drawdown before an explosive three-day repricing.
💰 The Option Flow Breakdown
📊 What Just Happened
An electronically matched two-leg package printed at 10:46:32 ET — 7,435 contracts on each leg, spot $486.49. This is not a negotiated floor cross and not a lit sweep; it's a worked multi-leg order that closed one position and opened another in the same instant.
| Time | Buy/Sell | Call/Put | Expiration | Strike | Premium | Volume (day) | Prior OI | Size | Spot | Option Price | Option Symbol |
|---|---|---|---|---|---|---|---|---|---|---|---|
| 10:46:32 | SELL (at the bid) | CALL | 2026-08-21 | $460 | $22,788,275 | 33,211 | 59,187 | 7,435 | $486.49 | $30.65 | MSFT20260821C460 |
| 10:46:32 | BUY (at the ask) | CALL | 2026-10-16 | $510 | $13,308,650 | 32,226 | 253 | 7,435 | $486.49 | $17.90 | MSFT20261016C510 |
Net CREDIT: $12.75/share × 7,435 contracts × 100 = $9.48 million.
🔄 Structure tag: MULTI-LEG ROLL (electronic). This is not a 🤝 block cross and not an auction — the tape shows a genuine electronic multi-leg combo, and it should be described that way, never as a raw condition code.
The Aug $460 call was deep in the money — intrinsic value alone was $26.49 against a $30.65 sale price, meaning the seller captured almost all the remaining time value too. The Oct $510 call is further out of the money (≈4.9% above spot) and much further out in time.
✅ RESOLVED — Next-Day OI Is In (August 4, 2026 pre-market)
The OPRA open-interest snapshot timestamped August 4, 2026 ≈06:30 ET reflects the close of business August 3 — the definitive open-vs-close test we flagged when this published. Here is what it says.
| Leg | Baseline OI (Aug-3 snap) | Resolving OI (Aug-4 snap) | Δ | Print size | Day volume at strike | Verdict |
|---|---|---|---|---|---|---|
| Oct-16-2026 $510 call (bought) | 253 | 52,671 | +52,418 | 7,435 | 54,520 | ✅ OPEN (BTO) — confirmed |
| Aug-21-2026 $460 call (sold) | 59,187 | 81,378 | +22,191 | 7,435 | 53,456 | ⚠️ INCONCLUSIVE — cannot isolate |
We owe readers a correction on the test itself, not just the answer. The article said: "OI down by roughly 7,435 confirms a close; OI flat-to-up would mean this was actually a fresh short position, which would flip the entire read." That criterion was stated too strongly. It assumed our 7,435-lot print was the dominant flow at that strike. It was not — the August $460 call traded 53,456 contracts on August 3, more than seven times our block, across more than 1,400 separate prints. With that much unrelated activity, a rising strike-level open interest is fully compatible with our specific leg having closed. The arithmetic allows a complete close, a complete open, or anything between.
So the honest verdict is: unresolved at the leg level, and it will stay that way. No future OI snapshot can retroactively separate one 7,435-lot print from 46,021 contracts of other flow in the same session.
What we still believe, and on what basis
The roll read does not collapse — it simply rests on the evidence it always actually rested on, which is structural, not open-interest based:
- Both legs printed in the same instant, at the same size (7,435 each) as one electronically matched multi-leg package. Same-size, same-millisecond pairs across two expirations are the signature of a roll, not of two unrelated trades.
- The August leg was sold at the bid on a deep-in-the-money call that was ≈86% intrinsic value — the profile of someone getting out, not someone writing new premium (a fresh short seller would not choose a deep-ITM strike with almost no time value to sell).
- The economics described in the article are unchanged either way: $9.48M in net credit came off the table, and share-equivalent delta was roughly halved from ≈597,328 to ≈304,315 shares. That arithmetic depends on the two prints, not on their open/close labels.
Note on the site badge: the web app marks the August leg OPEN. That flag comes from an automated rule reading strike-level open interest, which rose — it is not confirmation that this leg opened, and it does not override the inconclusive verdict above.
The October $510 leg, by contrast, is settled: open interest went from 253 to 52,671, with ≈96% of that strike's entire day volume creating new contracts. That leg is unambiguously BTO. Someone is genuinely long a new October $510 call position.
🤓 What This Actually Means — Plain English
Think of it like this: somebody was long a big pile of deep-in-the-money August $460 calls on Microsoft. Those calls behaved almost exactly like owning the stock outright — call it ≈80 delta, meaning roughly 597,328 shares' worth of upside exposure (7,435 contracts × 100 × ≈0.80 delta).
After MSFT ripped +24.6% in three sessions post-earnings, they decided to lock in the gain. So they:
- Sold to close (STC) the August $460 calls at $30.65 — collecting $22.79M and banking most of the built-up profit on that position.
- Bought to open (BTO) a fresh October $510 call at $17.90 for $13.31M — a smaller, further-out-of-the-money, longer-dated position.
Because the new calls are struck higher and expire two months later, they carry a much lower delta — roughly 0.41, or ≈304,315 shares' worth of exposure (7,435 × 100 × ≈0.41). That's the whole story: the delta got roughly cut in half, and $9.48M in cash came off the table in the process.
This is the textbook shape of a long call roll, up and out — but the tone matters here. A roll up-and-out after a huge rally usually gets written as "doubling down on the breakout." That is not what the numbers say today. The position size in shares-equivalent terms was halved, not maintained or increased, and the trade generated a net credit rather than requiring fresh capital. This reads as de-risking a position that already worked, not chasing more of the move. Somebody is still bullish enough to stay long calls — just half as bullish, with money already banked.
📈 Technical Setup / Chart Check-Up
YTD Chart
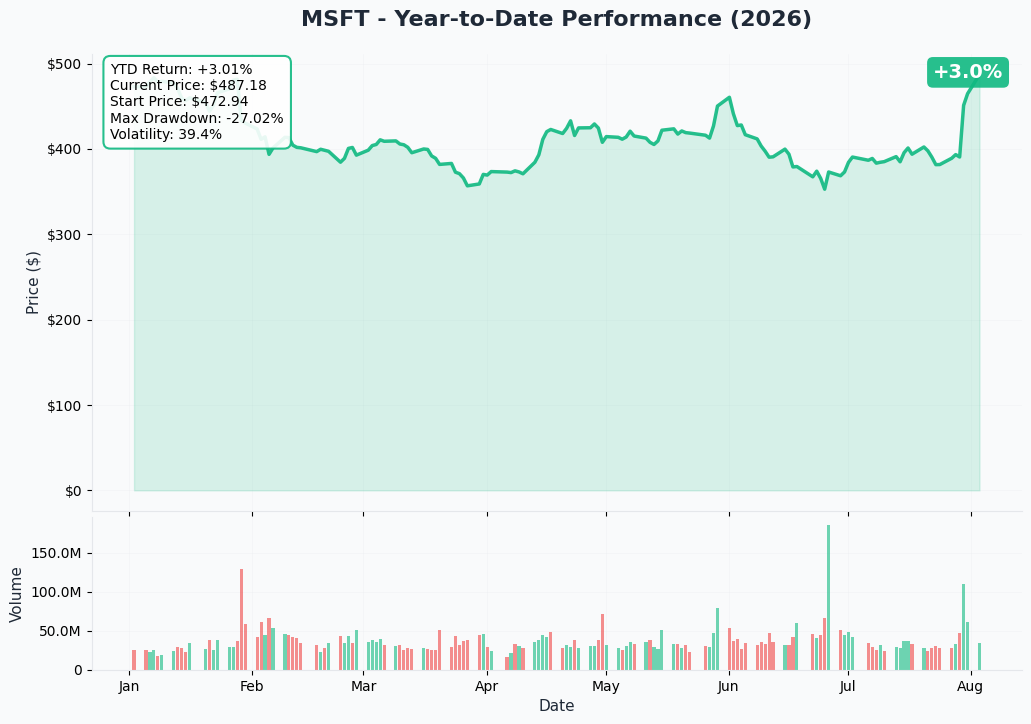
MSFT's 2026 has been a story of two very different stocks: a slow grind lower for most of the year (down as much as −10.98% in a single month, June) followed by a violent +24.6% three-session repricing after the July 29 FY26 Q4 earnings report — the stock's post-earnings move on 109.4M shares, ≈3.1x its 20-day average volume. Volume has since decayed toward normal (32.0M shares on August 3) even as price kept climbing, which is more consistent with a chase/short-covering dynamic than fresh accumulation.
🎯 Gamma-Based Support & Resistance Analysis
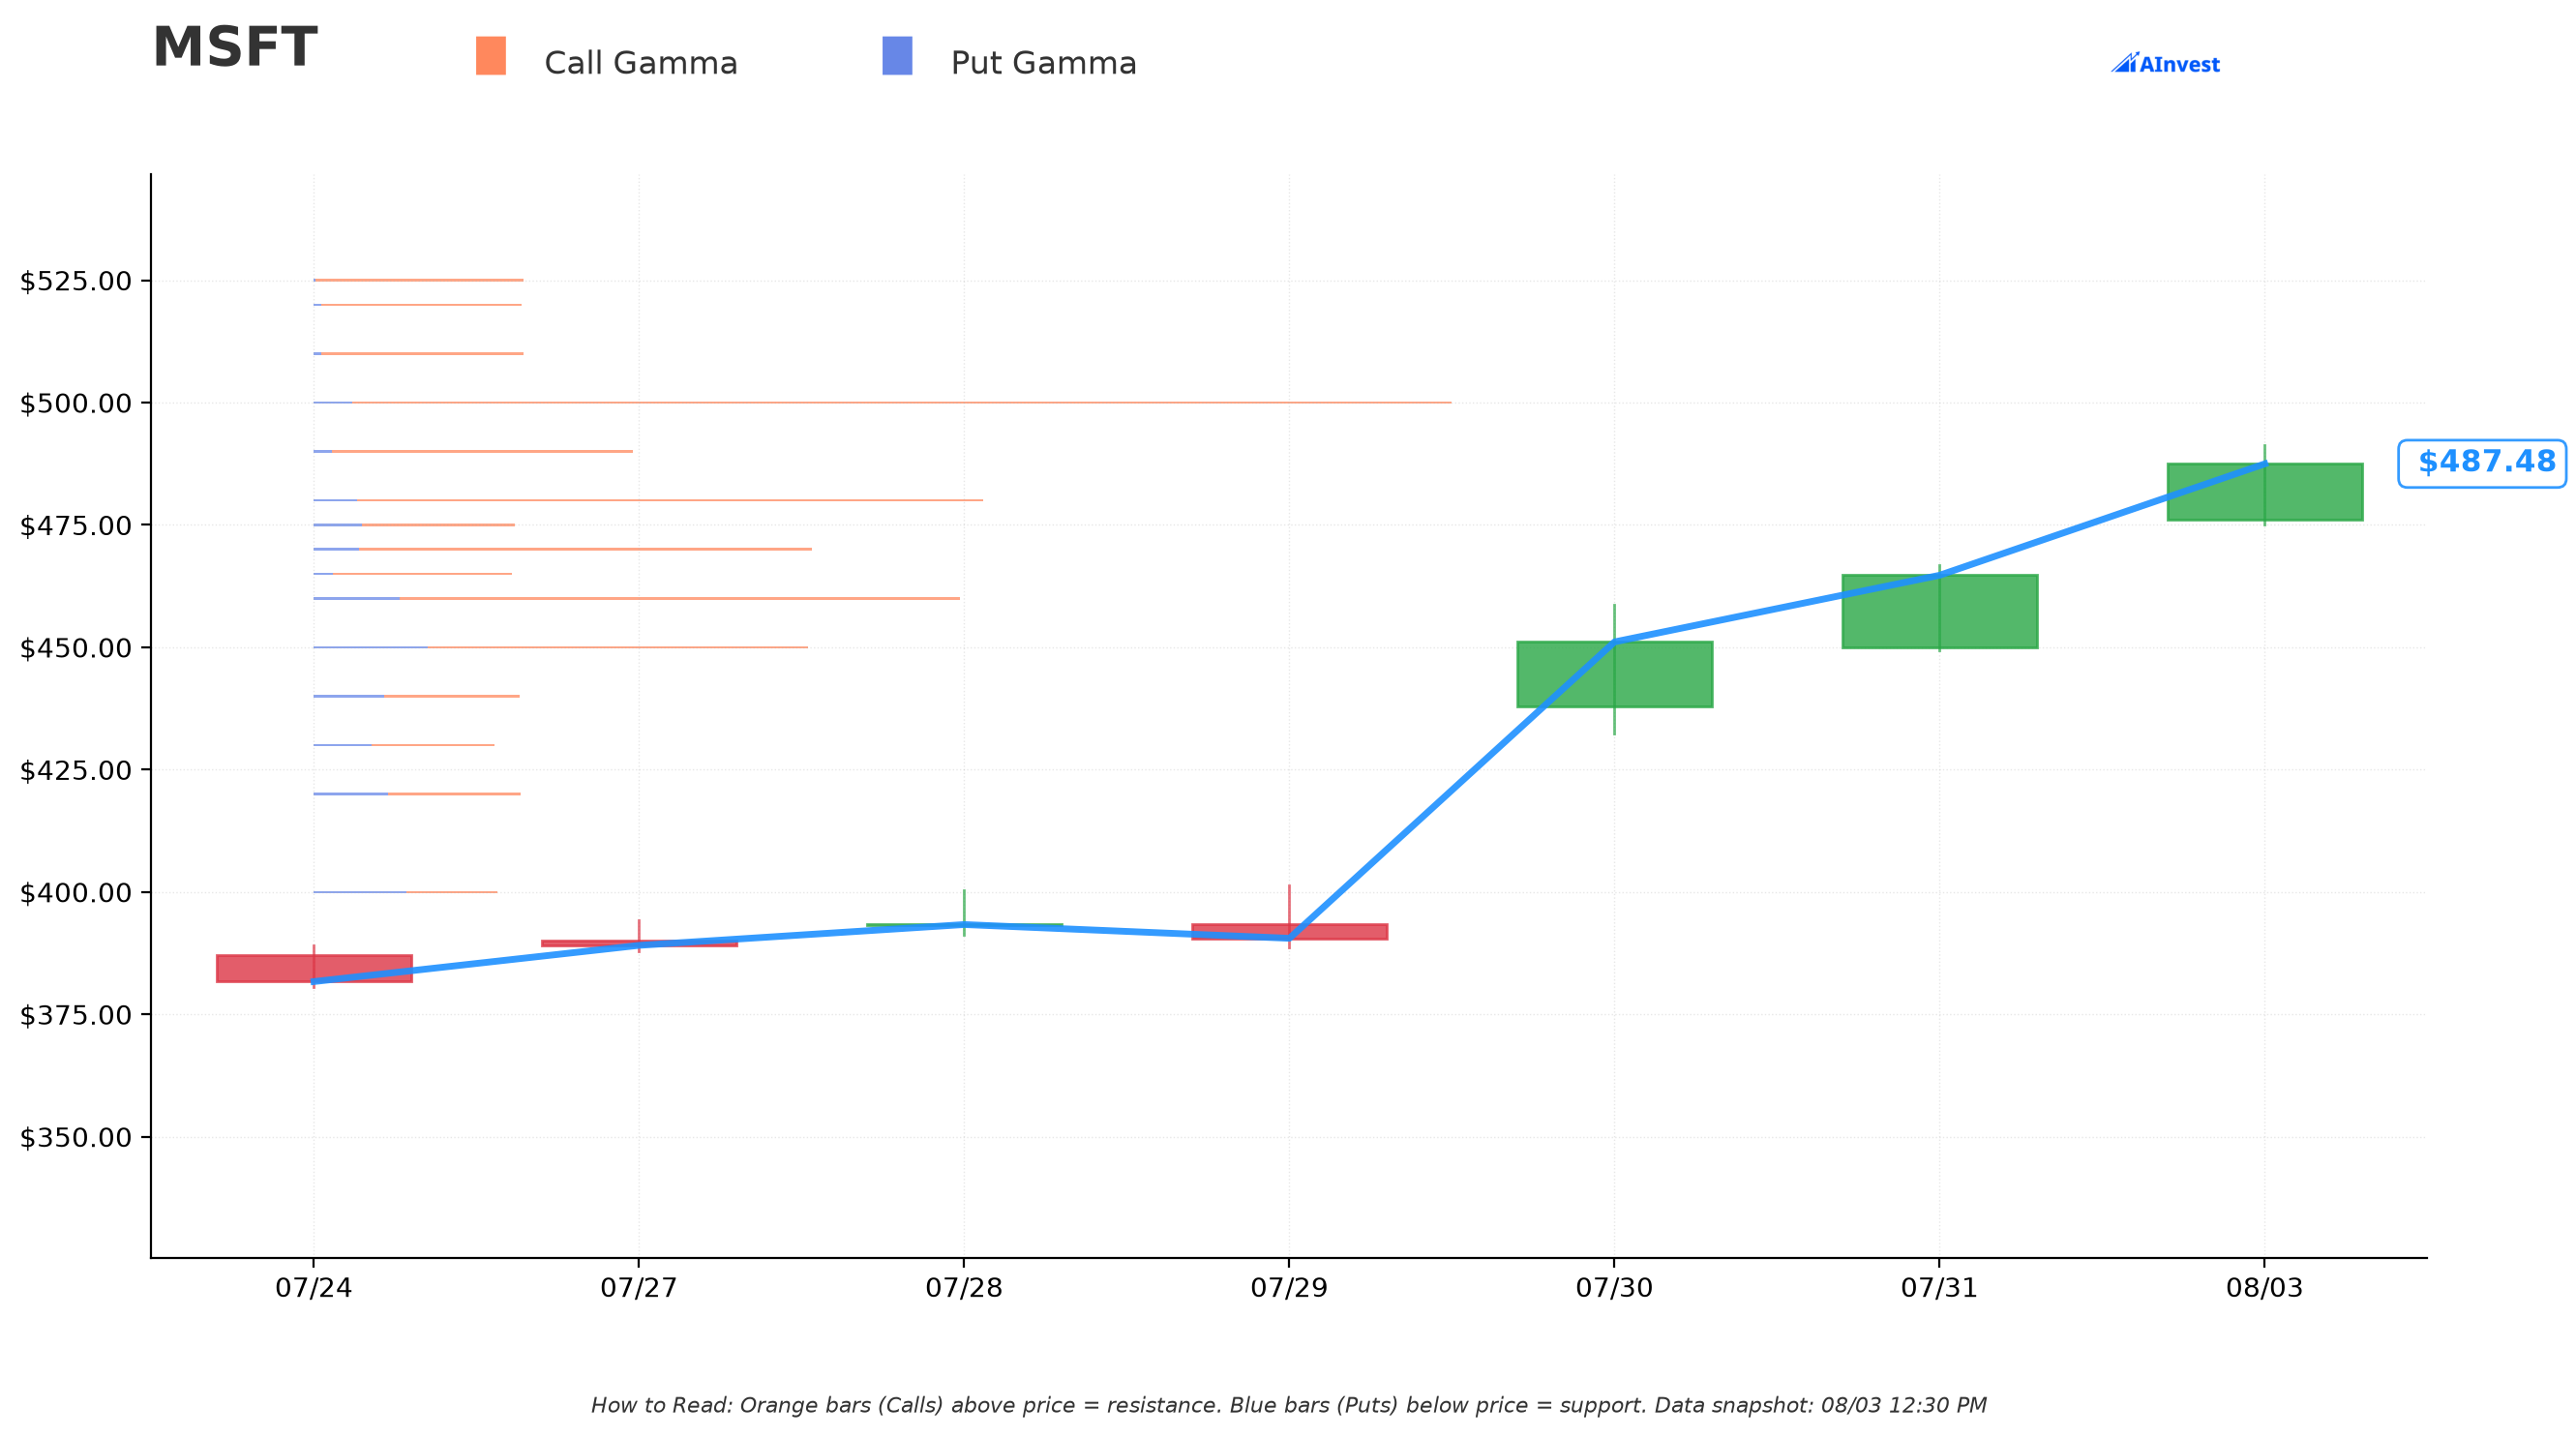
With spot at $487.46, the dealer gamma map shows a clean structure around this trade:
🔵 Support (below spot):
- $480 — Very Strong, net gamma exposure ≈$36.3M, only ≈1.5% below spot
- $460 — Very Strong, net gamma exposure ≈$29.5M, ≈5.6% below spot — this is exactly the strike the closed position was struck at
- $450 — Very Strong, net gamma exposure ≈$16.4M, ≈7.7% below spot
🟠 Resistance (above spot):
- $490 — Very Strong, net gamma exposure ≈$17.9M, ≈0.5% above spot
- $500 — Very Strong, net gamma exposure ≈$66.9M — the single strongest gamma level on the entire board, ≈2.6% above spot
- $510 — Very Strong, net gamma exposure ≈$12.2M, ≈4.6% above spot — the exact strike the new October call was struck at
What this means in plain terms: the closed August $460 calls sat right on top of a major support wall — dealers who are long gamma there tend to buy dips and dampen downside. The newly opened October $510 calls sit right at a resistance wall, meaning if MSFT keeps grinding higher, $500 (the biggest wall on the board) is the level dealers will lean against first, with $510 as the next speed bump above that. The rolled position was moved from underneath a support shelf to right at a resistance ceiling — consistent with someone repositioning for a slower, more moderate continuation rather than another vertical breakout.
🎲 Implied Move Analysis
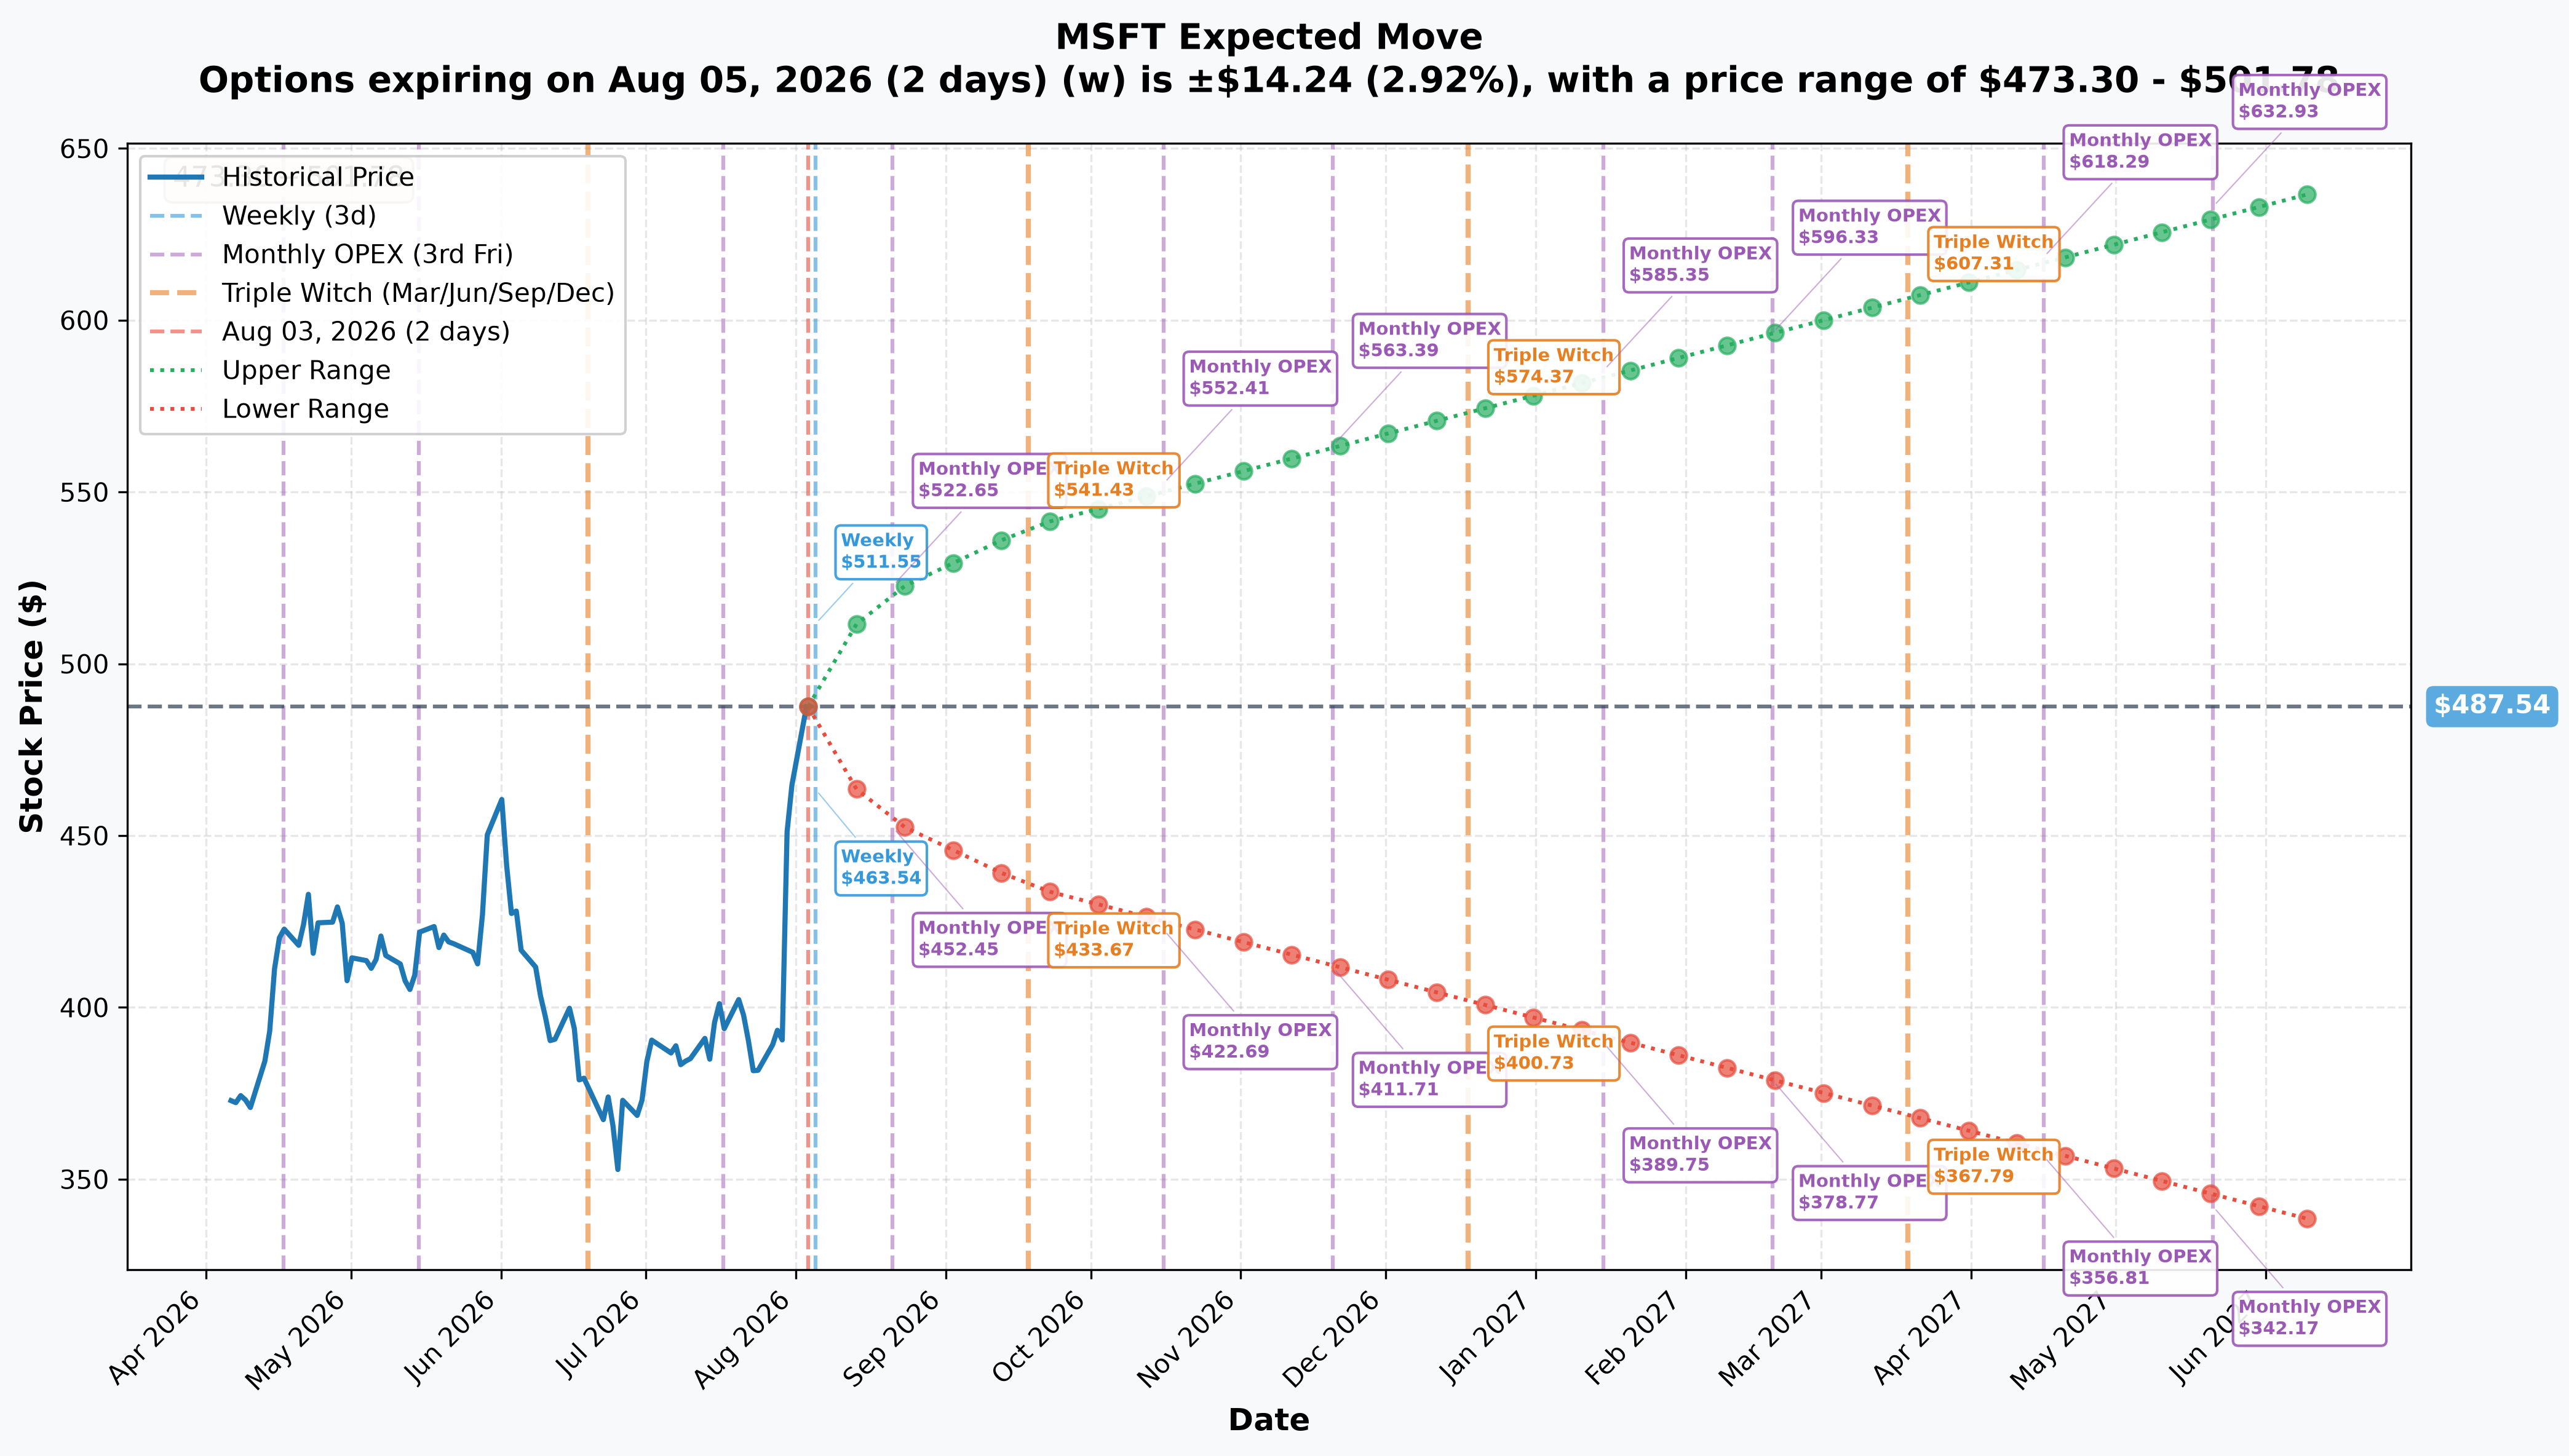
- Weekly (Aug 5, 2 days): ±2.92% (±$14.24) → range $473.30 – $501.78
- Monthly OPEX (Aug 21, 18 days) — the closed leg's own expiry: ±6.93% (±$33.77) → range $453.78 – $521.32
- Quarterly triple witch (Sep 18, 46 days): ±10.75% (±$52.42) → range $435.13 – $539.97
- October 16 OPEX (74 days) — the new leg's expiry: range ≈$422.69 – $552.41
The $460 strike that got closed sits comfortably inside even the shortest Aug 21 implied-move range — no real dispute there, it was simply deep ITM. The new $510 strike sits inside the Oct 16 implied-move range but toward the upper half of it — the market is pricing real odds MSFT could reach or pass $510 by mid-October, without requiring an extreme move.
🎪 Catalysts
✅ Already Happened (Past 3 Months)
Microsoft reported FY26 Q4 earnings on July 29, 2026 (after the close), and it was a blowout: revenue $90.01B vs $87.62B consensus, non-GAAP EPS $4.74 vs $4.24, with Azure growing +43% year over year and crossing $100 billion in annual revenue for the first time in FY26 (+41% full year), per Microsoft's FY26 Q4 press release. Commercial RPO hit $678 billion, +84% year over year — though +25% excluding OpenAI commitments (FY26 Q4 event page). The stock responded with +15.51% on July 30 (109.4M shares, ≈3.1x average volume), then +3.02% and +4.70% in the two sessions since, for a cumulative +24.6% move (price history).
Notably, a meaningful chunk of the EPS beat was non-operating: Microsoft's OpenAI stake swung ≈$8.6 billion year over year (from a $3,620M loss in FY25 to a $4,963M gain in FY26, worth $0.67/share), and a $3.2 billion mark-to-market gain on the Anthropic investment added roughly $0.27/share to the discrete-item benefit (FY26 Q4 press release). Post-print analyst targets ranged from $510 (Scotiabank) to $650 (Wells Fargo) — a 27% spread, and Barclays actually cut its target to $512 on the day the stock rose 15.5% (MarketBeat).
📆 The Two Expiries That Matter for This Trade
Neither the closed August 21 leg nor the new October 16 leg contains a Microsoft earnings report. Microsoft's FY27 Q1 earnings are expected ≈October 28, 2026 — an estimate, not yet confirmed by Microsoft — which falls ≈12 calendar days AFTER the October 16 expiry (Yahoo Finance — MSFT, estimated). Microsoft has never reported fiscal Q1 before late October, so the new October call position is not an earnings bet — it expires before the print exists.
Inside the closed Aug 21 expiry: the one confirmed hard-dated event was the $0.91 ex-dividend on August 20 — one day before expiration, which creates real early-assignment risk for anyone holding short ITM calls into that date (stockanalysis.com — dividend page). This trader was long the calls, not short — so this wasn't an assignment-risk exit; it looks more like simple profit-taking ahead of a fairly event-empty expiry.
Inside the new Oct 16 expiry: the confirmed August dividend is inside it, plus a dividend-increase announcement expected around mid-September (Microsoft's 21st consecutive year of raises, prior increase ≈9.6% — dividend page), and possible progress on OpenAI's IPO following its June 8, 2026 SEC filing, which would reprice Microsoft's 27% OpenAI stake, last marked at $135 billion (Wikipedia — OpenAI). None of these are earnings-grade catalysts, which fits a position that's been sized down, not up.
Also worth knowing: management has flagged that Azure demand still exceeds supply with no specific relief timeline (FY26 Q4 event page) — a double-edged catalyst that guarantees revenue on every incremental megawatt but makes the ≈45% Q1 Azure guide a supply-delivery promise rather than a demand promise. And Microsoft's useful-life accounting change extending datacenters and office buildings from 15 to 25 years (same source) is shifting finance leases into operating leases and pushing calendar-2026 capex expectations to ≈$175 billion — an earnings-quality debate that's live among analysts but again isn't a scheduled event inside either of these two expiries. On the product side, Copilot monetization is the clearest genuine acceleration: over 30 million paid Microsoft 365 Copilot seats, net seat adds more than doubling quarter over quarter, and 50 million GitHub Copilot users (FY26 Q4 event page).
🎲 Price Targets & Probabilities
Using the gamma map and implied-move data together:
📈 Bull Case (30% probability) — Target $500–$510
MSFT grinds through the $490 wall and tests the $500 mega-wall (the strongest gamma level on the board) and the new $510 strike by mid-October. Supported by continued Azure capacity delivery headlines and any positive OpenAI IPO news. This is the scenario the person who rolled up is still positioned for — just with half the exposure they had before.
🎯 Base Case (45% probability) — Range $460–$495
Post-earnings drift settles into a range bounded by the $480 support shelf below and the $490–$500 resistance cluster above, consistent with decaying volume after the initial 24.6% pop. Both the dividend (Aug 20) and dividend-raise announcement (≈mid-September) pass without much drama. This is squarely inside the Aug 21 and even most of the Sep 18 implied-move ranges.
📉 Bear Case (25% probability) — Target $450–$460
Some mean reversion off the parabolic three-day move, especially if Barclays-style skepticism about OpenAI-driven RPO gains proves right, or if long-rate pressure (hyperscaler debt issuance pushing rates to 20-year highs) weighs on mega-cap multiples. $460 — the exact strike that was just closed — is also a major gamma support shelf, so a retest there would not be surprising technically.
💡 Trading Ideas
🛡️ Conservative: Wait for the OI Confirmation
Don't assume the Aug $460 close is proven — it isn't, yet. Wait for tomorrow's OPRA open-interest print to confirm this was genuinely closing exposure and not a fresh short position. If confirmed, treat it as one data point supporting a "moderate consolidation" thesis, not a reason to chase the stock here at $486–$487.
⚖️ Balanced: Mirror the De-Risking, Not the Direction
If you're long MSFT calls into this rally, this flow is a reasonable prompt to do the same thing: trim some of the deep-ITM position and roll a portion up and out, banking gains rather than staying maximally exposed after a 24.6% three-day move with zero sell ratings among 47 covering analysts (MarketBeat) — a one-sided setup that offers little cushion if sentiment turns.
🚀 Aggressive: Sell Premium Into the Same $500/$510 Zone
Given the $500 wall is the single strongest gamma level on the board and sits just 2.6% above spot, a defined-risk short call spread around $500/$510 (mirroring where this flow is now positioned) could collect premium on the view that MSFT stalls into that resistance cluster short-term — but note the newly-opened $510 long calls in this very trade suggest at least one sophisticated participant expects that level to eventually give way by October.
⚠️ Risk Factors — What the Tape Cannot Prove
- Open vs. close is not settled. The Aug $460 leg is a "size ≤ prior OI" case — it reads as closing but this is an inference, not a proof, until tomorrow's OI update. If OI does not fall, this entire "de-risking" narrative would need to be revisited.
- We cannot see the account, the broker, or the true motive. OPRA data cannot tell us whether this was one trader or two, whether there's an offsetting equity or futures hedge elsewhere, or whether tax considerations (not view) drove the timing.
- Analyst dispersion is real. Post-earnings price targets span $510 to $650 — a 27% spread on the same release — meaning informed opinion is genuinely split on whether the current price is cheap or full.
- Both expiries are "earnings-free," but that can change. An unscheduled Azure capacity headline, an OpenAI IPO development, or a broader hyperscaler-debt/rate shock could move MSFT well outside the priced implied-move ranges before either expiry arrives.
- The FY27 Q1 earnings date is still an estimate (≈October 28, 2026), not confirmed by Microsoft. If it moves earlier and lands inside the October 16 window, the "no earnings inside this expiry" read would need to be revisited.
🎯 The Bottom Line
Real talk: this is a roll, not a reload. Someone banked $22.79M by closing deep-in-the-money August $460 calls, redeployed $13.31M of that into further-out October $510 calls, pocketed the $9.48M net credit, and walked away with roughly half the delta exposure they started the day with. That is the behavior of a position manager taking a win off the table after a historic three-day, +24.6% repricing — not a fresh, aggressive bullish bet.
Mark your calendar:
- August 20, 2026 — MSFT ex-dividend $0.91, one day before the closed leg's own expiry.
- ≈06:30 ET, next trading day — OPRA open-interest update that resolves whether the Aug $460 leg genuinely closed.
- ≈Mid-September 2026 — expected dividend-increase announcement (21st consecutive year).
- October 16, 2026 — the new call's expiry, which lands ≈12 days before Microsoft's next earnings report.
Disclaimer: Options trading involves substantial risk of loss and may not be suitable for all investors. This analysis is for educational purposes only and is not financial advice. The open/close status of the closed leg is inferred, not proven, until next-day OPRA open interest confirms it. Always do your own research and consider consulting a licensed financial advisor before trading.
Last updated: August 4, 2026 — next-day OPRA open-interest resolution added (✅ RESOLVED box above). Original analysis published August 3, 2026.