🔵 MSFT — Someone Paid Up $11M for September $510 Calls, and the Tape Says They Meant It
📅 2026-08-04 | Unusual Options Activity
🎯 The Quick Take
At 10:06:21 ET, a trader bought 8,020 September-18 $510 calls for $13.70 each — $10,987,400 total — and did it by lifting the offer, not haggling in the middle of the market. Prior open interest on that contract was 6,637, so this is a confirmed new position, and implied volatility ticked up through the print, which is the market's own confirmation that real buying pressure pushed the price. Out of ten unusual tickers on today's board, this was the only trade that took liquidity from a lit order book — everything else printed as a negotiated block, an auction, or a floor cross. That distinction matters: MSFT is the one name today where "someone paid up in a hurry" is a defensible read, not a guess.
🏢 Company Overview
Microsoft Corporation (NASDAQ: MSFT) is the Redmond, Washington-based technology company behind Windows, Office/Microsoft 365, Azure cloud infrastructure, and a growing AI/Copilot product line, led by CEO Satya Nadella with roughly 223,000 employees. Microsoft sits in the Technology / Software – Infrastructure sector with a market cap of ≈$3.69 trillion and trailing-twelve-month revenue of $331.84B (+17.8%), according to stockanalysis.com. Track it here: MSFT on AInvest.
💰 The Option Flow Breakdown
📊 What Just Happened
| Field | Detail |
|---|---|
| Time | 10:06:21 ET |
| Buy/Sell | BUY |
| Call/Put | CALL |
| Expiration | 2026-09-18 |
| Strike | $510 |
| Option Price | $13.70 |
| Premium (total) | $10,987,400 |
| Volume | 9,400 |
| Size (this print) | 8,020 |
| Prior Open Interest | 6,637 |
| Spot at print | $492.30 |
| Option Symbol | MSFT20260918C510 |
| Flow type | ⚡ LIT — took the offer, 100% across the NBBO spread |
- Mechanism: proven LIT. This traded on the regular displayed order book, and the price paid sat right at the ask — meaning the buyer crossed the entire bid-ask spread to get filled rather than waiting for a better price.
- Volatility confirms the buy. Implied volatility on this contract rose from 0.29375 to 0.2978 — up +1.38% — through the print. When a buyer takes real depth off the book, implied vol should tick up with it, and here it did. Aggressor side and volatility both point the same direction.
- Delta exposure: ≈+350,955 shares (0.4376 delta × 8,020 contracts × 100), for $10.99M of premium at risk.
- Breakeven at expiration: $523.70 (strike $510 + premium $13.70), which is +6.4% above the $492.30 spot at the time of the trade and ≈+5.4% above today's ≈$497 level.
✅ RESOLVED — Confirmed Open, and Then Some
Updated 2026-08-05 pre-market. The ≈06:30 ET OPRA snapshot (reflecting the August 4 close) has published.
| Leg | Baseline OI (Aug-4 snap) | Resolving OI (Aug-5 snap) | Δ | Print size | Δ as % of print | Verdict |
|---|---|---|---|---|---|---|
| Sep-18-2026 $510 C (bought) | 6,637 | 15,760 | +9,123 | 8,020 | ≈113.8% | ✅ OPEN (BTO) — confirmed |
We expected OI to land near 14,657. It came in at 15,760 — the strike gained 9,123 contracts against an 8,020-contract print, meaning not only did this trade open cleanly, other buyers opened alongside it at the same strike (day volume was 13,867). No part of this was existing holders trading against each other. The BTO read is confirmed with nothing left provisional.
🤓 What This Actually Means — Plain English
BTO — Bought to Open. Someone opened a brand-new long call position on Microsoft, betting the stock keeps climbing between now and September 18.
"Lifted the offer" means they paid the ask price instead of trying to get a discount by bidding in the middle of the market. Think of it like walking up to a "Buy It Now" listing and paying full price instead of haggling — that's usually a sign the buyer wanted the position more than they wanted a good price on any single share. It's the opposite of a patient, resting order that waits for the market to come to it.
The volatility uptick is the second piece of evidence, and it's the one that separates this trade from every other trade on today's board. Nine of the other ten unusual tickers scanned today printed as crosses, auctions, or floor trades — negotiated deals between two parties who already agreed on a price before it hit the tape. Those trades don't move implied volatility because they don't take anything away from the visible market. This MSFT trade did take displayed liquidity, and implied vol rose right along with it. That agreement between the two signals — aggressive price paid, and volatility moving with the print — is what makes "someone paid up in a hurry" a fair description here, rather than a guess dressed up as certainty.
None of this proves the buyer is right. It proves they were willing to pay for speed and certainty of fill over price.
📈 Technical Setup / Chart Check-Up
YTD Chart
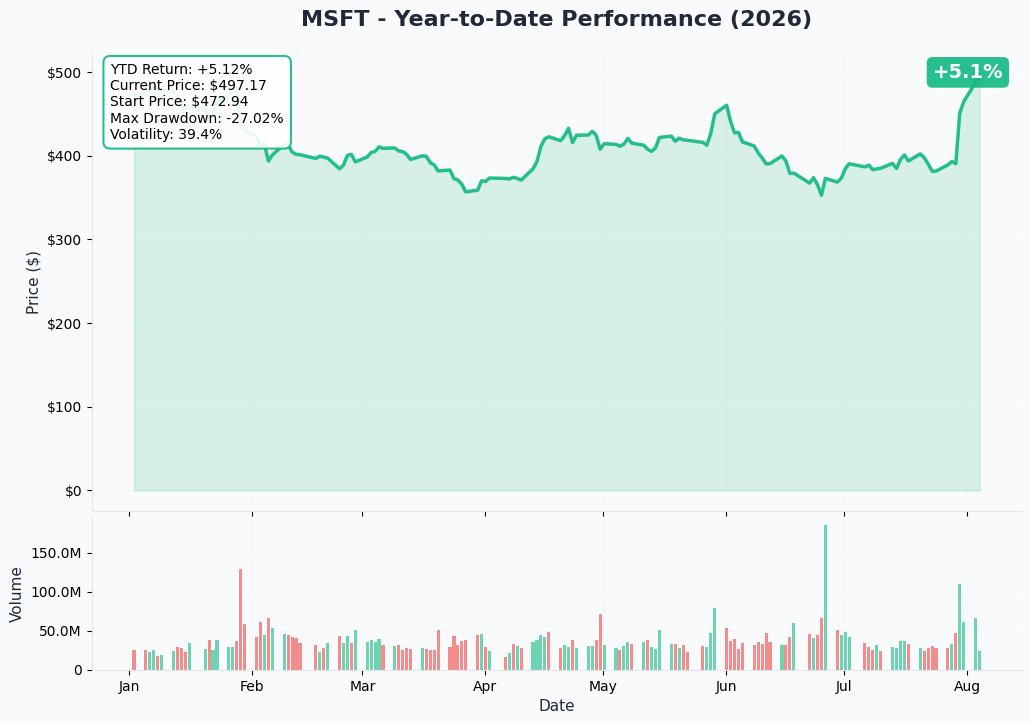
MSFT is up ≈5.1% over the trailing year on the chart, but that headline number hides a rough middle stretch and a violent recovery: the stock is still down ≈5–7% over the past 12 months by two separate providers' measurements, and sits ≈10% below its 52-week high of $553.72, even after ripping higher the past four sessions. This is a recovery rally layered on top of a longer downtrend, not a fresh breakout to new highs.
Gamma-Based Support & Resistance
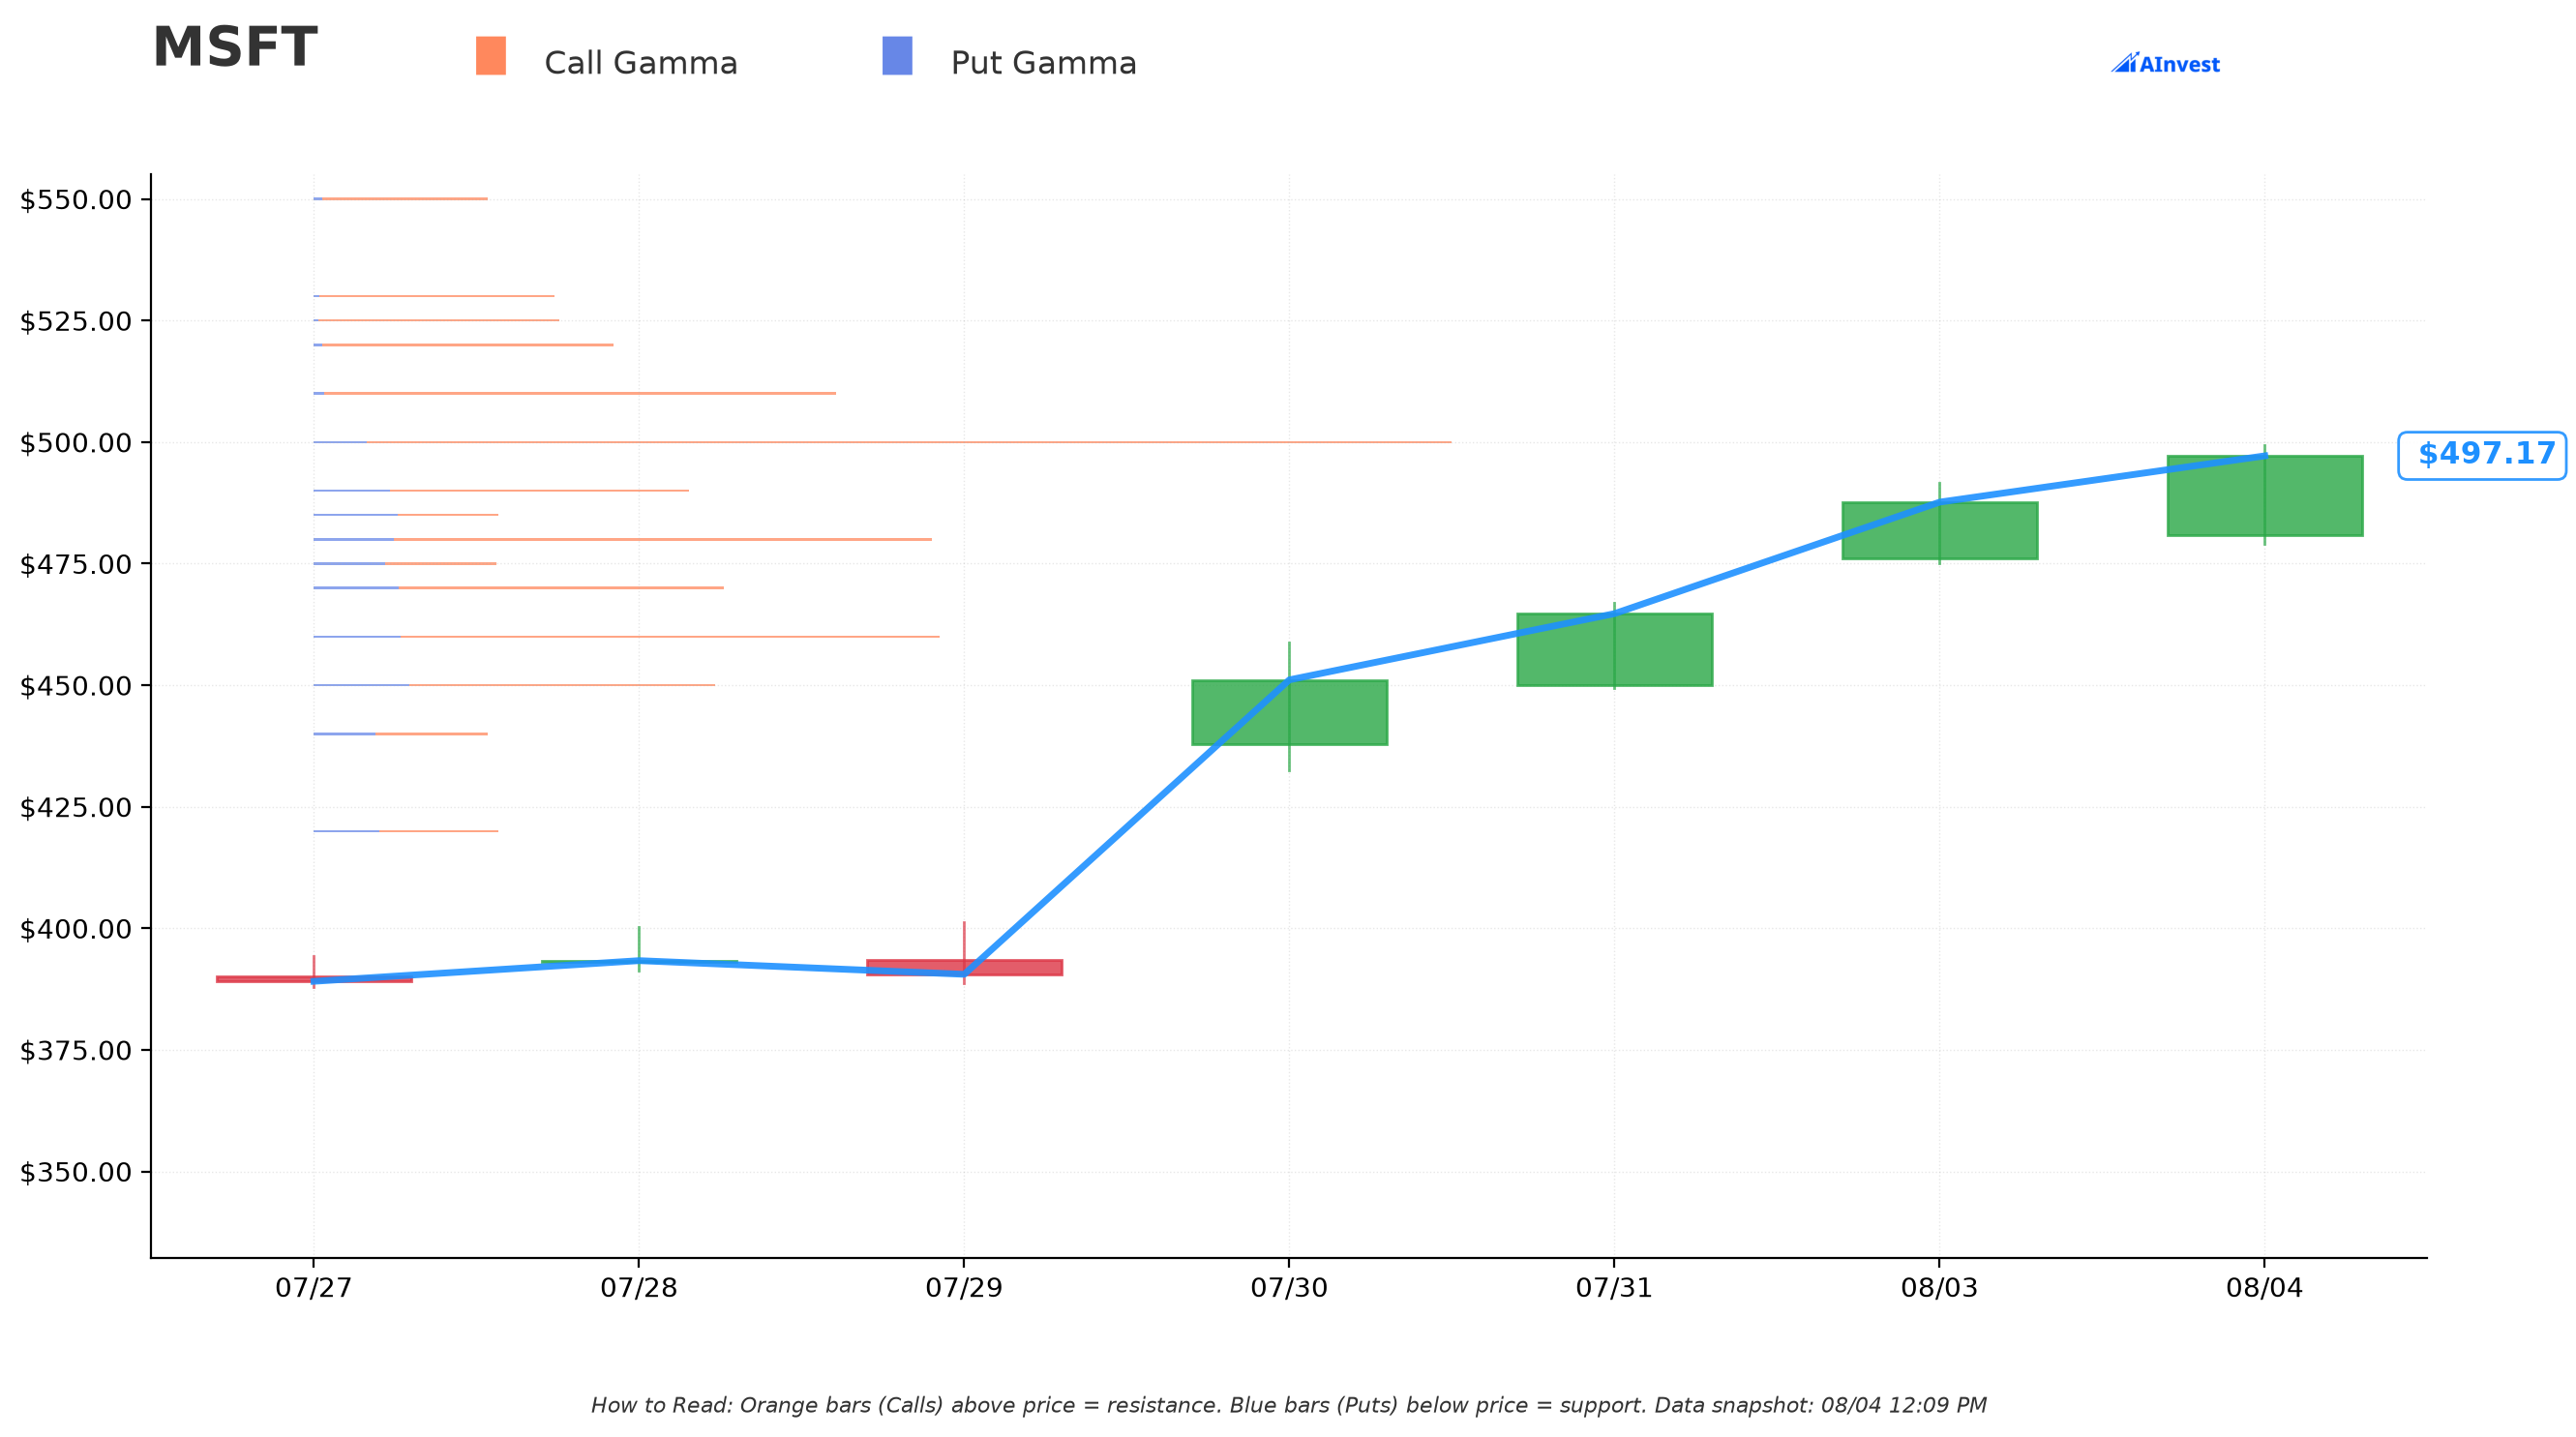
Spot is pinned right under the biggest wall on the board. Reading from gex.json (current price $497.05):
Resistance overhead:
- $500 — the single largest gamma concentration in the chain (total GEX ≈70.4), sitting just 0.6% above spot. This is the immediate ceiling.
- $510 — the exact strike this trade bought, ≈2.6% above spot, with strong call-dominant gamma (≈32.1 total, ≈31.5 from calls).
- $520 — the next resistance shelf, ≈4.6% above spot.
Support underneath:
- $480 — ≈3.4% below spot, "Very Strong" — the first real floor if the rally stalls.
- $470 — ≈5.4% below spot.
- $460 — ≈7.5% below spot, also "Very Strong."
In plain English: the buyer picked a strike ($510) that sits right on top of an existing resistance wall, one notch above the single biggest wall in the chain ($500). Dealers are heavily positioned around both levels, which tends to make price action choppier near $500 and $510 — not necessarily a smooth glide path. Getting through $500 first, then $510, then $520 in sequence is the more likely path than a straight shot.
Implied Move
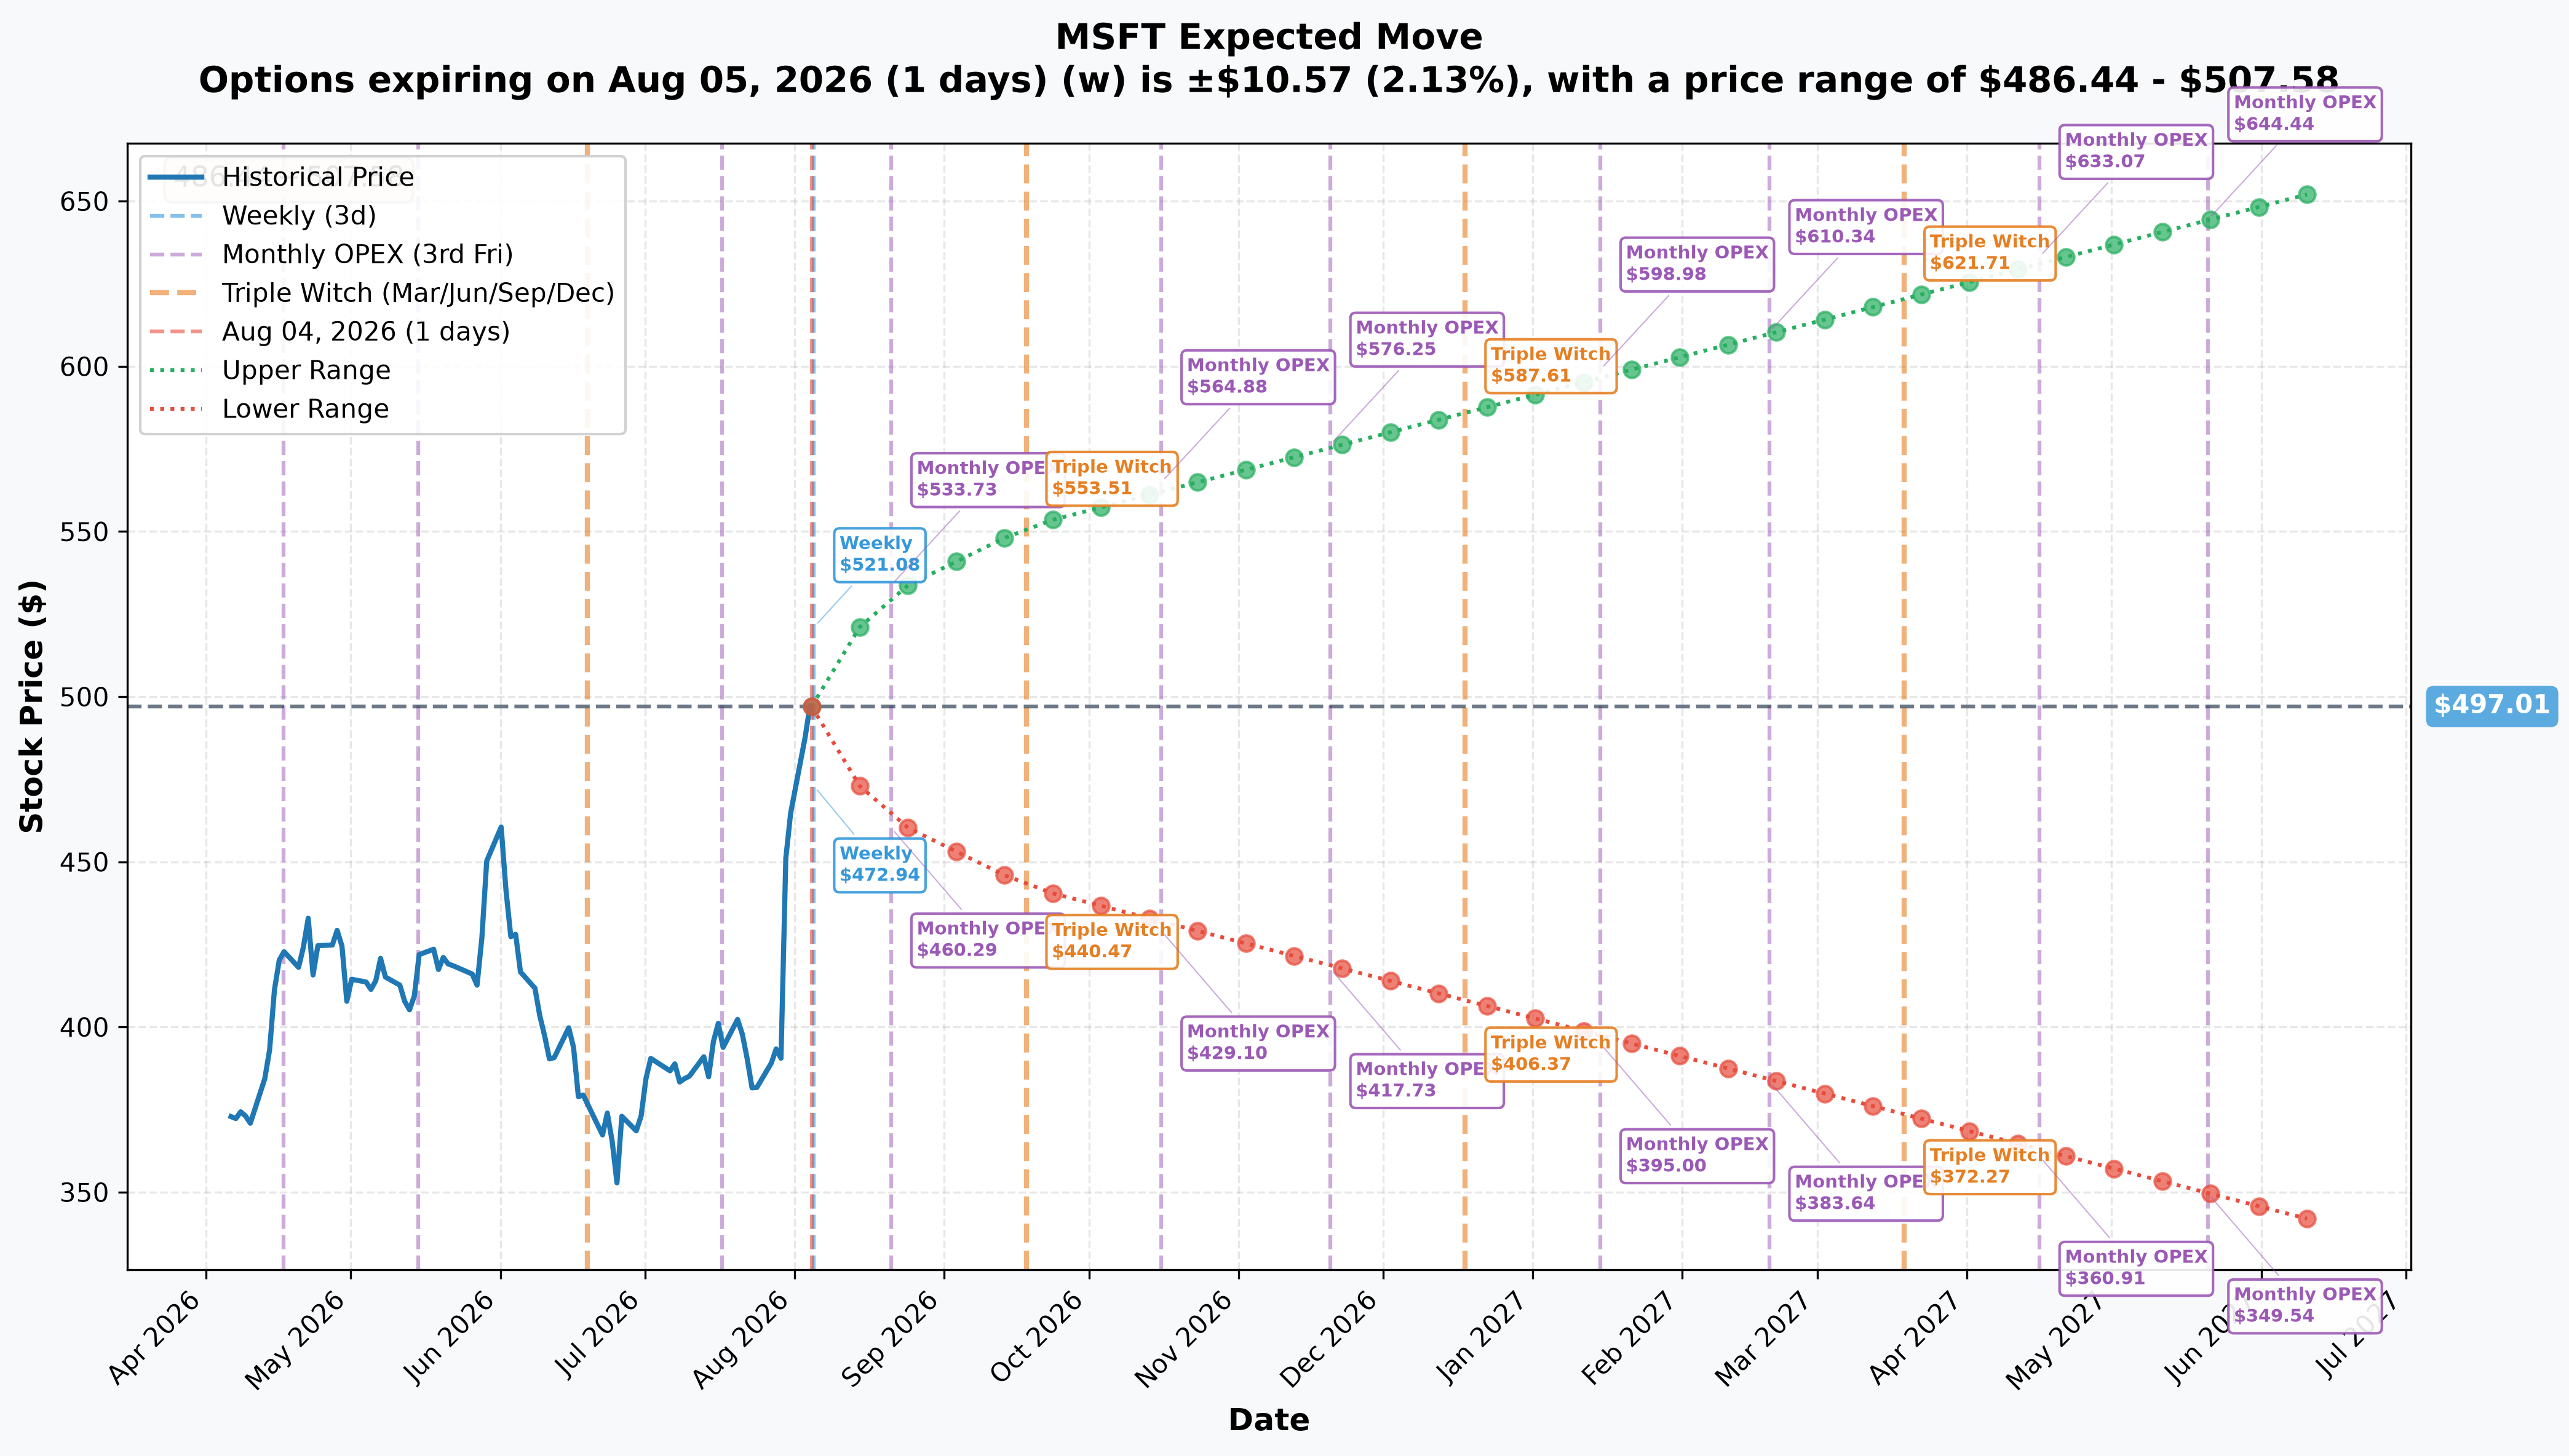
From MSFT_implied_move.json, current price $497.01:
| Horizon | Expiry | DTE | Implied Move | Range |
|---|---|---|---|---|
| Weekly | 2026-08-05 | 1 | ±2.13% | $486.44 – $507.58 |
| Monthly OPEX | 2026-08-21 | 17 | ±6.96% | $462.44 – $531.58 |
| Triple Witch (matches this trade's expiry) | 2026-09-18 | 45 | ±10.99% | $442.36 – $551.62 |
| Yearly LEAPS | 2027-06-17 | 317 | ±31.73% | $339.31 – $654.67 |
The option this buyer bought expires September 18 — the "Triple Witch" row. Options pricing implies MSFT could move anywhere between $442.36 and $551.62 by that date. The $510 strike and the $523.70 breakeven both sit comfortably inside that band, meaning the market isn't pricing this as a wild long shot — it's a real, plausible outcome, not just a tail bet. That cuts both ways: a move to $442 is priced as just as plausible as a move to $551 from where the market sits today.
🎪 Catalysts
Already Happened (last 3 months)
- FY26 Q4 earnings, reported July 29, 2026, after the close. Revenue $90.0B (+18%), non-GAAP EPS $4.74 vs $4.24 consensus, per Microsoft's own FY26 Q4 press release. Azure grew 43% and crossed $100B in annual revenue for the first time. Commercial RPO hit $678B (+84%).
- The stock's reaction was one of the largest single-day moves in its history: stockanalysis.com's price history shows MSFT closed +15.51% on July 30 on 109.4M shares — roughly 2.6× the prior day's volume — then kept climbing: +3.02% July 31, +4.93% August 3, +1.98% intraday August 4. From the pre-earnings close of $390.54 to today's level, that's a cumulative +27.3% in four sessions.
- Capex is the number the market is trading on. Q4 capex was $41B, full-year FY26 additions to property and equipment hit $115.9B, and CFO Amy Hood pointed to ≈$175B for calendar-2026 investment, per the FY26 Q4 earnings call.
- Microsoft 365 Copilot passed 30 million paid seats, with net seat adds more than doubling quarter-over-quarter, and GitHub Copilot consumption revenue accelerated over 60% quarter-over-quarter, per the same earnings call.
- August 3, 2026 — Phillip Securities downgraded MSFT from Strong Buy to Moderate Buy, per MarketBeat's price-target history. It's worth noting this was a valuation call after a 27% run, not a change of thesis — the firm didn't move to Hold or Sell.
- Several firms raised targets the same week: Wells Fargo to $650, Sanford C. Bernstein to $647, Citigroup to $600, Goldman Sachs reiterated $640 and added MSFT to its Conviction List, per MarketBeat.
Coming Up (next 6 months)
- August 20, 2026 — ex-dividend date, $0.910/share, payable September 10, per stockanalysis.com's dividend page. This date falls inside the life of the September 18 call being bought here.
- FY27 Q1 earnings — estimated around October 27, 2026, but not yet company-confirmed. MarketBeat states plainly that no specific date is confirmed. Whatever the exact date, it falls after the September 18 expiry these calls are tied to — so this specific position does not carry earnings risk or earnings upside. It's a bet on trend continuation into a relatively quiet stretch, not an earnings play.
- Analyst consensus sits at Strong Buy / Moderate Buy depending on the panel, with average targets of $558–$563 against today's ≈$497 spot, and a wide range of $400–$870, per MarketBeat's price-target page.
🎲 Price Targets & Probabilities
Using the gamma walls and implied-move ranges together:
- Bull case ($520–$531): clears both the $500 and $510 gamma walls; sits inside the monthly-OPEX implied-move upper bound of $531.58. This is the zone where the call buyer starts seeing real profit beyond the $523.70 breakeven.
- Base case (≈$497–$505): price continues to gravitate near the heaviest gamma concentration at $500, which is both today's biggest wall and immediately overhead.
- Bear case ($480 and below): the first real support shelf under the current run-up; a retest here would put the $510 calls meaningfully out of the money with time still on the clock, since expiration is 45 days out.
💡 Trading Ideas
🛡️ Conservative
Watch from the sidelines, or use a much closer-to-the-money, shorter-dated call (weekly, ≈$500 strike) to test the $500 gamma wall with less capital at risk and a defined ≈2% implied move already priced by the market. Size small — this stock is 24% above its 50-day average.
⚖️ Balanced
A September $500/$530 call spread costs less than the outright $510 call studied here, caps the upside at $530 (inside the implied-move range), and reduces the cost of being wrong about timing. It trades some of the unlimited upside for a lower breakeven.
🚀 Aggressive
Mirror the trade: a September $510 call outright, understanding the buyer needs roughly a 6% move just to break even and is not protected against the stock giving back part of its 27% four-day run first.
⚠️ Risk Factors
- This stock is up 27.3% in four trading sessions and is ≈24% above its 50-day moving average, with RSI reported at 81 — technically overbought by a wide margin, per Investing.com. Mean reversion after a move this size and this fast is a real possibility independent of the underlying fundamentals.
- The strike is ≈3.6% out of the money and the trade needs +6.4% just to reach breakeven, with 45 days on the clock. Time decay works against this position every day it doesn't move.
- No earnings event sits inside this option's life. FY27 Q1 is estimated for late October and unconfirmed, and even the estimate lands after the September 18 expiry — so this is a bet on continued trend and flow, not a scheduled catalyst.
- The only hard-dated event inside the window is the August 20 ex-dividend, a modest $0.910/share event that is not typically a stock-moving catalyst on its own.
- Options trading involves substantial risk of loss and is not suitable for all investors. A single lit print — even one this large — is not proof the buyer is right, and options traders can lose their entire premium if the stock does not move as expected before expiration. This is one data point, not investment advice.
🎯 The Bottom Line
Here's the deal: this was the one trade today where the tape shows genuine urgency — a buyer crossed the full spread to get 8,020 September $510 calls filled, and implied volatility rose right along with the print, which is the market's own confirmation of real buying pressure. Prior open interest of 6,637 pointed to a new position, and the next-day OI check has since confirmed it: open interest rose to 15,760 (+9,123), more than the print itself, so this opened cleanly with other buyers joining at the same strike. See the ✅ RESOLVED box above.
But urgency in the fill doesn't erase the setup: this call was bought after a 27% four-day run, sitting 24% above the 50-day average, needing a further 6.4% move to break even, with no earnings print inside its 45-day life. Own it if you believe Azure's growth and the Copilot monetization story keep pushing this stock through $500 and $510 into fall. Watch it if you want to see whether the rally holds above $480 first. Be skeptical if you think a stock up 27% in four sessions is due to cool off before it goes further. The open-interest confirmation on this contract is now in — opened, +9,123 contracts — so the only open question left is the setup, not the trade.
Last updated: 2026-08-05 — next-day OPRA open-interest resolution added: confirmed OPEN (BTO) — OI rose 9,123 on an 8,020-contract print.