🔄 MSFT $53.7M October Call Roll: 510 to 550 — Except the One Clip That Bought Both
📅 August 10, 2026 | 🤝 Floor Block, Paired Stock Leg
🎯 The Quick Take
Over 24 minutes this afternoon, a desk worked four separate clips in Microsoft October 16, 2026 calls, all printed as a negotiated floor block with a paired stock leg — no urgency, no lit sweep, a known counterparty on the other side. Three of the four clips sell the $510 call (right at today's ≈$507.68 spot) and buy the $550 call (≈8% higher) — a textbook roll up. The fourth clip, at 12:48:06, breaks the pattern: it buys both strikes, not one against the other. Net structural dollars across the four packages: ≈$53.72M ($18.07M + $10.73M + $6.83M in credits from the three rolls, plus an $18.10M debit on the odd one out); gross premium sums to ≈$110.18M, but that double-counts the spreads and is not the headline number.
📊 Company Overview
Microsoft Corporation is a Technology-sector, Software Infrastructure company headquartered in Redmond, Washington, with a market capitalization of ≈$3.77–3.78 trillion and a share price of $508.09 (+1.62% on the day), per its live quote. It reports through three segments, per its FY2026 Q4 earnings release:
| Segment | What it contains | Q4 FY2026 revenue | YoY |
|---|---|---|---|
| Intelligent Cloud | Azure, servers, enterprise + AI services | $39.3B | +32% |
| Productivity and Business Processes | Microsoft 365, LinkedIn, Dynamics 365 | $37.8B | +14% |
| More Personal Computing | Windows, Xbox, Bing, devices | $12.9B | −4% |
Intelligent Cloud is now the largest segment and growing roughly 8x faster than the company average, while More Personal Computing is shrinking. Anything that moves MSFT materially runs through Azure and AI infrastructure, not Windows or Xbox.
💰 The Trades, In Plain English
All eight legs share the same expiration — Friday, October 16, 2026 — and the same two strikes, $510 and $550. They printed across four timestamps between 12:45 PM and 1:07 PM ET. The tape says every leg is a floor block with a paired stock leg: manually negotiated on an exchange floor, a known counterparty took the other side, and shares came along with the package — this was not a lit sweep, and no urgency language belongs anywhere in this story.
12:45:32 ET (spot $508.05) — Roll clip #1. SELL 7,500 $510 calls, BUY 7,500 $550 calls. Net $10.73M credit.
12:48:06 ET (spot $507.56) — the odd one out. BUY 5,000 $510 calls and BUY 5,000 $550 calls — not a roll, a straight double-long across both strikes. Net $18.10M debit.
12:49:54 ET (spot $507.07) — Roll clip #2. SELL 5,000 $510 calls, BUY 5,000 $550 calls. Net $6.83M credit.
13:07:31 ET (spot $507.68) — Roll clip #3, the largest. SELL 13,000 $510 calls, BUY 13,000 $550 calls. Net $18.07M credit.
Spot ticked around in a tight ≈$1 band across the session (508.05 → 507.56 → 507.07 → 507.68) — this was worked patiently over roughly 22 minutes, not fired off in one print.
Full trade details
| Time (ET) | Buy/Sell | Call/Put | Expiration | Premium | Strike | Volume | OI | Size | Spot | Option Price | Option Symbol | Order Type | Strategy |
|---|---|---|---|---|---|---|---|---|---|---|---|---|---|
| 12:45:32 | SELL | CALL | 2026-10-16 | $19.01M | $510 | 16,000 | 53,000 | 7,500 | $508.05 | $25.35 | MSFT20261016C510 | ✅ STC (resolved) | Call Roll Up 510 to 550 |
| 12:45:32 | BUY | CALL | 2026-10-16 | $8.29M | $550 | 16,000 | 4,000 | 7,500 | $508.05 | $11.05 | MSFT20261016C550 | BTO | Call Roll Up 510 to 550 |
| 12:48:06 | BUY | CALL | 2026-10-16 | $12.58M | $510 | 22,000 | 53,000 | 5,000 | $507.56 | $25.15 | MSFT20261016C510 | BTO (not separable at leg level) | Long Calls 510 + 550 |
| 12:48:06 | BUY | CALL | 2026-10-16 | $5.53M | $550 | 22,000 | 4,000 | 5,000 | $507.56 | $11.05 | MSFT20261016C550 | BTO | Long Calls 510 + 550 |
| 12:49:54 | SELL | CALL | 2026-10-16 | $12.30M | $510 | 27,000 | 53,000 | 5,000 | $507.07 | $24.60 | MSFT20261016C510 | ✅ STC (resolved) | Call Roll Up 510 to 550 |
| 12:49:54 | BUY | CALL | 2026-10-16 | $5.48M | $550 | 27,000 | 4,000 | 5,000 | $507.07 | $10.95 | MSFT20261016C550 | BTO | Call Roll Up 510 to 550 |
| 13:07:31 | SELL | CALL | 2026-10-16 | $32.54M | $510 | 41,000 | 53,000 | 13,000 | $507.68 | $25.03 | MSFT20261016C510 | ✅ STC (resolved) | Call Roll Up 510 to 550 |
| 13:07:31 | BUY | CALL | 2026-10-16 | $14.47M | $550 | 41,000 | 4,000 | 13,000 | $507.68 | $11.13 | MSFT20261016C550 | BTO | Call Roll Up 510 to 550 |
🤝 Mechanism: floor block, paired stock leg. All eight legs printed as a manually negotiated floor trade with a known counterparty — the equity tape shows shares moved alongside the options, meaning the package is delta-hedged. Nothing here is a lit sweep; treat it as a desk positioning a structure, not chasing price.
✅ RESOLVED — The Roll Up Is Confirmed on Both Strikes, and the $510 Close Was Essentially Complete
Updated 2026-08-11 pre-market. Resolving OPRA snapshot timestamped August 11 (reflects the August 10 close); baseline is the August 10 snapshot (reflects August 7 — before these prints).
| Leg | Baseline (Aug-10) | Resolving (Aug-11) | Δ | Print size | Δ as % | Day vol | Our published prediction | Verdict |
|---|---|---|---|---|---|---|---|---|
| Oct-16 $550 call (bought, 30,500 total) | 3,998 | 55,221 | +51,223 | 30,500 | +167.9% | 56,878 | ≈30,500–34,498 | ✅ OPEN (BTO) — far past prediction |
| Oct-16 $510 call (25,500 sold, 5,000 bought = −20,500 net) | 52,786 | 26,490 | −26,296 | 20,500 net | −128.3% of net | 63,546 | ≈32,286 if STC | ✅ CLOSE (STC) — confirmed |
The $510 calls resolved on the closing branch, and by more than we predicted. We said a genuine close of the sell clips against a genuine open on the buy clip should take open interest down ≈20,500 contracts to ≈32,286, and that any of the "SELL" clips opening fresh shorts would show up as a rise or a smaller-than-expected fall. Instead open interest fell 26,296 — to 26,490, well below the predicted level. The STC label on all three sell clips is confirmed, and the desk retired more $510 exposure than its own package accounts for, meaning other holders were exiting the same strike alongside it.
The lone $510 BUY clip cannot be isolated, and we are not going to pretend otherwise. The 5,000-lot purchase we labeled BTO ⏳ is netted inside the same strike's total. All the snapshot proves is that the strike's open interest fell sharply on the day; whether that specific clip opened a new long or covered a short is not separable from a single strike-level number. The ⏳ on that one clip is retired as unresolvable at the leg level, not as confirmed.
The $550 calls blew past the predicted range. We expected ≈30,500–34,498; open interest printed 55,221, a rise of 51,223 against a 30,500-lot print — 168% of the package's own size. Other participants were buying the same strike heavily on the same session. The new long position is proven beyond doubt, and the $510-to-$550 roll up is confirmed on both ends.
🤓 What This Actually Means — Plain English
Start with the OI history, because it's the whole story. The $510 strike went from 253 contracts to 52,671 on August 4 — this same desk (or one working the same book) built that entire position about a week ago. The $550 strike grew too, but far more modestly: 42 to 3,998 over the same stretch. Today, that desk is selling the $510 line it just built and moving the exposure up to $550. That is the definition of a roll up: close a call that's now sitting right at the money (spot ≈$507.68 vs. a $510 strike — almost no room left to run before it becomes pure intrinsic value) and re-buy calls with more room above spot, out at $550.
Why "sell an at-the-money call you bought a week ago, buy a higher strike" reads as continuation, not reversal. If this were a reversal of view, the desk would sell the $510 calls and walk away, or buy puts. Instead, every dollar collected from selling $510 (minus the smaller cost of the new $550s) stays invested in the same underlying bet — just re-struck further from spot. That is a position manager taking profit on a call that has run most of its course and re-loading further out, not someone who's turned bearish. Three of the four clips (25,500 of 30,500 $510 contracts) fit this pattern cleanly.
The 12:48:06 clip is genuinely different — flag it, don't average it into the roll. That clip buys 5,000 of the $510 and 5,000 of the $550, both as new longs, with no offsetting sale. It's a straight double-long across two strikes, not a spread. Read narrowly, it adds exposure rather than migrating it — worth watching separately from the three roll clips, especially once tomorrow's OI resolves whether the $510 leg of this specific clip is a fresh open or a closing trade being misread by size.
The paired stock leg changes how directional this really is. Because shares came with the package, this structure is at least partially delta-hedged — the option legs alone do not express a clean, un-hedged bullish view the way a naked call buy would. We cannot see the size or side of that stock leg from the option tape (see Honest Limits below), so treat the "bullish roll" read as a directional lean embedded in a larger, partially hedged package — not a pure conviction bet.
Most plausible motive: a position manager who built a large at-the-money call position a week ago (right as MSFT was running toward its 52-week high) is harvesting the gain in that leg and re-expressing the same thesis further out-of-the-money, likely to reduce the mark-to-market cost of carrying the position and to keep upside exposure alive without paying up for deep-ITM time value. That's a portfolio-management move, not a fresh conviction trade — though the odd 12:48:06 clip suggests someone in the same book added incremental exposure on the side.
📈 Technical Setup
YTD Performance
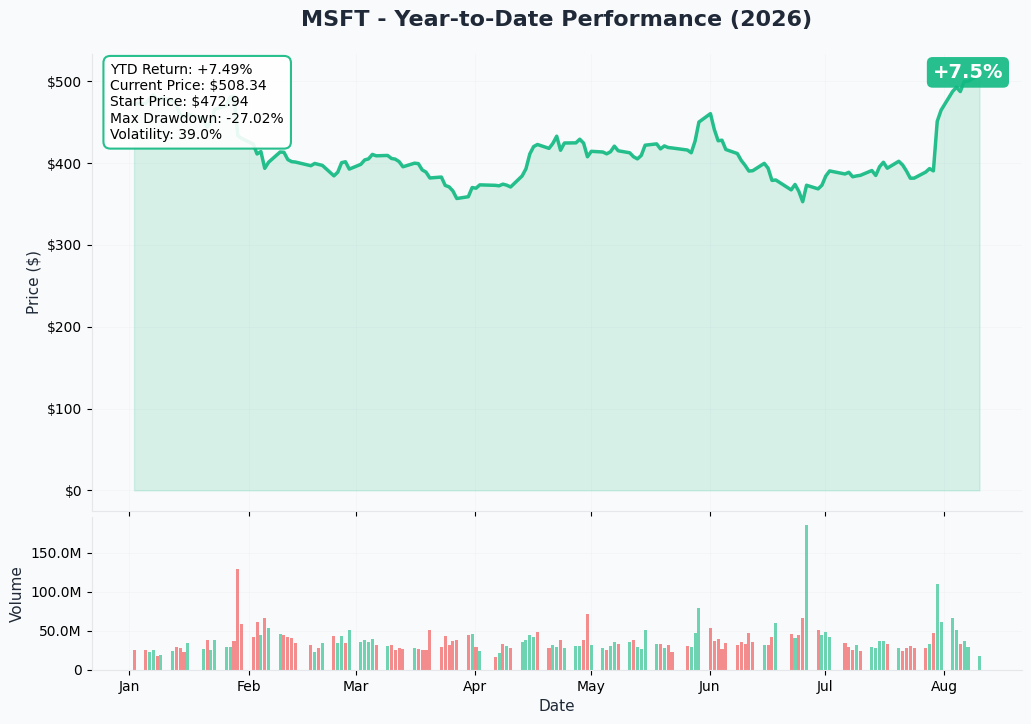
MSFT is up +22.43% over three months, +26.70% over six months, and +5.09% year-to-date, but still −2.64% over one year and sitting ≈8.2% below its 52-week high of $553.72, per market performance data. That combination — a strong recent run, a stock that hasn't reclaimed its high, and a still-negative one-year return — is the backdrop this roll is being placed into.
Gamma Support & Resistance
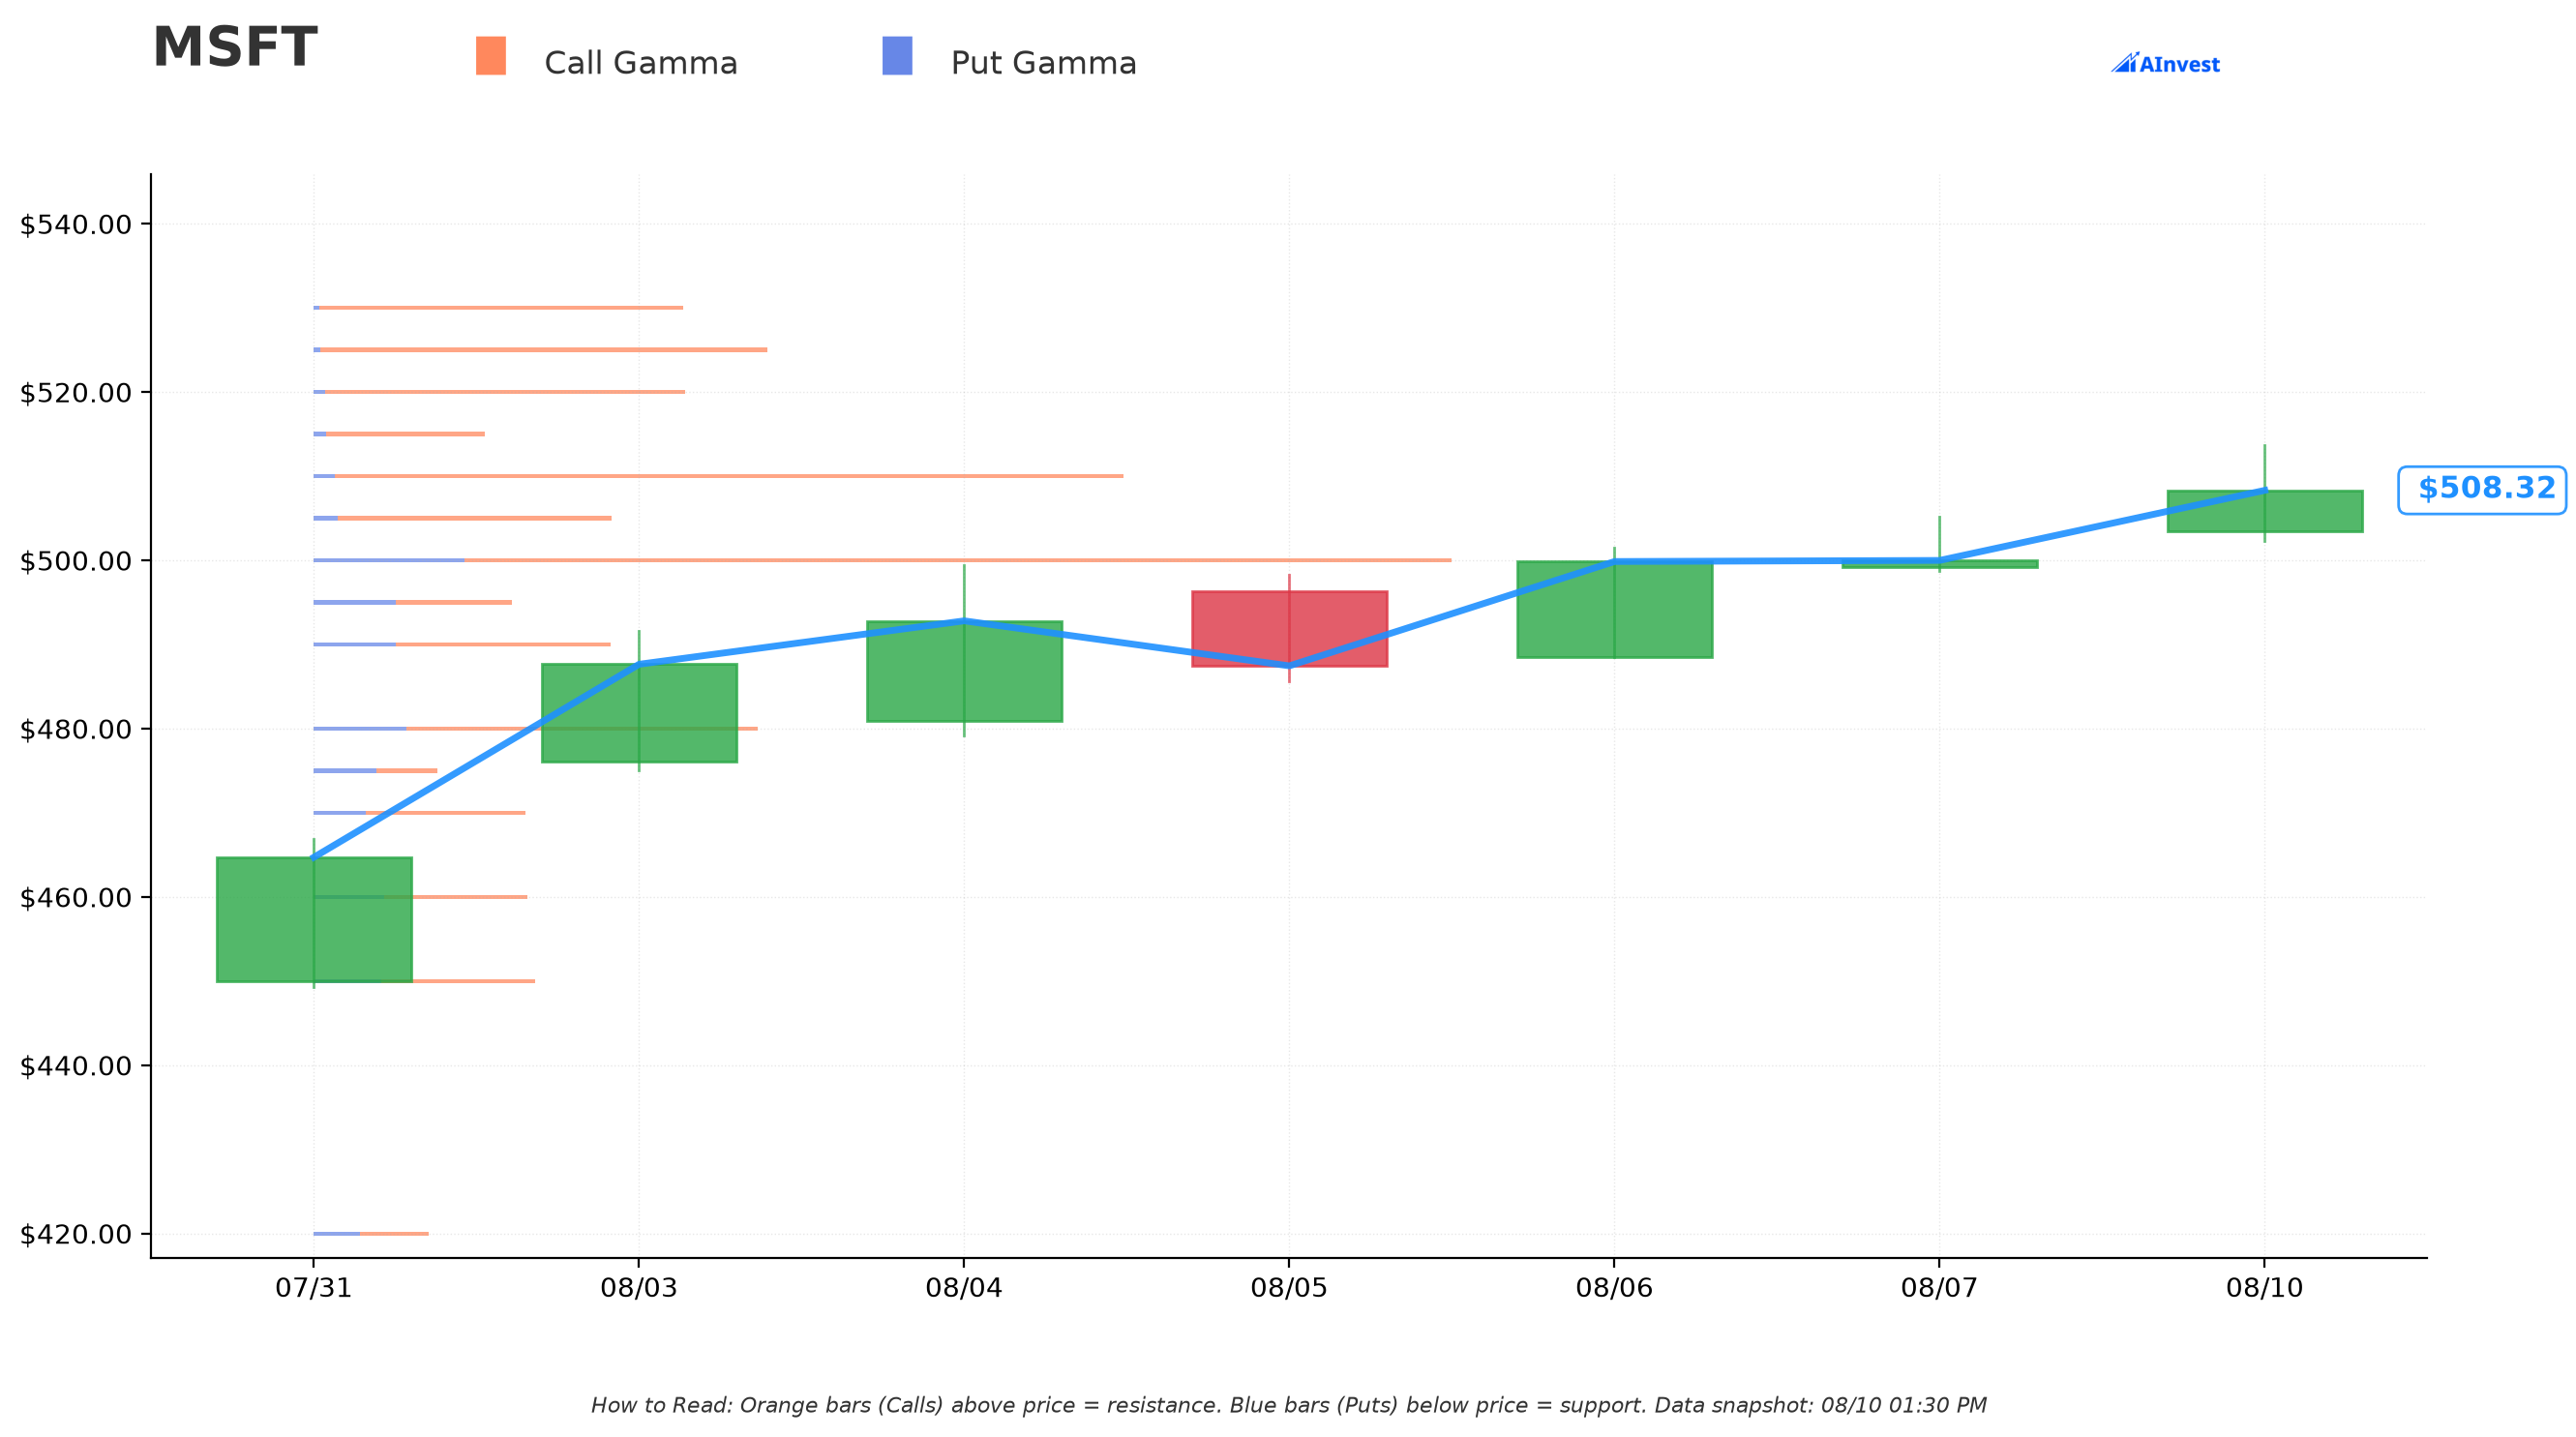
At spot ≈$508.26, the gamma map shows the $510 strike as a Very Strong resistance wall — total gamma exposure of ≈59.24, almost entirely call gamma (≈57.72), and only ≈0.34% away from spot. That is exactly the strike this desk is selling out of. Just below, $505 (≈23.14 total gex, 0.64% away) and $500 (≈85.26 total gex — the single largest wall on the board, 1.63% away) form layered support.
Above spot, between here and the new $550 strike, sit two more meaningful call-gamma shelves: $520 (≈27.25 total gex, 2.31% away) and $525 (≈33.32 total gex, 3.29% away) — both stronger than $550 itself. The $550 strike shows ≈15.96 total gamma (≈8.21% away from spot) — a real but noticeably thinner wall than the one the desk is exiting. In plain terms: the desk is rolling off the single strongest nearby resistance level and re-positioning at a strike with roughly a quarter of that wall's gamma weight, with two intermediate shelves ($520, $525) still standing between spot and $550.
Implied Move
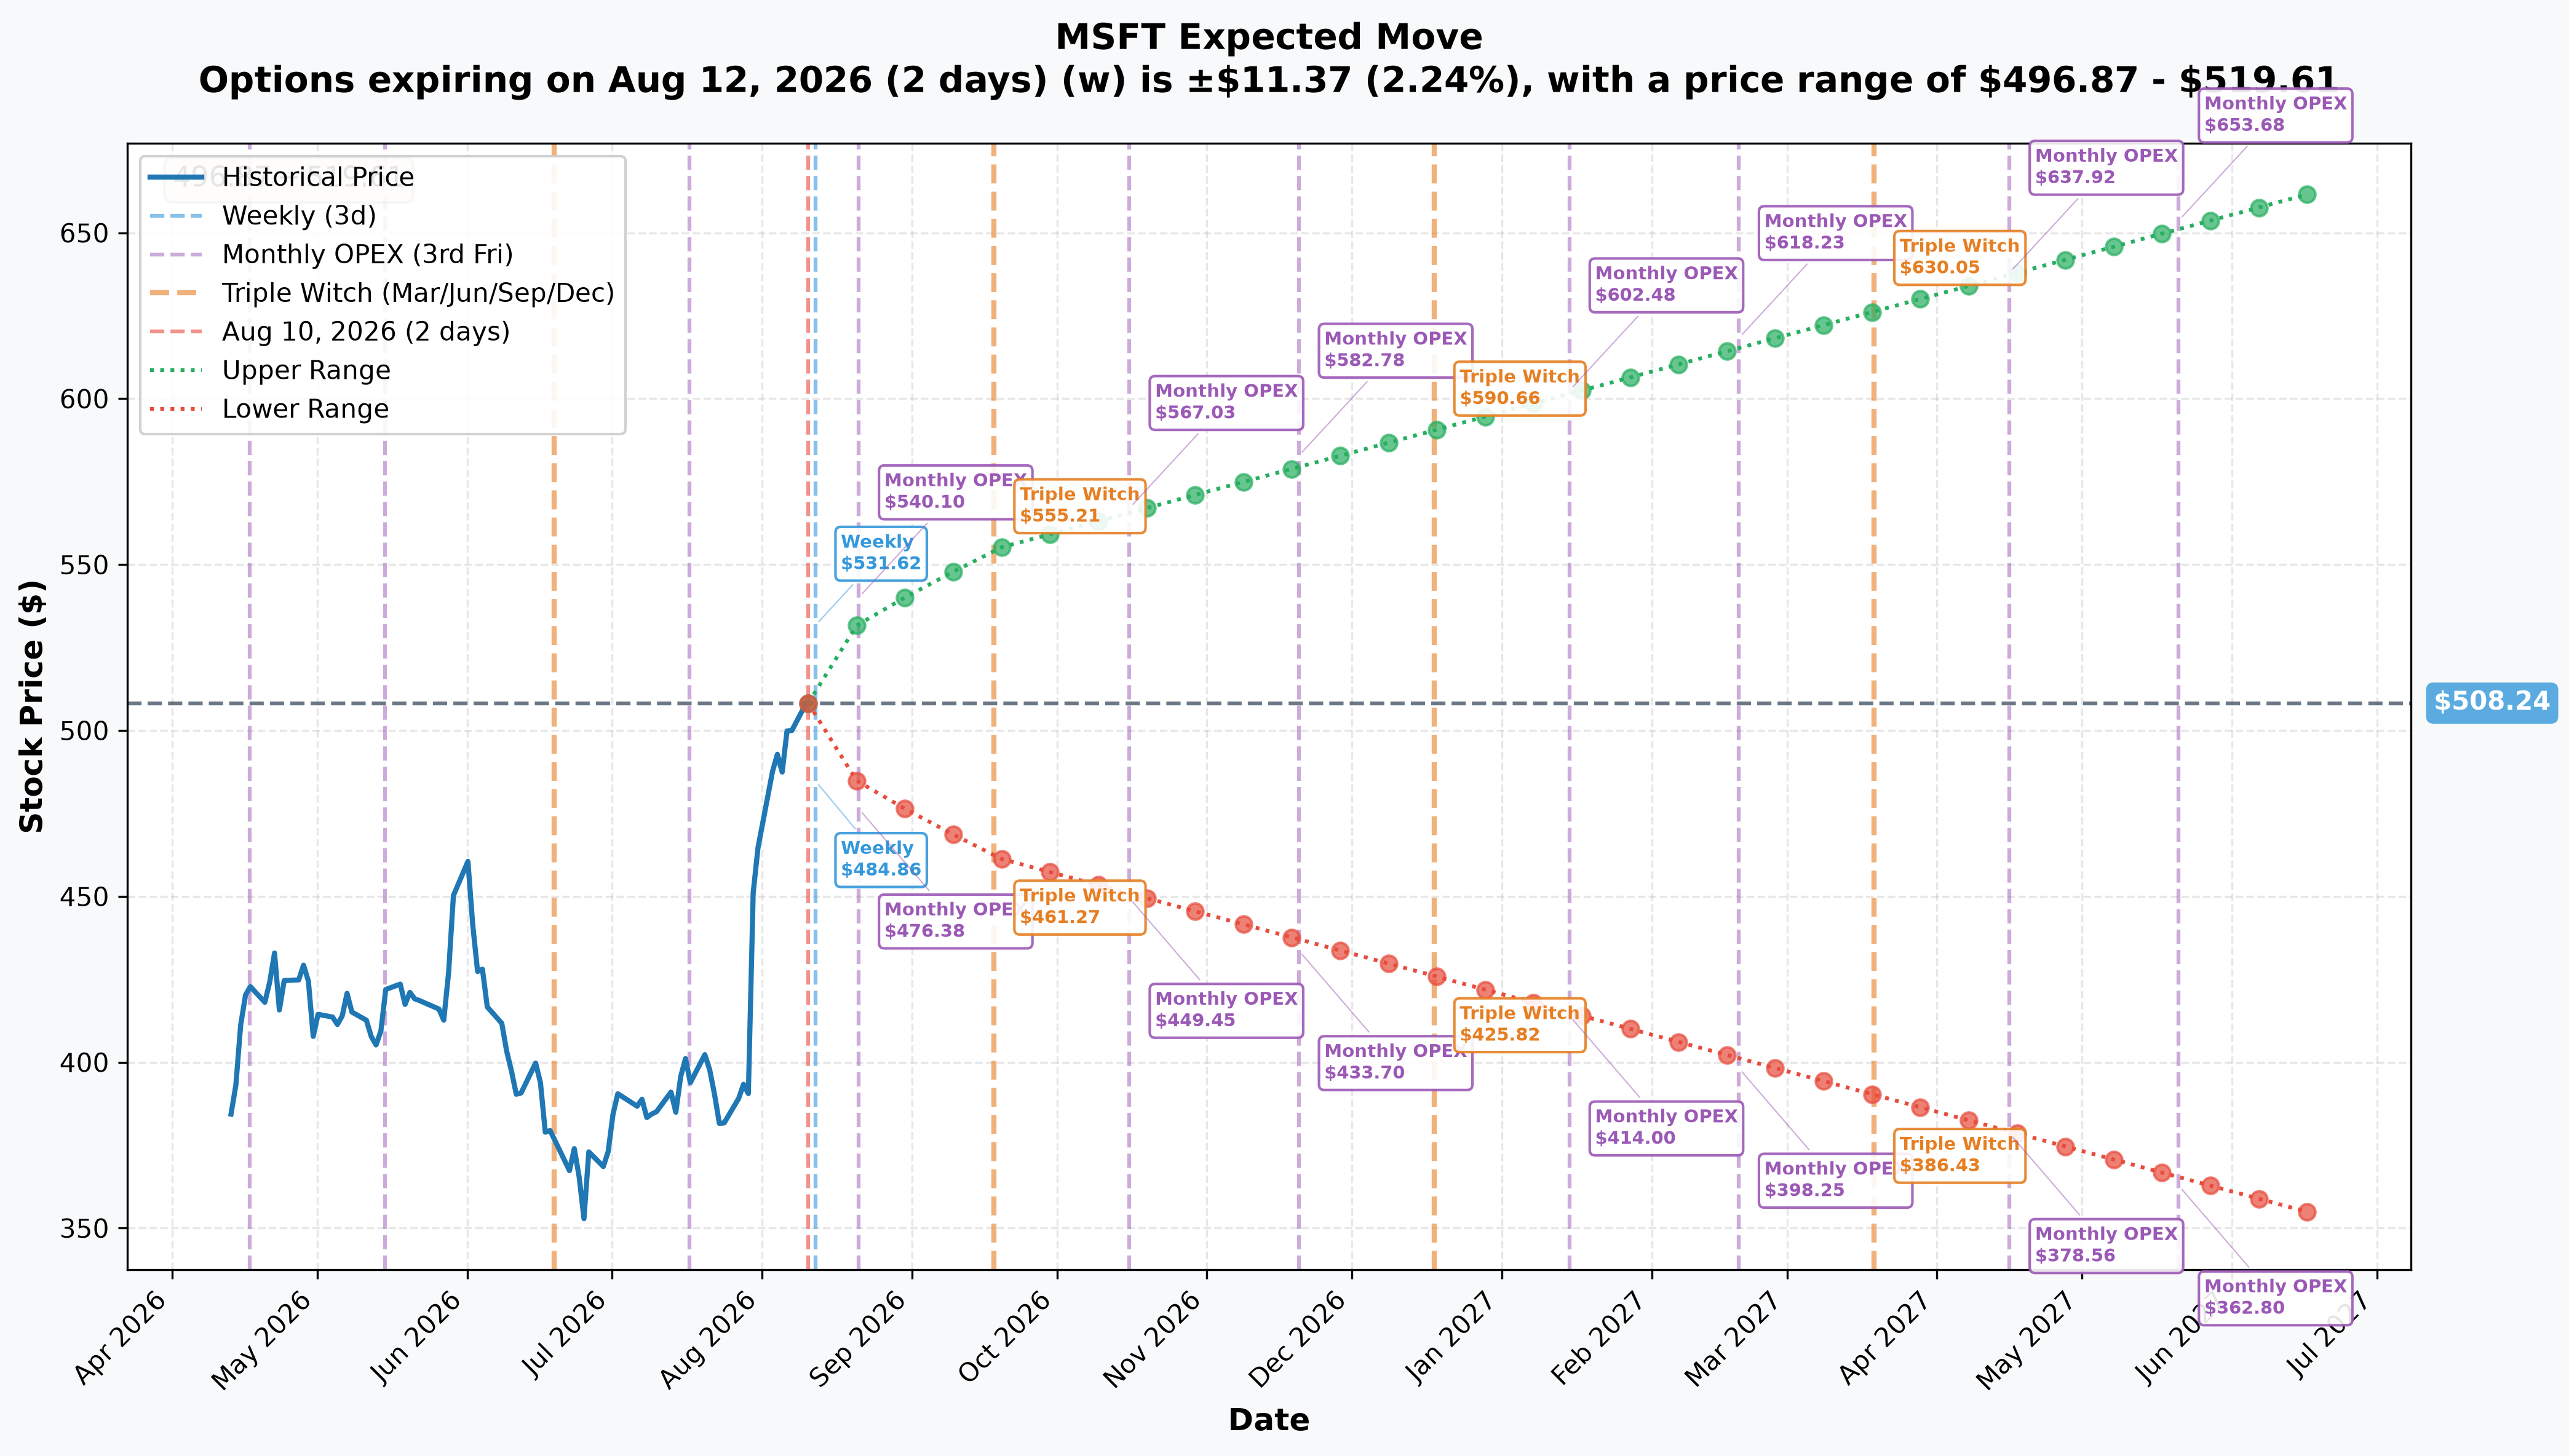
The options market's own pricing puts the October 16, 2026 expiration — the exact date this roll uses — at an implied range of roughly $449.45 to $567.03 (per the OPEX-label data embedded in the implied-move chart). Both strikes in this trade sit comfortably inside that range: $510 is barely above spot, well within the likely zone, and $550 sits below the upper edge of the range rather than out at a tail. For nearer-dated reference, the August 21 monthly OPEX implies ±4.89% (±$24.88), range $483.36–$533.12, and the September 18 triple witch implies ±9.16% (±$46.58), range $461.66–$554.82 — both consistent with the market pricing a moderate, not extreme, move between now and this structure's expiration.
🎪 Catalysts
The decisive fact: Microsoft's next earnings report is expected ≈October 28, 2026 — roughly 12 days AFTER this October 16 expiration — and that date is an estimate, not company-confirmed. The source states plainly that "Microsoft has not confirmed its next earnings publication date, but the company's estimated earnings date is Wednesday, October 28th, 2026 based off last year's report dates." This position does not own the earnings print.
Inside the October 16 window (what this trade IS exposed to)
- Ex-dividend, $0.91/share — August 20, 2026. Confirmed, per dividend history. Mechanical, ≈0.18% of spot — negligible directionally.
- Maia 300 AI accelerator public unveil — "as soon as September" 2026. Not a Microsoft announcement — a press report relayed here. This is the one real share-price catalyst inside the window; it speaks directly to Microsoft's own AI cost curve.
- Dividend paid, September 10, 2026. Confirmed, per dividend history — cash-flow event only.
- Possible dividend increase / buyback declaration, ≈mid-September 2026. Pattern-based inference, not confirmed.
- Continued analyst-target churn: Bernstein raised to $660 on August 10 citing "improved datacenter capacity prospects," per news coverage, while Barclays cut to $512 on July 30 — same Overweight rating, opposite direction.
Outside the window (does NOT settle this position)
- FY2027 Q1 earnings, ≈October 28, 2026 — estimated, unconfirmed — tests Azure's guided ≈45% constant-currency growth and the guided >$50B single-quarter capex.
- Microsoft Ignite 2026, San Francisco, November 17–20, 2026 — confirmed, per Microsoft events.
Do not confuse the Oct 28 earnings estimate with the Oct 16 option expiration — they are 12 days apart, and this structure settles before the print that would actually resolve Microsoft's capex/margin debate.
🎭 Four-Reader Interpretation
🚀 YOLO Trader
This is a floor-negotiated, hedged institutional roll, not a signal to chase. If you want in on the same idea, buying MSFT calls near $520–$525 (the intermediate gamma shelves between spot and $550) with a small position size is closer to matching the risk than trying to mirror a package you can't see the hedge leg of. Size tiny. The next-day snapshot has since confirmed the $510 strike's open interest fell sharply (52,786 → 26,490), so the roll direction is settled — but you still cannot see the hedge leg, and the desk's own net $510 exposure is not separable from a strike-level number.
📊 Swing Trader
Wait for tomorrow's ≈06:30 ET OI print before drawing a conclusion. If $510 OI falls toward ≈32,000 as predicted, that confirms the roll thesis and the desk has genuinely reduced at-the-money exposure in favor of $550. Use the $500/$505 support shelf and the $510/$520/$525 resistance shelf as your swing levels into the Sept 18 triple witch (implied range $461.66–$554.82), and treat the Maia 300 reveal (unconfirmed timing) as the swing catalyst — not earnings, which lands after this structure expires.
💰 Premium Collector
This flow is a call roll, not a premium-selling signal, and the desk got floor-negotiated pricing you won't be quoted retail. If you're inclined to sell calls against a long MSFT position, the $570–$575 zone (well above both the $550 wall and where this desk is positioned) preserves more room before you're fighting institutional flow at your strike. Confirm the OI outcome first — selling calls into a name where a large at-the-money position just got exited carries different risk than selling into flat positioning.
🌱 Beginner
A "roll up" means selling one call and buying another at a higher strike, same expiration, to keep a similar bet alive further from the current price — think of it like moving your bet's target further away after cashing in some of the original gain. It is not automatically bullish confirmation: three of these four clips did exactly that, but the fourth simply bought more calls outright, and none of the $510 legs can be proven as a genuine "close" versus a "new short" from today's tape alone. Check back tomorrow morning for the open-interest update before treating this as a clean signal either way.
⚠️ Honest Limits — What the Tape Cannot Prove
- The size and direction of the paired stock leg are invisible in the option tape. We know shares came with this package (that's how the mechanism reads on the floor), but not how many shares, on which side, or how they map to each clip. That materially changes how directional this structure really is, and we cannot resolve it from what's shown here.
- Open vs. close on all four $510 legs is unprovable today. Size ≤ prior OI (≈52,786) on every leg means the tape alone cannot distinguish STC from STO, or BTO from BTC. Only tomorrow's ≈06:30 ET OI snapshot resolves this.
- We cannot see the counterparty, broker, or customer identity behind this floor block — only that a known counterparty took the other side of a negotiated trade.
- We cannot confirm whether the 12:48:06 "buy both" clip belongs to the same book as the three roll clips, or is an independent position added into the same negotiated session.
- Maia 300's timing is a press report, not a Microsoft confirmation, and the ≈October 28 earnings date is explicitly an estimate — re-verify both before assuming either lands inside or outside this structure's life.
This analysis is for informational purposes only and is not investment advice. Options trading involves substantial risk of loss and may not be suitable for all investors. The open/close, mechanism, and structural reads above are graded by confidence level and explicitly flag what remains unprovable from the tape alone — always verify current prices and open interest before trading.
Last updated: 2026-08-11 (pre-market) — the next-day OPRA open-interest snapshot resolved this session's provisional flags. Oct-16 $550C 3,998 → 55,221 (+51,223, ≈168% of the package's own size): OPEN (BTO), far past the predicted ≈30,500–34,498. Oct-16 $510C 52,786 → 26,490 (−26,296 against a predicted ≈32,286): CLOSE (STC) confirmed on the sell clips, with more exposure retired than this package alone accounts for. The lone 5,000-lot $510 BUY clip is not separable at the leg level from a strike-level number — its ⏳ is retired as unresolvable, not confirmed. The order-type cells, the trading-idea caveat and the ⏳ callout were updated.