👟 NKE $220M Bullish Bet — And Someone Got PAID $3.52M to Make It
📅 August 3, 2026 | 🔥 Unusual Activity Detected — Standout Trade of the Day
✅ UPDATE — August 4, 2026 pre-market: both legs confirmed OPEN, essentially to the contract. The $40 put rose 22,898 → 110,912 (+88,014) against 88,000 sold, and the $45 call rose 16,226 → 87,890 (+71,664) against 72,000 bought. See the ✅ RESOLVED box.
🎯 The Quick Take
A desk just put on a ≈$220M-notional bullish position on Nike — selling 88,000 September $40 puts and buying 72,000 September $45 calls in the same negotiated package — and collected a net $3.52M credit for doing it. That's a contrarian bet on a stock that's down 33.7% year-to-date, structured so the market paid them to place it. The catch: below $40, they're on the hook for 8.8 million shares (≈$352M). We can prove exactly how this trade works because a 5,285,000-share stock block printed 24 seconds later — and the math on that block is what tells us the calls were bought, not sold. Let's walk through it. 👀
📊 Company Overview
NIKE, Inc. (NYSE: NKE) is the world's largest athletic footwear and apparel company — the NIKE, Jordan, and Converse brands, built on basketball, running, and soccer, with footwear making up roughly two-thirds of sales.
- Market cap: ≈$62.5 billion
- Exchange: NYSE
- Sector / Industry: Consumer Discretionary / Footwear & Accessories
- Share price today: $42.15–$42.18, up ≈1.0% on the day
- 52-week range: $40.00 – $80.17 — the stock is only ≈5% above its 52-week low
- CEO: Elliott J. Hill (President & CEO)
- Dividend: $1.64/year, ≈3.9% yield, 24 consecutive years of increases
Nike is down 33.7% YTD and 43.6% over the trailing 52 weeks, trading below both its 50-day ($43.50) and 200-day ($54.43) moving averages. This is a beaten-down mega-cap, not a momentum name — which makes today's bullish sizing notable on its face.
💰 The Option Flow Breakdown
📊 What Just Happened — The Trade Table
Both legs printed as a single negotiated 🤝 block cross at 11:14:51 (this was a facilitated, off-book match between two known counterparties — not an aggressive sweep, so no urgency language belongs here).
| Time | Symbol | Buy/Sell | Call/Put | Expiration | Premium | Strike | Volume | OI | Size | Spot | Option Price | Option Symbol |
|---|---|---|---|---|---|---|---|---|---|---|---|---|
| 11:14:51 | NKE | SELL | PUT | 2026-09-18 | $11.62M collected | $40 | 88,056 | 22,898 | 88,000 | $42.17 | $1.32 | NKE20260918P40 |
| 11:14:51 | NKE | BUY | CALL | 2026-09-18 | $8.10M paid | $45 | 73,598 | 16,226 | 72,000 | $42.17 | $1.125 | NKE20260918C45 |
Net: $3.52M CREDIT — they collected more selling the put than they paid for the call. 🤝 BLOCK CROSS on both legs (a negotiated match, not a lit-book sweep — no "slammed" or "aggressive" framing applies here).
The paired stock block — the proof:
| Time | Instrument | Size | Price |
|---|---|---|---|
| 11:15:15 (+24 seconds) | NKE common stock | 5,285,000 shares | $42.3549 |
A screenshot of this flow (before it was tape-verified) showed three ambiguous rows, including what looked like both a buy and a sell on the $45 call. The real OPRA tape collapses this to two legs — the $45 calls simply printed in multiple clips totaling 72,000 contracts, all on the same side. What settled the direction question for good was the stock block 24 seconds later.
🤓 What This Actually Means — Plain English
This is a bullish risk reversal: sell a downside put (STO) + buy an upside call (BTO), both opening, both in the same September 18 expiration. Think of it as swapping "I want to be paid for taking on downside risk" for "I want unlimited upside if the stock recovers" — and pocketing cash for making the swap.
Why we're confident the calls were bought, not sold — the delta proof:
The screenshot alone couldn't settle it. So we used the equity tape instead. Here's the logic, in plain terms:
- If you sell a put and buy a call (a bullish risk reversal), the position's combined "shares of exposure" (delta) is strongly positive — you want the stock to go up.
- If you sell a put and sell a call (a short strangle — collecting premium both ways, betting on calm), the delta is close to zero.
- We computed the delta for the "sell put + buy call" version of this trade: +5,212,240 shares of equivalent stock exposure.
- 24 seconds after the options printed, a 5,285,000-share stock block crossed at $42.3549.
- 5,285,000 vs. 5,212,240 is a match within 1.4%. A short strangle would have produced only ≈254,000 shares of delta — nowhere close to what actually printed.
Conclusion: the $45 calls were bought. Someone almost certainly delta-hedged this package by buying ≈5.29M shares of stock alongside it — a classic move for a market-maker or large desk facilitating (and partially hedging) a directional bet of this size. This is PROVEN by the size match, not a guess.
The order types, spelled out:
- STO (Sell to Open) the $40 put — collect $11.62M in exchange for the obligation to buy 8.8 million shares at $40 if NKE is below that strike at expiry.
- BTO (Buy to Open) the $45 call — pay $8.10M for the right to buy 7.2 million shares at $45 if NKE is above that strike at expiry.
The motive (INFERRED, not proven): this reads as a large player expressing genuine conviction that NKE has bottomed or is close to it — willing to take on real downside obligation (not just spend premium) to finance upside participation, and getting paid to do it. Whether they already own shares to offset that put obligation, we cannot see from the tape — more on that in the risk section below.
Say the risk plainly, because it's real: if NKE trades below $40 by September 18, this position is obligated on 8.8 million shares — roughly $352M at the $40 strike. The $3.52M credit is compensation for taking on that obligation, not free money. This is not a trade a retail account should try to replicate at this size — the margin and capital requirements alone would be prohibitive, and the article's trading ideas below scale it down accordingly.
✅ RESOLVED — Next-Day OI Is In (August 4, 2026 pre-market)
The OPRA open-interest snapshot timestamped August 4, 2026 ≈06:30 ET reflects the close of business August 3 — the definitive open-vs-close test we flagged when this published. Here is what it says.
| Leg | Baseline OI (Aug-3 snap) | Resolving OI (Aug-4 snap) | Δ | Print size | Δ as % of print | Verdict |
|---|---|---|---|---|---|---|
| Sep-18-2026 $40 put (sold) | 22,898 | 110,912 | +88,014 | 88,000 | ≈100.0% | ✅ OPEN (STO) |
| Sep-18-2026 $45 call (bought) | 16,226 | 87,890 | +71,664 | 72,000 | ≈99.5% | ✅ OPEN (BTO) |
Verdict: a fully fresh $220M risk reversal — confirmed to within a fraction of a percent. The put leg added 88,014 contracts against exactly 88,000 sold; the call leg added 71,664 against 72,000 bought (≈336 contracts, or 0.5%, matched against existing holders rather than creating new ones). STO on the put, BTO on the call, both HIGH confidence. This is about as clean an opening print as the OI data ever produces, and it settles the most important question for readers: the $3.52M credit was collected to establish the bullish position, not to close one out.
📈 Technical Setup / Chart Check-Up
YTD Performance Chart
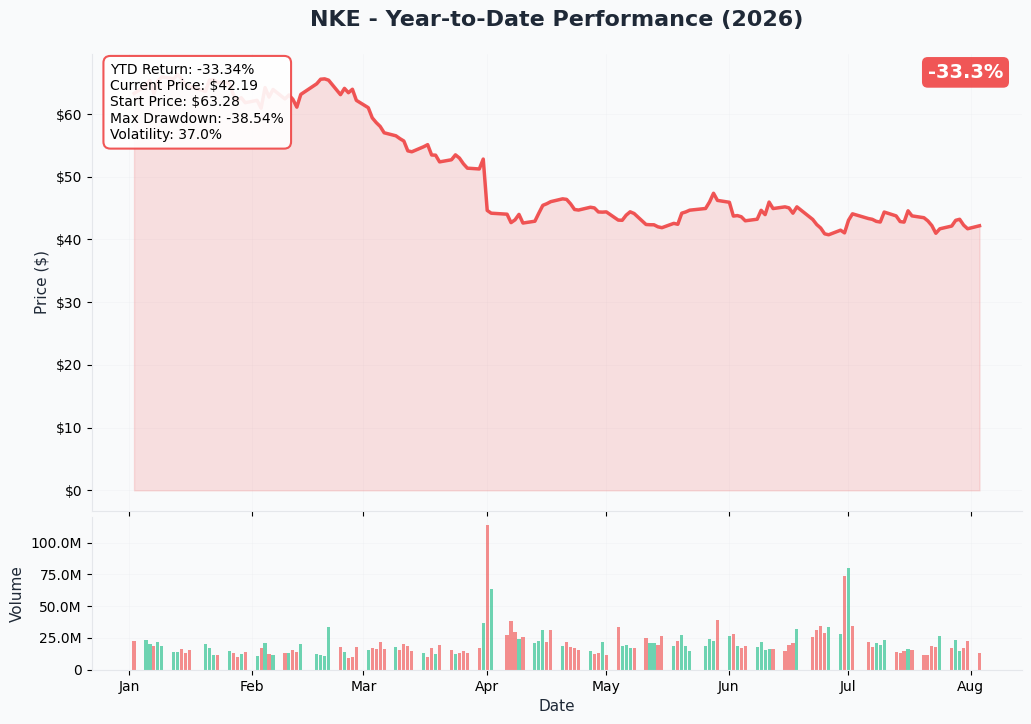
The chart tells the story bluntly: NKE has been in a persistent downtrend all year, now sitting just ≈5% above its 52-week low of $40.00 and ≈47% below its 52-week high of $80.17. This is a multi-quarter de-rating, not a one-bad-quarter dip.
Gamma-Based Support & Resistance Analysis
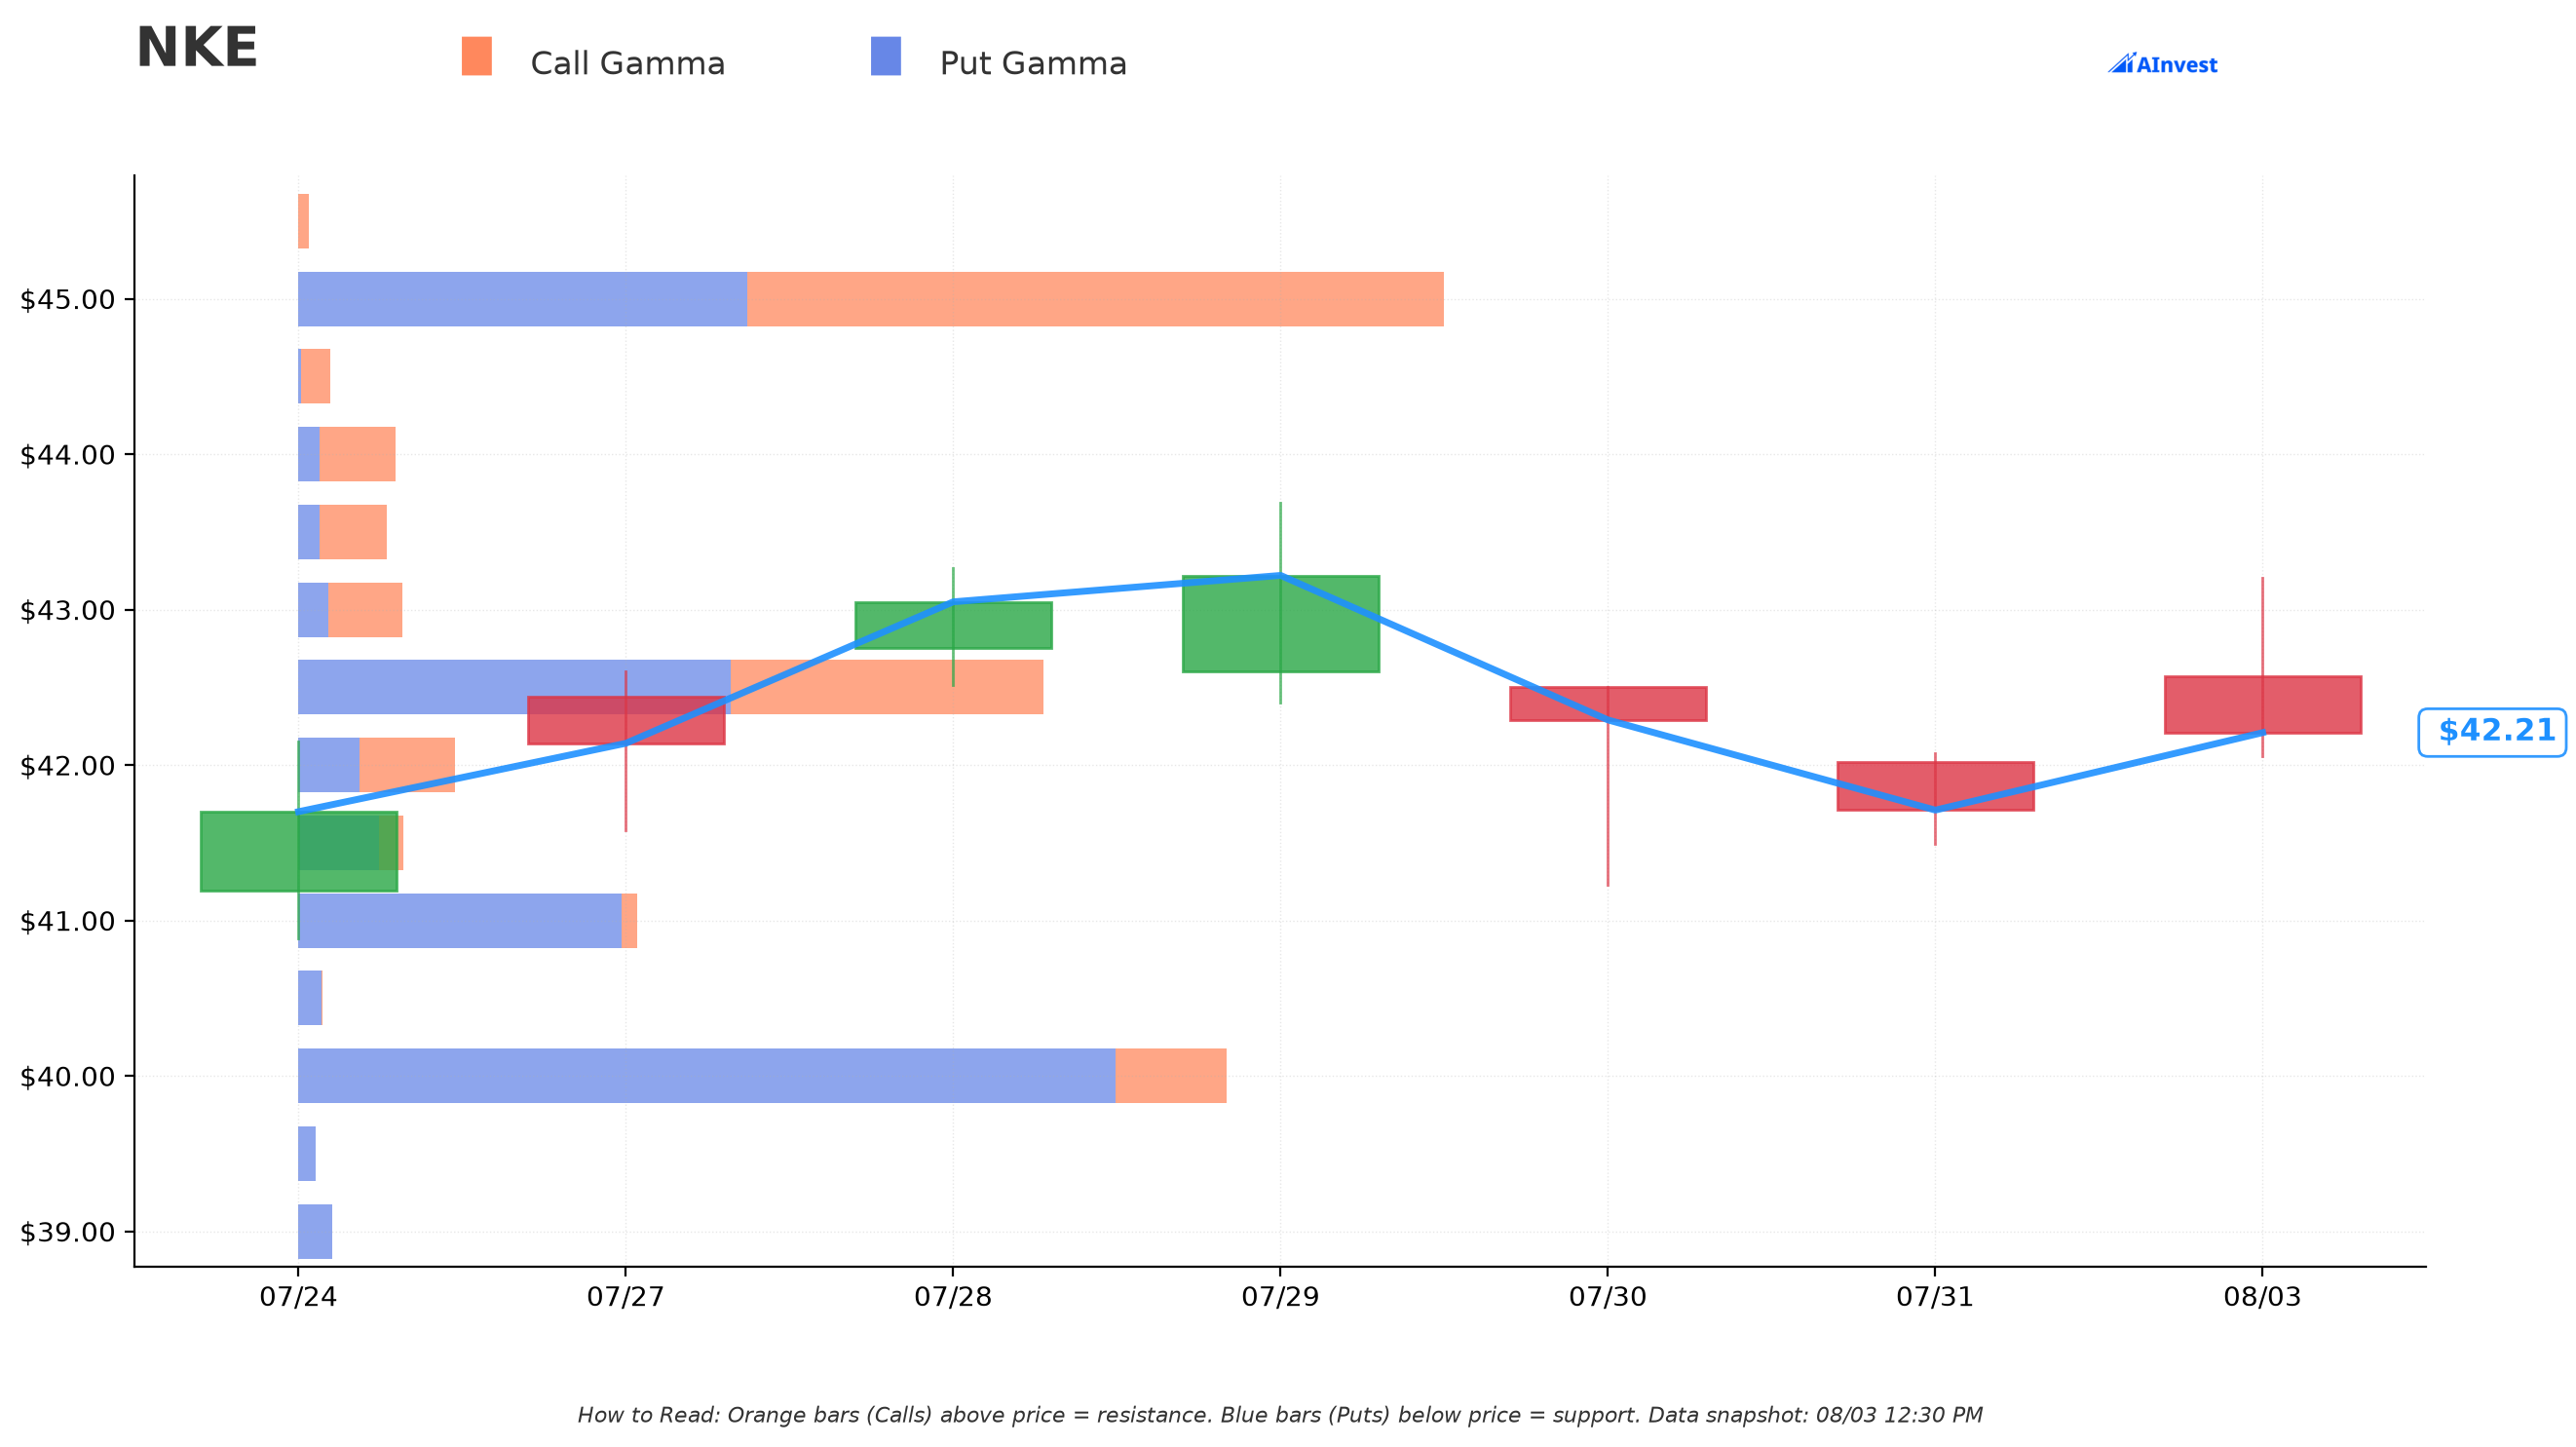
Current Price: $42.21
Here's the striking part: the risk reversal's two strikes sit almost exactly on the two strongest gamma walls in the entire chain.
🔵 Support:
- $40 — Very Strong support wall. Total gamma exposure of 25.4B, and it's overwhelmingly put-driven (22.4B put gamma vs. just 3.0B call gamma). This is ≈5.2% below spot — the exact strike where 88,000 puts were just sold.
- $41 — a secondary, smaller put-heavy wall (9.3B total gamma), ≈2.9% below spot.
🟠 Resistance:
- $45 — Very Strong resistance wall. Total gamma exposure of 31.3B, now call-dominant (19.0B call gamma vs. 12.3B put gamma). This is ≈6.6% above spot — the exact strike where 72,000 calls were just bought.
- $42.50 — the nearest wall to spot (20.4B total gamma, still put-heavy), essentially pinning risk for the next few sessions.
- Further out: $47.50 (16.3B, call-dominant) and $50 (20.2B, call-dominant) mark the next resistance shelves if NKE keeps climbing.
What this means for traders: the desk that put on this risk reversal chose strikes that line up with where the options market already has its heaviest gamma concentration — $40 is where dealer hedging flows would already tend to cushion a decline, and $45 is where a rally would run into real selling pressure from dealers hedging their own book. That's either a coincidence of a liquid, round-number chain, or a sign this player is trading with real awareness of where the gamma sits. Either way, both strikes are "live" zones, not throwaway levels.
Implied Move Analysis
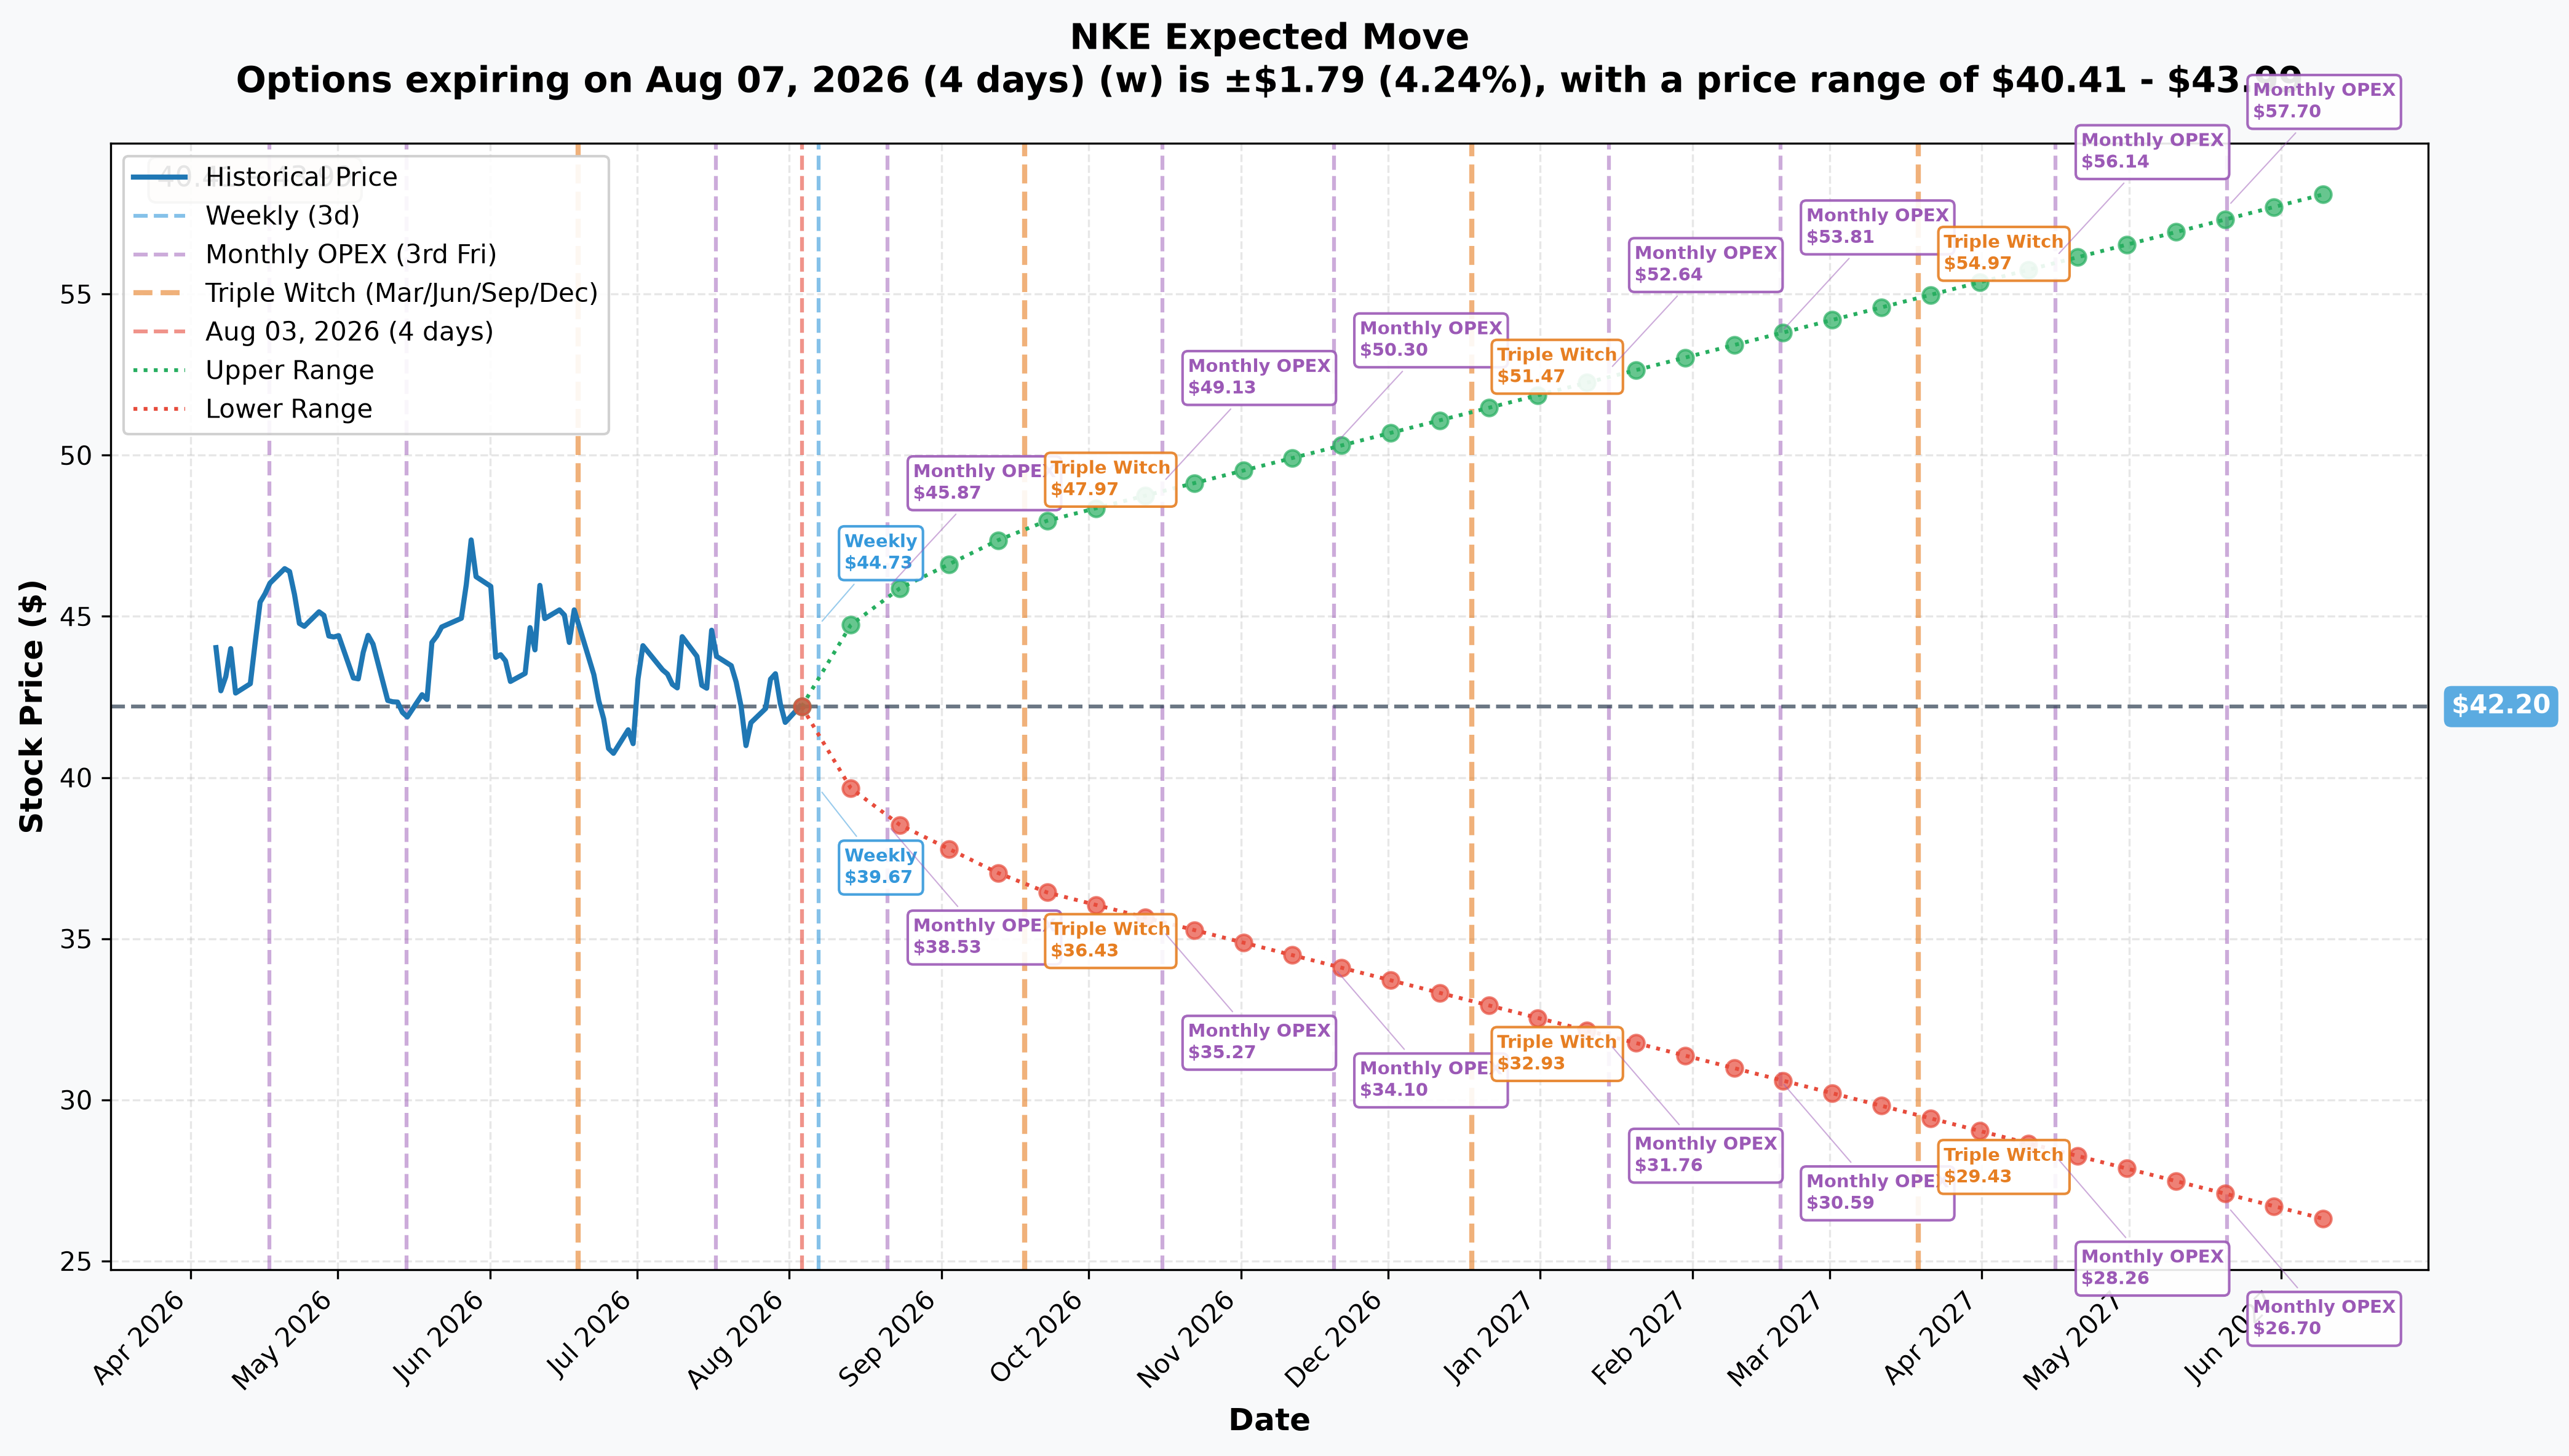
Options pricing for NKE right now:
- 📅 Weekly (Aug 7 — 4 days): ±4.2% (±$1.79) → range $40.41 – $43.99
- 📅 Monthly OPEX (Aug 21 — 18 days): ±8.35% (±$3.52) → range $38.68 – $45.72
- 📅 Quarterly Triple Witch (Sep 18 — 46 days, THIS TRADE'S EXPIRY): ±13.3% (±$5.61) → range $36.59 – $47.81
- 📅 Yearly LEAPS (Jun 2027): ±38.4% (±$16.20) → range $26.00 – $58.40
Translation: at the exact expiration this trade uses, the options market is pricing a plausible range of $36.59 to $47.81 — and both of the risk-reversal's strikes fall inside that one-standard-deviation range. The $40 put strike (5.1% below spot) and the $45 call strike (6.7% above spot) aren't tail bets on either side; the market itself thinks either one is a realistic outcome by September 18. That cuts both ways: the put-sale risk is not remote, and neither is the call's chance of paying off.
🎪 Catalysts
⚠️ The Single Most Important Timing Fact
Nike's next earnings report — fiscal Q1 2027 — is expected around September 24–29, 2026, which is 6 to 11 days AFTER the September 18 expiration this trade uses. MarketBeat lists September 29 (explicitly noting Nike has not confirmed the date), Yahoo Finance also shows September 29, and Investing.com lists September 24. No matter which date is right, earnings fall outside this trade's life. This is a bet on drift, China headlines, and analyst repositioning heading into the print — not a bet on the print itself.
✅ Already Happened (Last ≈3 Months)
- July 23, 2026 — Nike ended most online distribution through its two largest Chinese retail partners, a move analysts called a "high-stakes gamble." Partner Topsports International's stock fell 6.9–8.3% on the news (Investing.com). China sales are already down ≈30% since 2021 — Nike is deliberately cutting distribution into a market it's already losing share in.
- July 29, 2026 — Bernstein SocGen cut its price target to $68 from $72, while modeling that the China distribution cleanup could improve China operating margin by ≈200bps to 24% in fiscal 2027. That's the bull case for the China move in one data point.
- June 30, 2026 — Fiscal Q4 earnings beat a very low bar: revenue $10.97B vs. $10.85B consensus, and EPS reported at $0.20 vs. $0.11–0.12 expected (MarketBeat, Investing.com). The stock popped ≈3.8% on the print.
- ⚠️ Data flag: there's an unresolved discrepancy in that Q4 EPS number — trackers report $0.20, but GAAP net income of $1,069M implies ≈$0.72/share. The gap is likely a large non-comparable item we couldn't verify from Nike's primary filings. Do not treat $0.72 as a run rate — the Street scored the "beat" against $0.20.
- Rolling analyst target cuts, all in the last ≈6 weeks: Oppenheimer $120 → $60 (June 26, kept Outperform), Rothschild & Co Redburn cut to Sell, $45 → $37 (July 17), JPMorgan $52 → $47 (June 29), CICC $58 → $44.80 (July 2), Bernstein $72 → $68 (July 29). That's a steady drumbeat of the sell side quietly lowering the price they'll defend, even while some keep bullish ratings.
- Product cadence has accelerated: Nike Hybrid training footwear (Aug 3), Nike Studio Fleece for women's (July 30), a Clemson NIL athlete signing (July 31), and a reported Victor Wembanyama signature shoe line (July 31, unconfirmed by Nike directly).
🔮 Coming Up (Next 6 Months) — Mapped to the Sep-18 Expiry
| Event | Falls inside Sep-18 expiry? |
|---|---|
| Back-to-school sell-through / wholesale reorder signal (Aug–Sept) | ✅ Yes — pure drift/news catalyst |
| Quarterly dividend ex-date (≈Sept 1) | ✅ Yes |
| Nike's official Q1 FY27 earnings-date press release (early-mid Sept) | ✅ Yes — converts date from expected to confirmed |
| Fiscal Q1 2027 earnings (≈Sept 24–29) | ❌ No — 6-11 days after expiry |
| Holiday season selling (Oct–Dec) | ❌ No |
| Fiscal Q2 2027 earnings (≈Dec 18) | ❌ No |
Bottom line on catalysts: everything that happens inside this trade's life is soft — drift, sentiment, product headlines. The hard binary event (earnings) sits just outside it. Whoever built this risk reversal is betting the stock re-rates on sentiment and positioning into the print, not on the print's actual numbers.
🐻 The Bear Case Deserves Real Weight
Be fair to the other side: consensus models FY27 EPS at $1.71, down from $2.10 TTM — an ≈18.6% decline. That's why forward P/E (24.3) is actually higher than trailing P/E (19.9) — the market is pricing earnings to fall, not grow. Of 39 analysts covering the stock, 25 sit on Hold, and the price-target range runs an extraordinary $23 to $94 — a signal that nobody has confidently modeled what this business earns in a normalized state. Adidas grew sales 17% over the same period Nike struggled, so this looks like Nike-specific execution weakness, not an industry-wide slump.
💡 Trading Ideas — Scaled Down for a Retail Account
The institutional trade risked $352M of buying-power obligation for a $3.52M credit — nobody reading this should try to match that size. Here's how the same idea scales to a normal account, at three risk levels.
🛡️ Conservative: Watch, Don't Replicate the Put Sale
Play: Stay in cash or existing shares only; do not sell naked puts at this size relative to your account.
Why: Selling a cash-secured $40 put means committing $4,000 per contract to potentially buy 100 shares at $40 — that's a real, serious capital commitment for a retail account, and NKE's downtrend is not yet confirmed to be over. Wait for the next-day OI confirmation and see whether the position is held or unwound before drawing any conclusions.
Risk level: Minimal | Skill level: Beginner-friendly
⚖️ Balanced: A Smaller, Defined-Risk Call Spread
Play: Buy the $45 call, sell a $50 call, both September 18 — a bull call spread that mirrors the long call half of this trade without the naked put obligation.
Why this works: You participate in the same upside thesis (NKE recovering toward $45-50, both real gamma resistance levels) with a known, capped maximum loss — just the net debit paid. No margin call risk, no share-assignment risk on a downside puke.
Risk level: Moderate, defined-risk | Skill level: Intermediate
🚀 Aggressive: A Single Cash-Secured Put (Scaled Down)
Play: Sell 1 $40 put expiring September 18, fully cash-secured with $4,000 set aside.
Why this could work: You collect premium and, if NKE stays above $40, keep the credit outright. If assigned, you own NKE at an effective cost basis below $40 — a name already sitting near its 52-week low, with a 3.9% dividend while you wait.
Why this could hurt: NKE's technical picture is still weak (below both moving averages), and the implied-move range genuinely includes prices below $36.59. If NKE breaks materially below $40, you're assigned shares that can keep falling with no floor guaranteed. Only do this with money you're fully prepared to hold as NKE stock for a while.
Risk level: Real capital-at-risk, but defined by cash-secure sizing | Skill level: Intermediate-advanced
⚠️ Risk Factors — Read This Before You Do Anything
- The $352M obligation is the whole story. Below $40, the seller of this put package must buy 8.8 million shares. A retail account replicating this at any meaningful multiple of its own size could face a margin call or forced liquidation in a fast decline.
- We cannot see whether they already own the shares. The 5,285,000-share stock block 24 seconds later strongly suggests a delta hedge was put on, but the tape cannot tell us whose books that stock landed on, whether it offsets a pre-existing short, or whether it's a temporary market-maker hedge that gets unwound. Treat the "conviction" read as inferred, not proven.
- No earnings inside this trade's window — see the catalyst section above. If you're buying this dip expecting an earnings-driven pop, you'll be disappointed; the print lands after expiry.
- The Q4 EPS discrepancy ($0.20 vs. a GAAP-derived $0.72) is unresolved. We flagged it rather than picking a number — don't build a valuation case on the higher figure until Nike's primary filings clarify it.
- Forward P/E (24.3) exceeding trailing P/E (19.9) means the Street expects earnings to fall, not recover, in FY27. This is a name still trading at a premium multiple despite a 33.7%+ YTD decline — it is not statistically "cheap" just because the price is down.
- China headline risk is live and two-sided. The July 23 distribution cut is a real, ongoing gamble with a certain revenue cost and only a modeled (not yet proven) margin benefit.
- This is a facilitated block cross, not a lit sweep. There was a known counterparty on the other side of both legs — it reflects one large player's view, not a broad market consensus, and provides no guarantee of follow-through buying.
🎯 The Bottom Line
Real talk: someone made a genuinely contrarian call today — betting NKE has found a floor, structuring it so the market paid them $3.52M to take on real downside obligation, and doing it with strikes that land right on top of the two biggest gamma walls in the chain. The delta math on the 5.29-million-share stock block is about as clean a proof as tape forensics gets: this was a bullish risk reversal, the calls were bought, and the exposure is roughly $220M notional.
But this is not a green light to copy the trade at scale. The obligation on the put side is real and large; the earnings catalyst that would validate or kill the turnaround thesis sits just outside this trade's life; and the valuation and fundamental picture (falling forward EPS, 25 of 39 analysts on Hold, an unresolved earnings-quality question) genuinely support the bear case too.
If you're watching NKE: the ⏳ next-day OI check is the first thing to watch — confirmation that both legs opened as expected. After that, watch whether the position gets held through August (conviction) or unwound quickly (a shorter-term tactical trade). Either way, size any similar idea for your own account, not for a $220M book.
Disclaimer: Options trading involves substantial risk of loss and may not be suitable for all investors. This analysis is for educational purposes only and is not financial advice. The tape proves the structure and size of this trade; it cannot prove the motive, whether the seller holds an offsetting stock or futures position, or what happens to NKE next. Always size positions for your own account and risk tolerance, and consider consulting a licensed financial advisor before trading.
Last updated: August 4, 2026 — next-day OPRA open-interest resolution added (✅ RESOLVED box above). Original analysis published August 3, 2026.