🤝 PANW $1.05M Call Roll — A Desk Buys Time Across Earnings
📅 2026-08-03 | 🔍 Multi-Leg Floor Trade Detected
✅ UPDATE — August 4, 2026 pre-market: the roll is CONFIRMED. The Aug-7 $390 call fell 2,349 → 1,388 (−961) against a 920-lot print — open interest went down, which is the close signature we said would settle it. The Sep-4 leg rose 10 → 932. See the ✅ RESOLVED box.
🎯 The Quick Take
At 15:20:10 ET, with Palo Alto Networks (PANW) trading at $345.97 (+4.2% on the day), a desk crossed two $390-strike call legs on the exchange floor in the same millisecond — selling 920 August 7 calls and buying 920 September 4 calls, a $1,046,960 net debit. The Aug 7 contract dies this Friday, four days before earnings could even happen under the most conservative date estimate. The Sep 4 contract survives past every earnings-date estimate we found. This reads as a long call roll, moving upside exposure at the same $390 strike off a contract that can't see the print and onto one that can.
🏢 Company Overview
Palo Alto Networks is a Nasdaq-listed cybersecurity platform company — network security, cloud security, and increasingly identity/AI-security, sitting in the Information Technology sector (StockAnalysis). It closed the largest deal in its history this year, acquiring identity-security firm CyberArk for roughly $25 billion in cash and stock (StockTitan — CYBR), pushing the company from pure network security into privileged access and machine-identity protection — a bet on securing the identities that AI agents themselves will need.
- Market cap: ≈$282B
- 52-week range: $139.57 – $368.80
- 1-year performance: +92.5% (see chart below)
- Revenue TTM: $10.61B, +19.5% YoY
- Next-Gen Security ARR: $8.1B, +60% YoY (as of Q3 FY26)
Source: StockAnalysis PANW overview.
💰 The Option Flow Breakdown — What Actually Printed
The screenshot that started this only showed one leg and rounded the premium to "$1.1M." The real OPRA tape shows two legs, same strike, same size, same millisecond — a paired structure, not a single trade.
| Leg | Action | Right | Expiry | Strike | Size | Price | Premium | Prior OI | Delta |
|---|---|---|---|---|---|---|---|---|---|
| 1 | 🟢 BUY | CALL | 2026-09-04 | $390 | 920 | $11.78 | $1,083,760 paid | 10 | +0.2707 |
| 2 | 🔴 SELL | CALL | 2026-08-07 | $390 | 920 | $0.40 | $36,800 collected | 2,349 | +0.0276 |
- Net cost: $1,083,760 − $36,800 = $1,046,960 debit
- Package net delta: ≈+22,365 shares — modestly bullish, not aggressive
- Spot at print: $345.97
- Option symbols: PANW20260904C390 · PANW20260807C390
Mechanism (proven from the tape): this was a multi-leg floor trade — a manually negotiated block matched on the exchange floor, the dominant condition code across every print in this structure. That's a known counterparty, worked off the lit book. It is not a sweep, not aggressive lit buying, and there's no "panic" or "urgency" narrative here — a desk arranged this trade on purpose. 🤝 Tag: BLOCK CROSS.
A full scan of every live PANW expiration at the exact print millisecond found exactly these two legs. Nothing else traded in that instant — this is a clean, self-contained two-leg package.
✅ RESOLVED — Next-Day OI Is In (August 4, 2026 pre-market)
The OPRA open-interest snapshot timestamped August 4, 2026 ≈06:30 ET reflects the close of business August 3 — the definitive open-vs-close test we flagged when this published. Here is what it says.
| Leg | Baseline OI (Aug-3 snap) | Resolving OI (Aug-4 snap) | Δ | Print size | Predicted | Verdict |
|---|---|---|---|---|---|---|
| Sep-04-2026 $390 call (bought) | 10 | 932 | +922 | 920 | ≈930 | ✅ OPEN (BTO) |
| Aug-07-2026 $390 call (sold) | 2,349 | 1,388 | −961 | 920 | ≈1,429 if closing | ✅ CLOSE (STC) |
Verdict: a roll, exactly as the structure suggested — now proven, not inferred. We laid out two opposite outcomes: open interest falling on the August 7 call would confirm a close (the roll read), rising would mean a fresh short was sold and the roll read weakens. It fell by 961 contracts — slightly more than the 920 that printed, meaning our block closed and a few other holders closed alongside it. The September 4 leg rose from a near-empty 10 contracts to 932, essentially the full print.
So the labels are settled: STC on the August 7 call, BTO on the September 4 call — a true calendar roll. The desk paid ≈$1.05M to move a $390-strike call position across the earnings date rather than let it expire. That is a bet on timing, and the article's read holds without qualification.
🤓 What This Actually Means — Plain English
Strip away the option jargon and here's the trade: someone owned (or was about to own) $390-strike PANW calls expiring this Friday, August 7 — a contract with only four days of life left, sitting ≈12.7% out of the money with a delta of just 0.0276. That option was basically dead. It sold for $0.40, recovering only about 3.4% of what a similar position would've cost fresh. Nobody sells a 4-day, far-OTM call to "collect premium" — there's almost nothing left to collect.
At the exact same moment, the same size (920 contracts) was bought at the same $390 strike, but in the September 4 expiration instead. That's the tell. This wasn't about the strike — it was about the calendar.
Why the calendar matters here specifically: Palo Alto's next earnings report is scheduled for either September 1 (per two independent trackers) or, less likely, August 17 (a MarketBeat estimate, unconfirmed). Under either date, the August 7 contract expires before the report and the September 4 contract does not. Whoever ran this trade moved their $390 call exposure off a contract that can't see earnings and onto one that can — buying time across the print without changing the strike or the directional bet.
- Leg 1 = BTO (Buy-to-Open), proven. A fresh long position in the September call.
- Leg 2 = likely STC (Sell-to-Close), inferred but not proven. The strong read is this closed an existing long in the dying August contract to fund part of the new one. It's also mathematically possible — just less likely given the structure — that this opened a new short call instead. Tomorrow's OI move settles it.
Net effect: a $1,046,960 bet that PANW is still above $390 — or moving toward it — by September, wrapped around the earnings event, not away from it. That's a directional, catalyst-aware position, not a hedge and not a pure premium-collection play.
📈 Technical Setup
YTD Chart
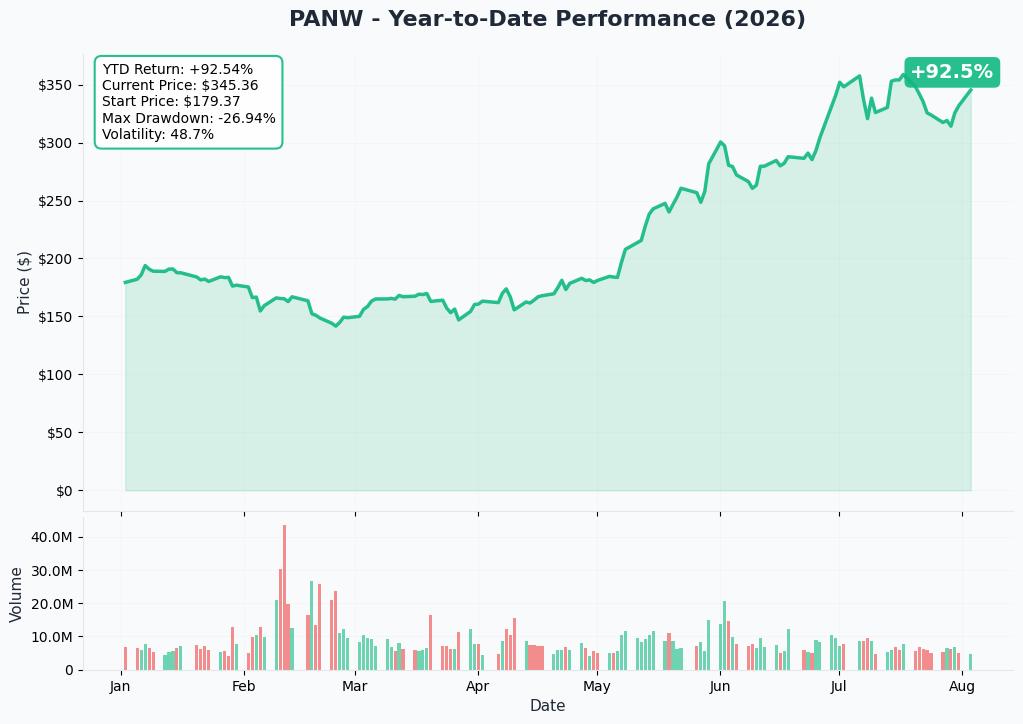
PANW is +92.5% over the past year, with the stock roughly doubling in just the last three months on the back of the CyberArk close and a string of AI-security product launches (StockAnalysis). Spot at $345.97 sits about 6% below the 52-week high of $368.80 and well above the 52-week low of $139.57.
Gamma-Based Support & Resistance
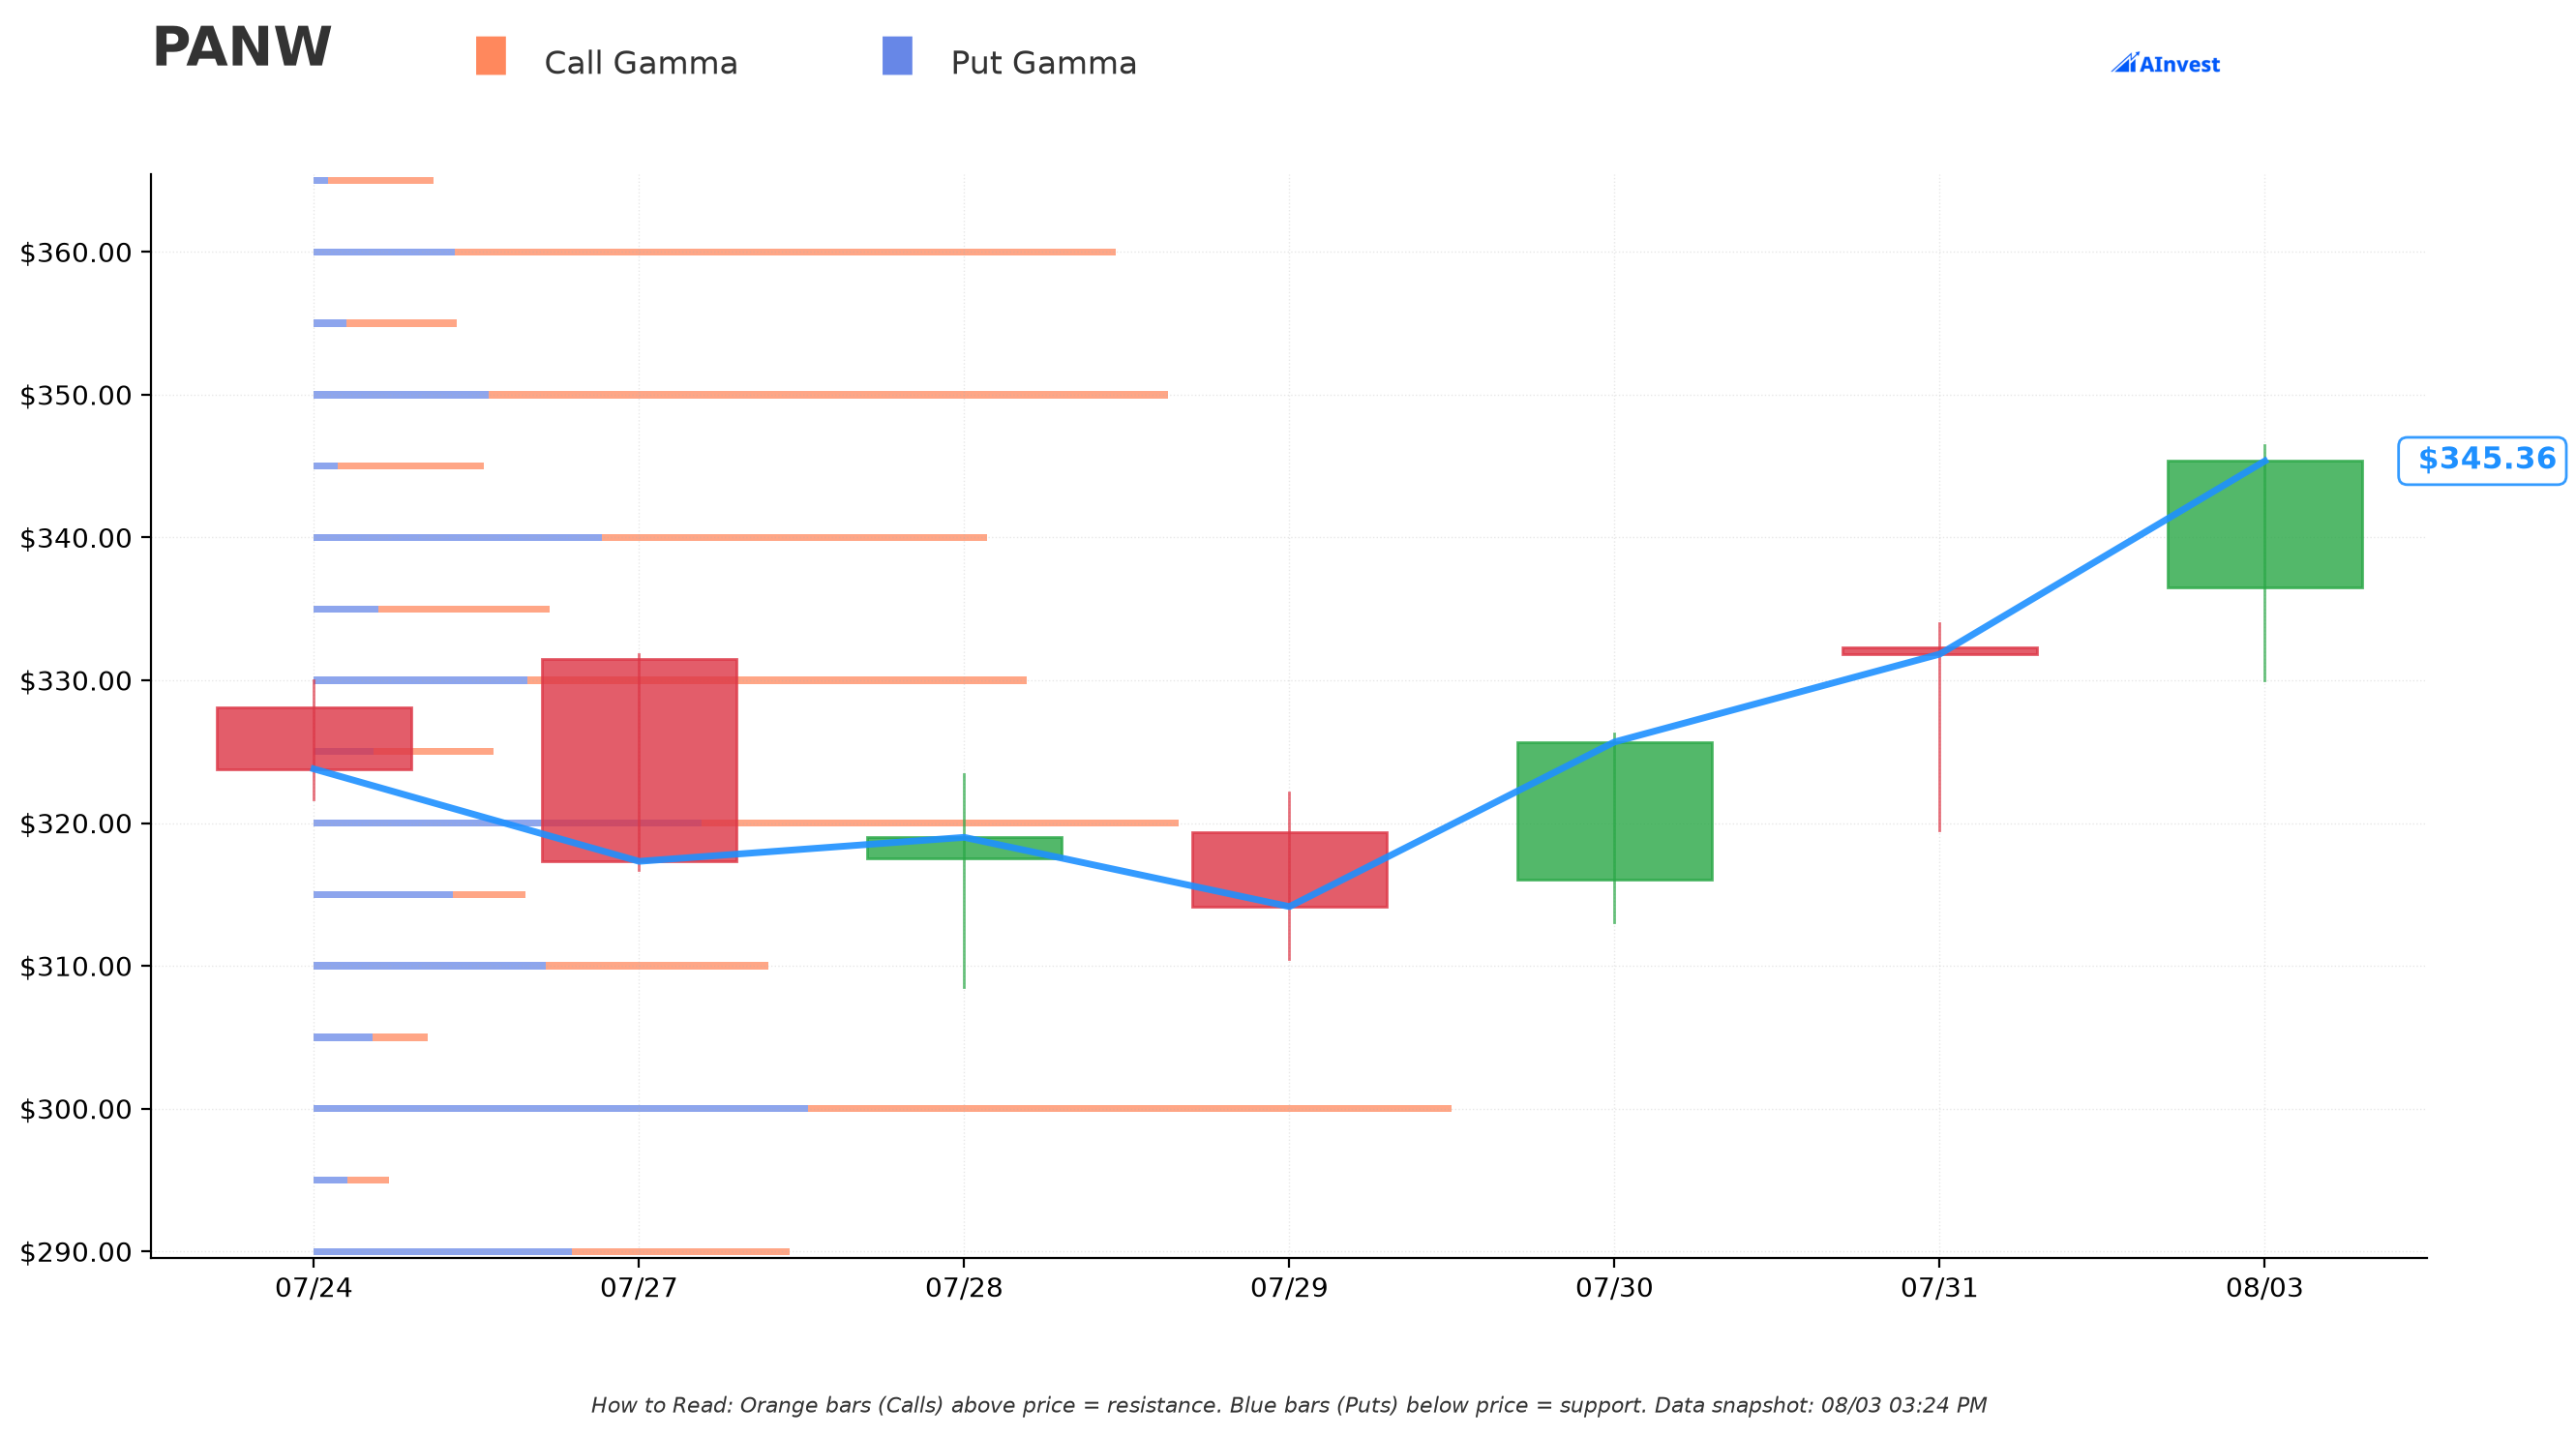
Reading the live gamma exposure (GEX) around spot ($345.34 as computed):
- 🟠 Call Wall (resistance): $370 — the single biggest cluster of call gamma above spot. This is roughly where dealer hedging flow tends to act as a ceiling, cushioning fast up-moves.
- 🔵 Put Wall (support): $300 — the biggest put-gamma cluster below spot, the level where dealer hedging tends to act as a floor on the way down.
- Smaller call-gamma clusters also sit at $350 and $360, meaning the road from spot up to the $370 wall isn't perfectly smooth — there's resistance stacked along the way.
The trade's $390 strike sits above the call wall, in thinner gamma territory — consistent with a position betting on a real move, not just price drifting into an already-crowded strike.
Implied Move
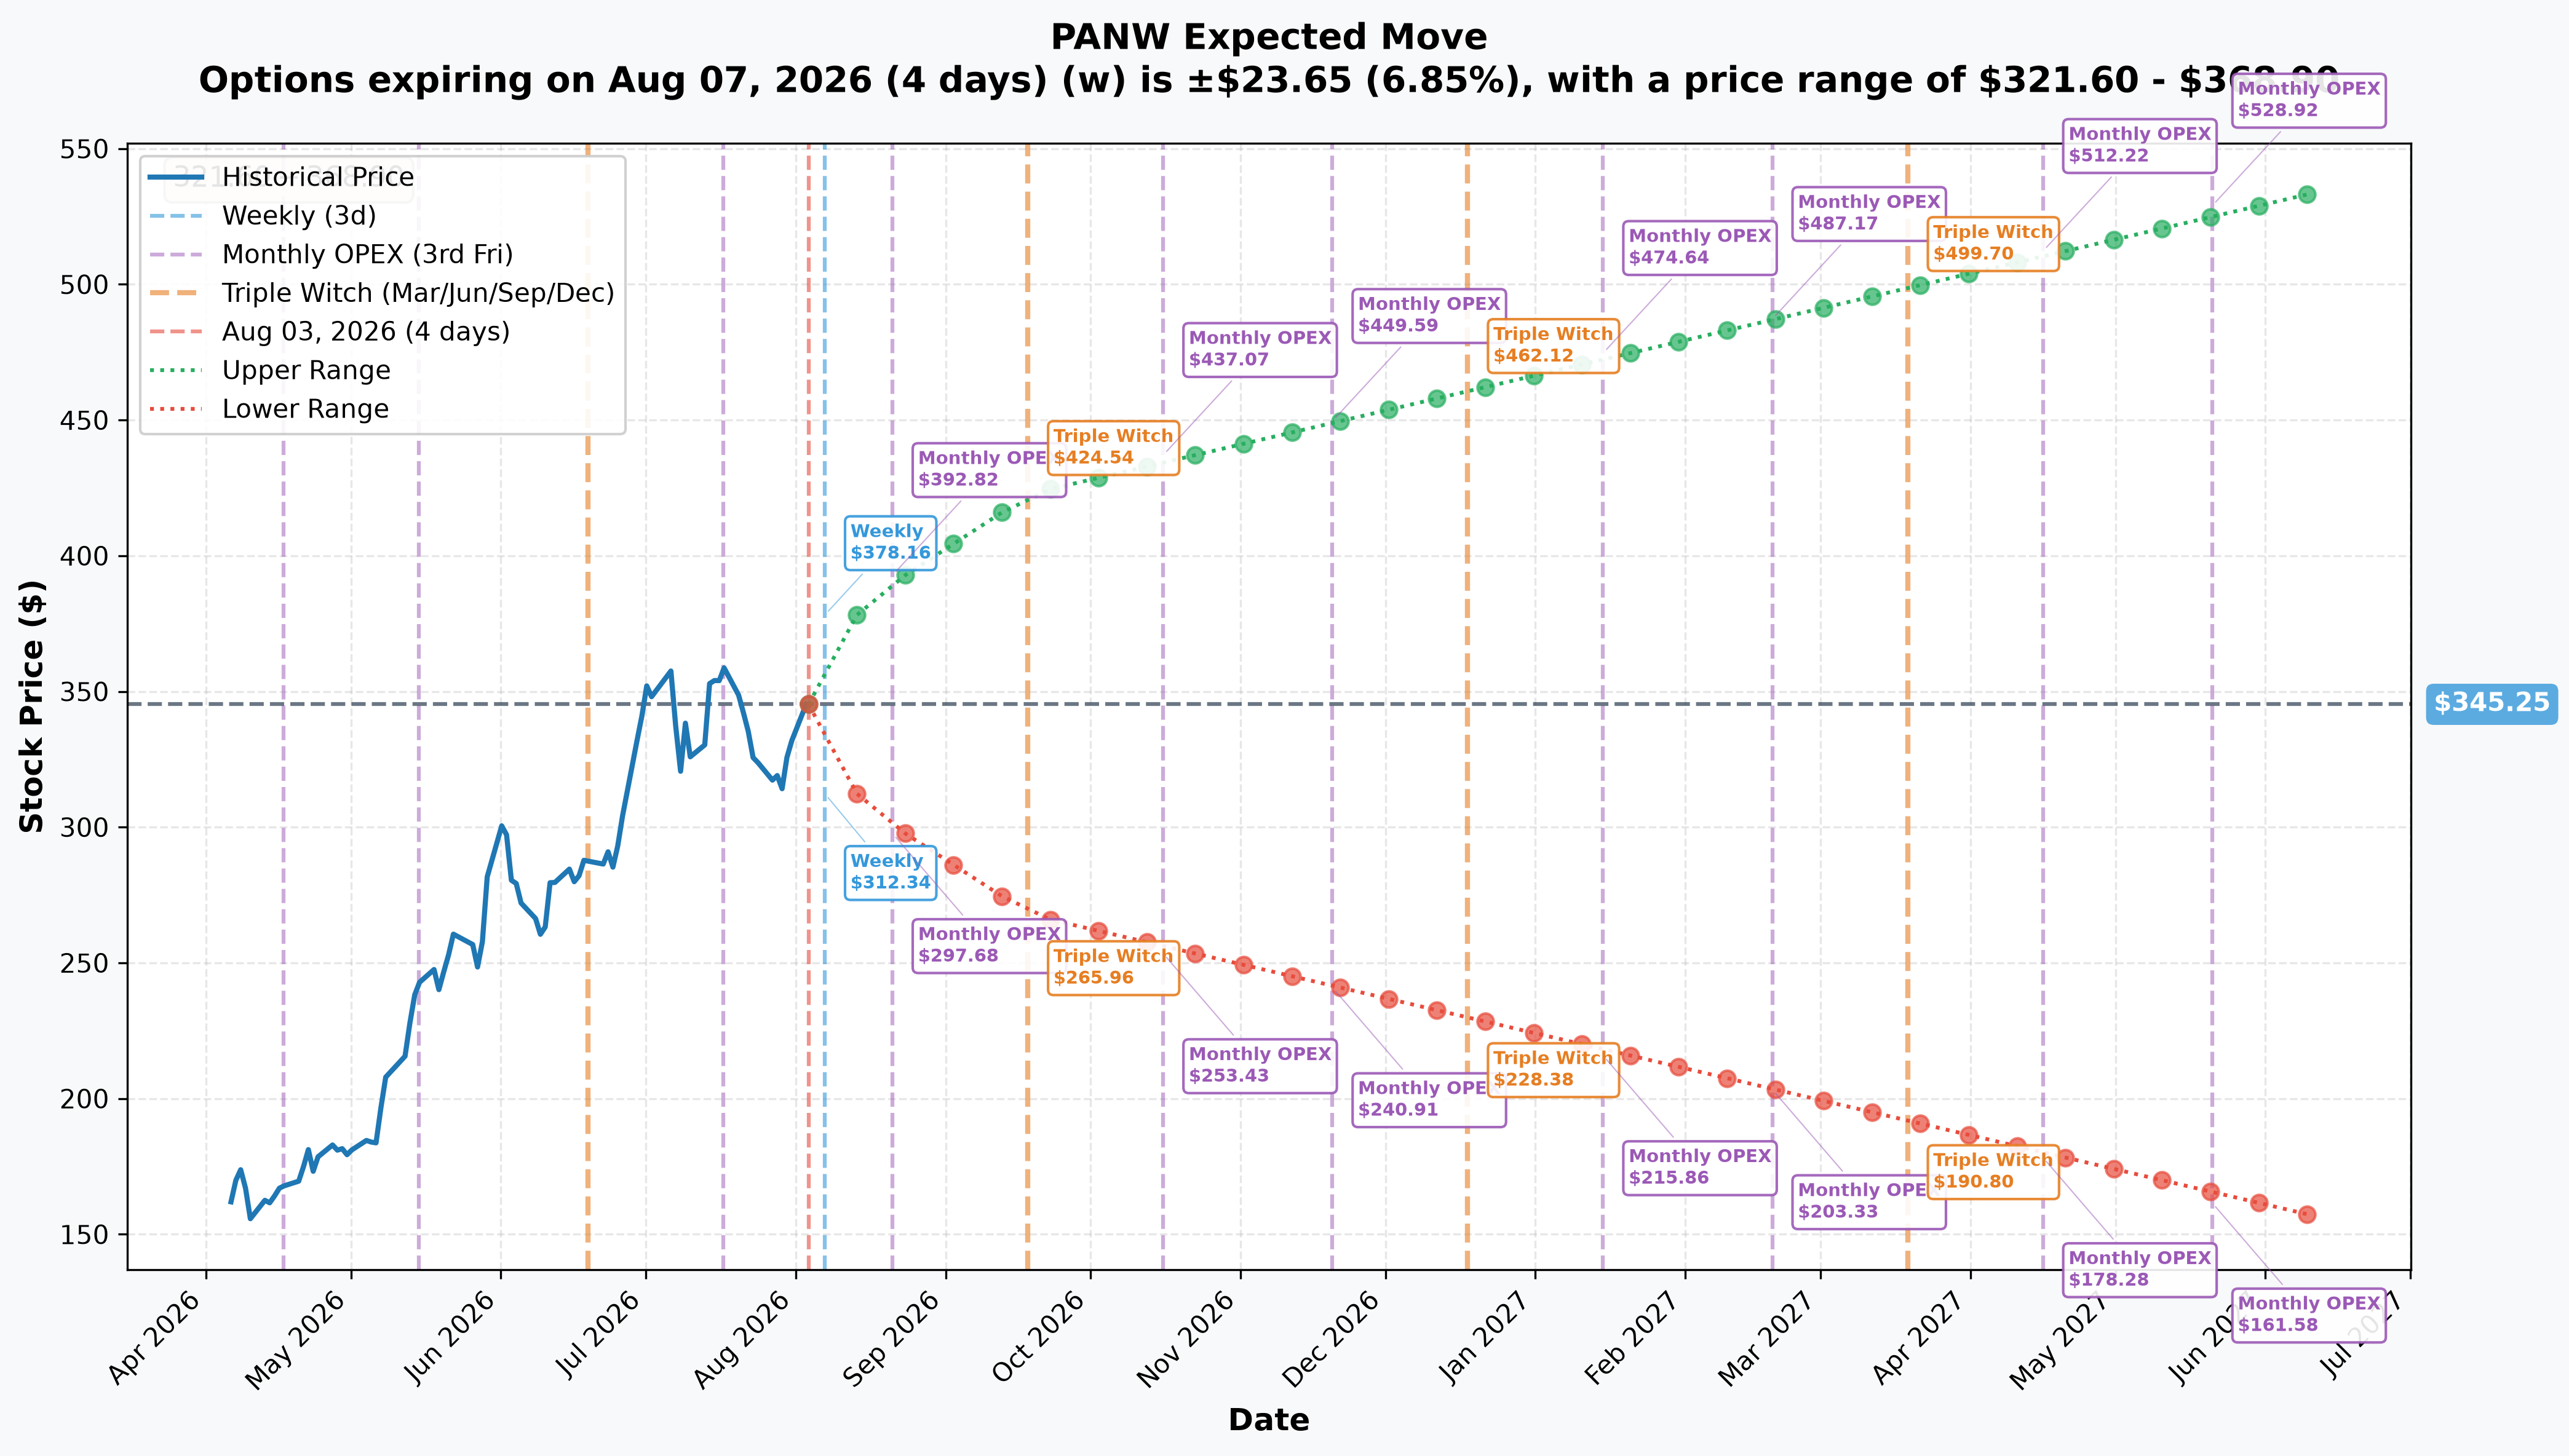
Straight from the options market's own pricing (PANW_implied_move.json):
| Expiry | Days Out | Implied Move | Range |
|---|---|---|---|
| Aug 7 (weekly — the sold leg) | 4 | ±6.85% ($23.65) | $321.60 – $368.90 |
| Aug 21 (monthly OPEX) | 18 | ±13.11% ($45.26) | $299.99 – $390.51 |
| Sep 18 (triple witch) | 46 | ±22.48% ($77.62) | $267.63 – $422.87 |
Two things jump out. First, the Aug 7 leg that got sold was never going to reach $390 — the market's own 1-standard-deviation move tops out at $368.90, nowhere close to the strike, which is exactly why it was trading for $0.40. Second, by the Aug 21 monthly expiration the market's implied upper bound is $390.51 — almost precisely the strike traded here. By the September 18 quarterly expiration, $390 sits comfortably inside the implied range (upper bound $422.87), meaning the market already prices a move to $390 as plausible, not a stretch, once you give it enough time — which is exactly what this roll bought.
🎪 Catalysts
⚠️ The earnings date is genuinely contested — and it's the whole point of this trade
| Source | Date | Confidence |
|---|---|---|
| StockAnalysis | September 1, 2026 | Listed as scheduled |
| StockTitan | September 1, 2026, after close, 1:30 p.m. PT webcast | Sourced to a company-style press release |
| MarketBeat | August 17, 2026 | Explicitly labelled ESTIMATED, modeled off last year's cadence (FY25 Q4 landed 8/18/2025) |
We could not independently verify the September 1 date against Palo Alto's own investor-relations page (it timed out during research), so we're presenting both dates rather than picking one. The conclusion holds either way: whether earnings land August 17 or September 1, the August 7 contract that got sold expires before the report, and the September 4 contract that got bought does not. That timing gap is the entire logic of this roll, and it survives the date uncertainty.
Upcoming
- Q4 FY2026 + full-year earnings — the single biggest catalyst on the calendar, and the first full year closed with CyberArk inside the numbers. The market's first clean look at combined NGS ARR, margins and the FY2027 guide (StockAnalysis forecast).
- Embrace acquisition close — expected Q1 FY27 (August–October 2026), a smaller, datable event inside this same window (StockTitan).
Already happened
- CyberArk acquisition closed, contributing $388M to Q3 FY26 revenue (StockTitan — PANW).
- Q3 FY26 results (June 2, 2026): revenue $3.0B (+31% YoY), NGS ARR $8.1B (+60% YoY), but a GAAP net loss of $177M (StockTitan, StockAnalysis financials).
- Five straight non-GAAP EPS beats, averaging ≈+$0.06 per quarter (MarketBeat earnings history).
- July 2026 target raises: BofA $330→$420 (7/24), Baird $320→$400 (7/22), Argus $320→$425 (7/21), plus Morgan Stanley naming PANW a "Top Pick" at $387 (StockAnalysis forecast).
🎲 Price Targets & Probabilities
Using the gamma levels and implied-move math above, alongside where analysts sit:
- Bull case ($390+): Would require breaking through the $370 call wall and pushing into the top of even the September 18 implied range. Possible, but it's the tail case, not the base case — this is roughly where the traded $390 strike lives.
- Base case ($320–$370): Sits inside the Aug 21 implied range and hugs the call-wall resistance zone. This is where price tends to gravitate given current gamma positioning.
- Bear case (below $300): The put wall. A break below here would be the first real test of dealer support since the recent run.
Worth flagging plainly: the average analyst target is $336.70 — below the current $345.97 spot (StockAnalysis forecast). Consensus is still Buy (34 Strong Buy, 11 Buy, 9 Hold, 0 Sell, 1 Strong Sell across 55 analysts), but price has run ahead of where the average analyst thinks it belongs, even as individual targets get raised. The dispersion is wide too — high target $433, low target $162.34.
💡 Trading Ideas
🛡️ Conservative
Skip the $390 strike entirely. If you want exposure to the earnings catalyst without chasing a strike that's already above the call wall, consider a smaller position closer to the money, sized so a miss doesn't hurt.
⚖️ Balanced
Watch the September 4 $390 calls as a sentiment gauge, but don't mirror the trade blind. The size here ($1.05M net) is a professional's position sizing, not a retail-appropriate one-to-one copy. A vertical spread around the same thesis (long a closer strike, short something further out) caps the cost of being wrong about the date.
🚀 Aggressive
Following the exact structure means paying up for a September 4 call that's ≈12.7% out of the money with roughly 33 days to run, betting the stock keeps grinding higher through an earnings print whose exact date isn't even confirmed. That's a real bet on both direction and timing being right — size it like one.
🧑🤝🧑 How Different Readers Should Think About This
- 🎰 YOLO trader: The $390 September calls are a real, dated bet with earnings inside the window — but you're paying up for a strike that's already above the gamma resistance zone, and you don't know for certain the report even lands before Sep 4 expiration. Confirm the date before you touch this strike.
- 📈 Swing trader: The interesting read isn't the strike, it's the roll itself — a desk chose to keep this exposure alive across an event rather than let it expire worthless. That's a signal worth watching, not necessarily copying. Wait for tomorrow's OI confirmation before weighting it.
- 💰 Premium collector: There's no credit story here worth chasing — the $0.40 sale on the dying leg was a rounding error against the $11.78 purchase. This wasn't a premium-collection trade; don't read it as one.
- 🌱 Beginner: This is a good real-world example of an option "roll" — moving the same bet from an expiring contract to a later one. Notice that the size and the price of the near-dated leg ($0.40, 12.7% OTM, 4 days left) tell you it was nearly worthless — that's why it made sense to abandon and replace it rather than hold to expiration.
⚠️ Risk Factors & Honest Limits
- The strike is ≈12.7% above spot with 33 days to reach it — after the stock has already roughly doubled in three months. A lot of the easy move may already be behind it.
- The average analyst target ($336.70) sits below the current price. Consensus is still bullish, but the market has run ahead of where most analysts think fair value sits — a modest guide miss could invite a real pullback.
- The Aug 7 leg's open/close status is genuinely unresolved. We are calling this a roll because the structure (same strike, same size, same moment, near-dated sold / far-dated bought, priced at a small fraction of value) strongly supports it — but the tape alone cannot prove it. It could be a fresh short instead. Tomorrow's OI print is the definitive test.
- The earnings date itself is unconfirmed. We could not verify the September 1 date against Palo Alto's own investor-relations site. If MarketBeat's August 17 estimate is instead correct, the timing math still favors the same conclusion (August 7 misses it, September 4 catches it), but the number of days between the trade and the event is different than assumed.
- OPRA data cannot tell us who did this trade. No broker, no customer identity, no order ID. We don't know if this was a hedge fund, a market maker adjusting inventory, or a single large individual account. We also can't see any offsetting stock or futures hedge that may exist off-exchange.
- GAAP profitability just went negative (Q3 FY26 net loss of $177M) even as revenue hit a record, and FY27 EPS growth is guided to a much slower pace (+9.3%) than revenue (+20.9%) — largely due to CyberArk-related share dilution (StockAnalysis forecast). A guide that confirms this deceleration, rather than beating it, is a real risk to a stock priced at 289x trailing earnings.
🎯 The Bottom Line
Here's the deal: a $1,046,960 net-debit call roll moved $390-strike PANW call exposure off a contract expiring this Friday and onto one that survives past the company's next earnings report — whichever of the two contested dates turns out to be correct. The near-dated leg was nearly worthless (12.7% OTM, four days left, $0.40), so this reads far more like "keep the bet alive across the print" than "collect a fat premium" or "make a fresh aggressive short." The package's net delta (+22,365 shares) is modestly bullish, not a full-conviction directional slam.
Own it: if you're already long PANW calls near this strike, this is a real-world example of extending duration across a binary event rather than letting time decay finish the job early.
Watching: the September 4 $390 strike is now a level worth tracking into earnings — but confirm the report date before assuming this trade "knows something" about timing.
Bearish: the average analyst target below spot and the negative GAAP print are the counterweight here — a stretched valuation with an unconfirmed earnings date is exactly the kind of setup where a roll can look smart or look expensive depending on one number in a press release nobody's seen yet.
Mark your calendar for tomorrow, ≈06:30 ET, when the OPRA open-interest snapshot tells us definitively whether the August leg closed or opened — we'll update this piece the moment it resolves.
This article is for informational purposes only and is not investment advice. Options trading involves substantial risk of loss and is not suitable for all investors. The open/close status of the August 7 leg is provisional pending next-day OI confirmation, and the earnings date referenced here is unconfirmed by the company's own investor-relations page as of publication.
Last updated: August 4, 2026 — next-day OPRA open-interest resolution added (✅ RESOLVED box above). Original analysis published August 3, 2026.