🎯 PLTR: $13M Bull Call Spread Bought The Day AFTER The 27% Earnings Pop
📅 2026-08-04 | 🔥 Unusual Activity Detected
🎯 The Quick Take
Palantir reported Q2 2026 after the close on Monday, August 3 — and the stock is up 27% today. That timing matters more than anything else on this trade: at 10:41:06 ET, one desk bought 12,000 March-19-2027 $165 calls and simultaneously sold 12,000 March-19-2027 $200 calls as a single negotiated package on the exchange floor, for a net debit of $12,960,000. This is not a bet placed ahead of an unknown earnings outcome — it's money going in the day after the outcome is already known, into a stock that just re-rated 27% higher. Both legs are proven fresh opens, so this is a genuinely new position, not a roll or an unwind of something already on the books. The structure — buy a lower call, sell a higher call — is a bull call spread: bullish, but with a hard ceiling at $200, and it needs the stock up another 10.9% just to break even.
🏢 Company Overview
Palantir Technologies (NASDAQ: PLTR) builds data-analytics and AI software platforms — Foundry (commercial/enterprise data integration), Gotham (government/defense), AIP (its Artificial Intelligence Platform), and Apollo (deployment infrastructure). The company sits at the intersection of enterprise software and defense/intelligence technology, with a customer base split between U.S. government agencies and a rapidly growing commercial book. Market cap is ≈$382.56B post-pop. Sector: Technology — enterprise software / AI platforms.
💰 The Trade
⚙️ Mechanism — read this before the table
Both legs printed as a single package via a multi-leg floor trade — negotiated directly on the exchange floor between counterparties, not an electronic sweep lifting offers in the lit market. That's a mechanical fact about how it executed, not a signal about direction. Direction here doesn't need to be inferred from the tape's aggressor read — the structure itself is unambiguous: buy the $165 call, sell the $200 call, same package, same second, same expiration. That's a textbook bull call spread (long call vertical), full stop.
Full trade details — both legs
| Field | Leg 1 (BUY) | Leg 2 (SELL) |
|---|---|---|
| Time | 10:41:06 ET | 10:41:06 ET |
| Buy/Sell | BUY | SELL |
| Call/Put | CALL | CALL |
| Expiration | 2027-03-19 | 2027-03-19 |
| Strike | $165 | $200 |
| Option Price | $27.20 | $16.40 |
| Premium | $32,640,000 | $19,680,000 |
| Size / Volume | 12,000 | 12,000 |
| Prior OI | 942 | 2,570 |
| Spot (at print) | $158.54 | $158.54 |
| Delta (per leg) | 0.5729 | 0.4050 |
| Option Symbol | PLTR20270319C165 | PLTR20270319C200 |
| Flow tag | 🏛️ MULTI-LEG FLOOR TRADE (negotiated package, not a sweep) | same package |
Net debit: $12,960,000. Package delta: +201,480 shares — roughly $32M of upside exposure for every $1 the stock moves, funded with $12.96M of real capital at risk.
The economics, spelled out
- Max value at expiry (if PLTR ≥ $200 on March 19, 2027): ($200 − $165) × 12,000 × 100 = $42,000,000
- Cost to put the spread on: $12,960,000
- Max profit: $42.0M − $12.96M = $29,040,000 — a payoff of roughly 2.2:1 on the capital risked
- Breakeven: $175.80 — that's +10.9% above the $158.54 print-time spot
- Full payout needs the stock at $200 or higher — +26.2% from spot, by March 19, 2027
Why cap the upside at all? Buying the $165 call outright would have cost $27.20 (breakeven $192.20, +21.2% needed) and offered unlimited upside. By selling the $200 call against it, the desk collected $16.40 back, cutting breakeven all the way down to $175.80 — nearly 10 points closer, and roughly half the move required versus the naked call. The price of that cheaper, closer breakeven is giving away every dollar of gain above $200. That trade-off — cheaper entry and a nearer breakeven, in exchange for a hard ceiling — is the entire logic of a bull call spread, and it's a rational way to express "I think this goes higher, but I'm not paying full freight for unlimited upside I may never collect."
✅ RESOLVED — Both Legs Confirmed Open
Updated 2026-08-05 pre-market. The ≈06:30 ET OPRA snapshot (reflecting the August 4 close) has published, and both falsifiable predictions landed.
| Leg | Baseline OI (Aug-4 snap) | Resolving OI (Aug-5 snap) | Δ | Print size | Δ as % of print | Verdict |
|---|---|---|---|---|---|---|
| Mar-19-2027 $165 C (bought) | 942 | 12,326 | +11,384 | 12,000 | ≈94.9% | ✅ OPEN (BTO) — confirmed |
| Mar-19-2027 $200 C (sold) | 2,570 | 14,049 | +11,479 | 12,000 | ≈95.7% | ✅ OPEN (STO) — confirmed |
We predicted ≈12,900 and ≈14,600; the actual numbers are 12,326 and 14,049 — within a few hundred contracts on both legs. About 95% of each print created brand-new open interest, so this was overwhelmingly fresh positioning rather than size absorbed by existing holders. The bull call spread is confirmed as a brand-new structure on both sides.
🤓 What This Actually Means — Plain English
BTO and STO, in one package. The $165 call leg is a BTO — bought to open — a fresh long call, paying $27.20 per contract for the right to buy PLTR at $165 through March 2027. The $200 call leg is an STO — sold to open — a fresh short call, collecting $16.40 per contract in exchange for giving up any stock appreciation above $200 (if PLTR is above $200 at expiry, this leg gets exercised against them and caps their profit on the whole package). Put together, BTO-lower-strike plus STO-higher-strike, same expiration, is the standard definition of a bull call spread (also called a long call vertical or debit call spread).
Why do this instead of just buying the call? Two reasons. First, cost: $12.96M net versus $32.64M for the outright long call — less than half the capital at risk for a directional bet. Second, breakeven: $175.80 versus $192.20 for the naked call — a meaningfully closer target. The cost of both benefits is capping the payoff at $200; anything the stock does above that level is money left on the table that the spread doesn't collect. This is a structure for someone who is bullish but wants to control cost and doesn't need to capture every last dollar of an open-ended rally — not someone betting on a moonshot.
What this is NOT: it is not a roll (both legs are new positions, not a close-and-reopen of something already held), and it is not a premium-collection trade for the seller of the package as a whole — the net cash flow is a $12.96M debit, meaning this desk paid money to put the position on. The short $200 call only funds part of the cost; it doesn't turn this into an income trade.
📈 Technical Setup
YTD Chart
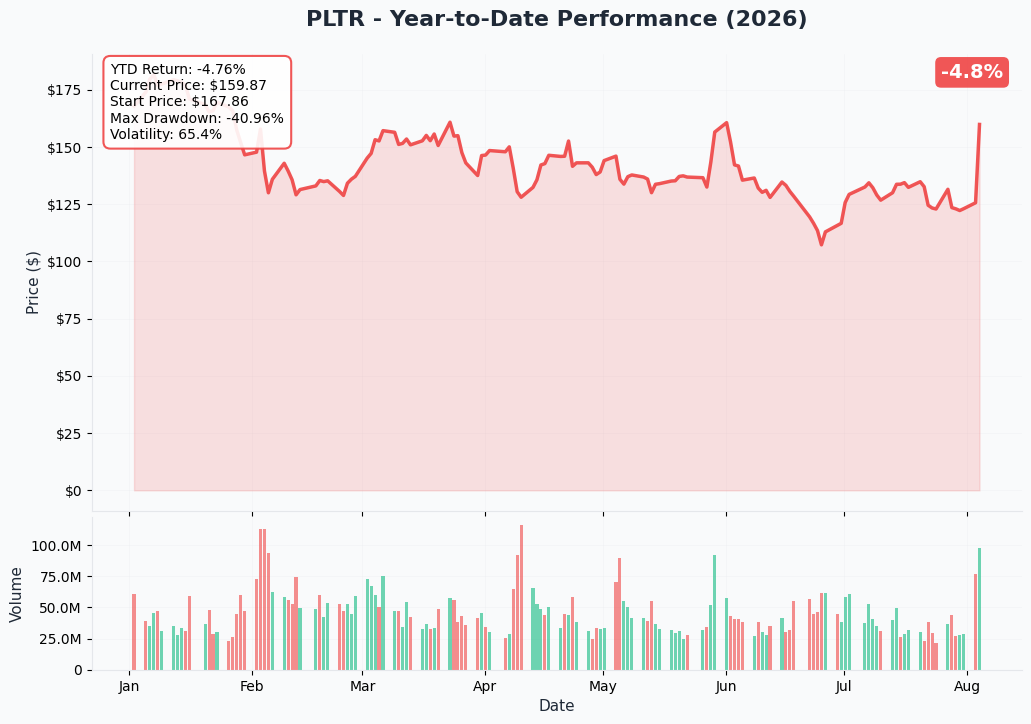
The 1-year chart shows PLTR down ≈4.8% over the trailing year — a very different number from the ≈+3.57% 52-week statistics-page figure and the pre-print −29.3% YTD read, and the gap is simply a function of which exact days each measurement anchors to around a stock that has swung from $106 to $207 and back multiple times this year. All three numbers agree on the underlying story, whichever one you use: this is a stock that has round-tripped violently, not one quietly compounding to new highs. Even after today's +27% pop, PLTR sits ≈23% below its 52-week high of $207.52.
Gamma-Based Support & Resistance
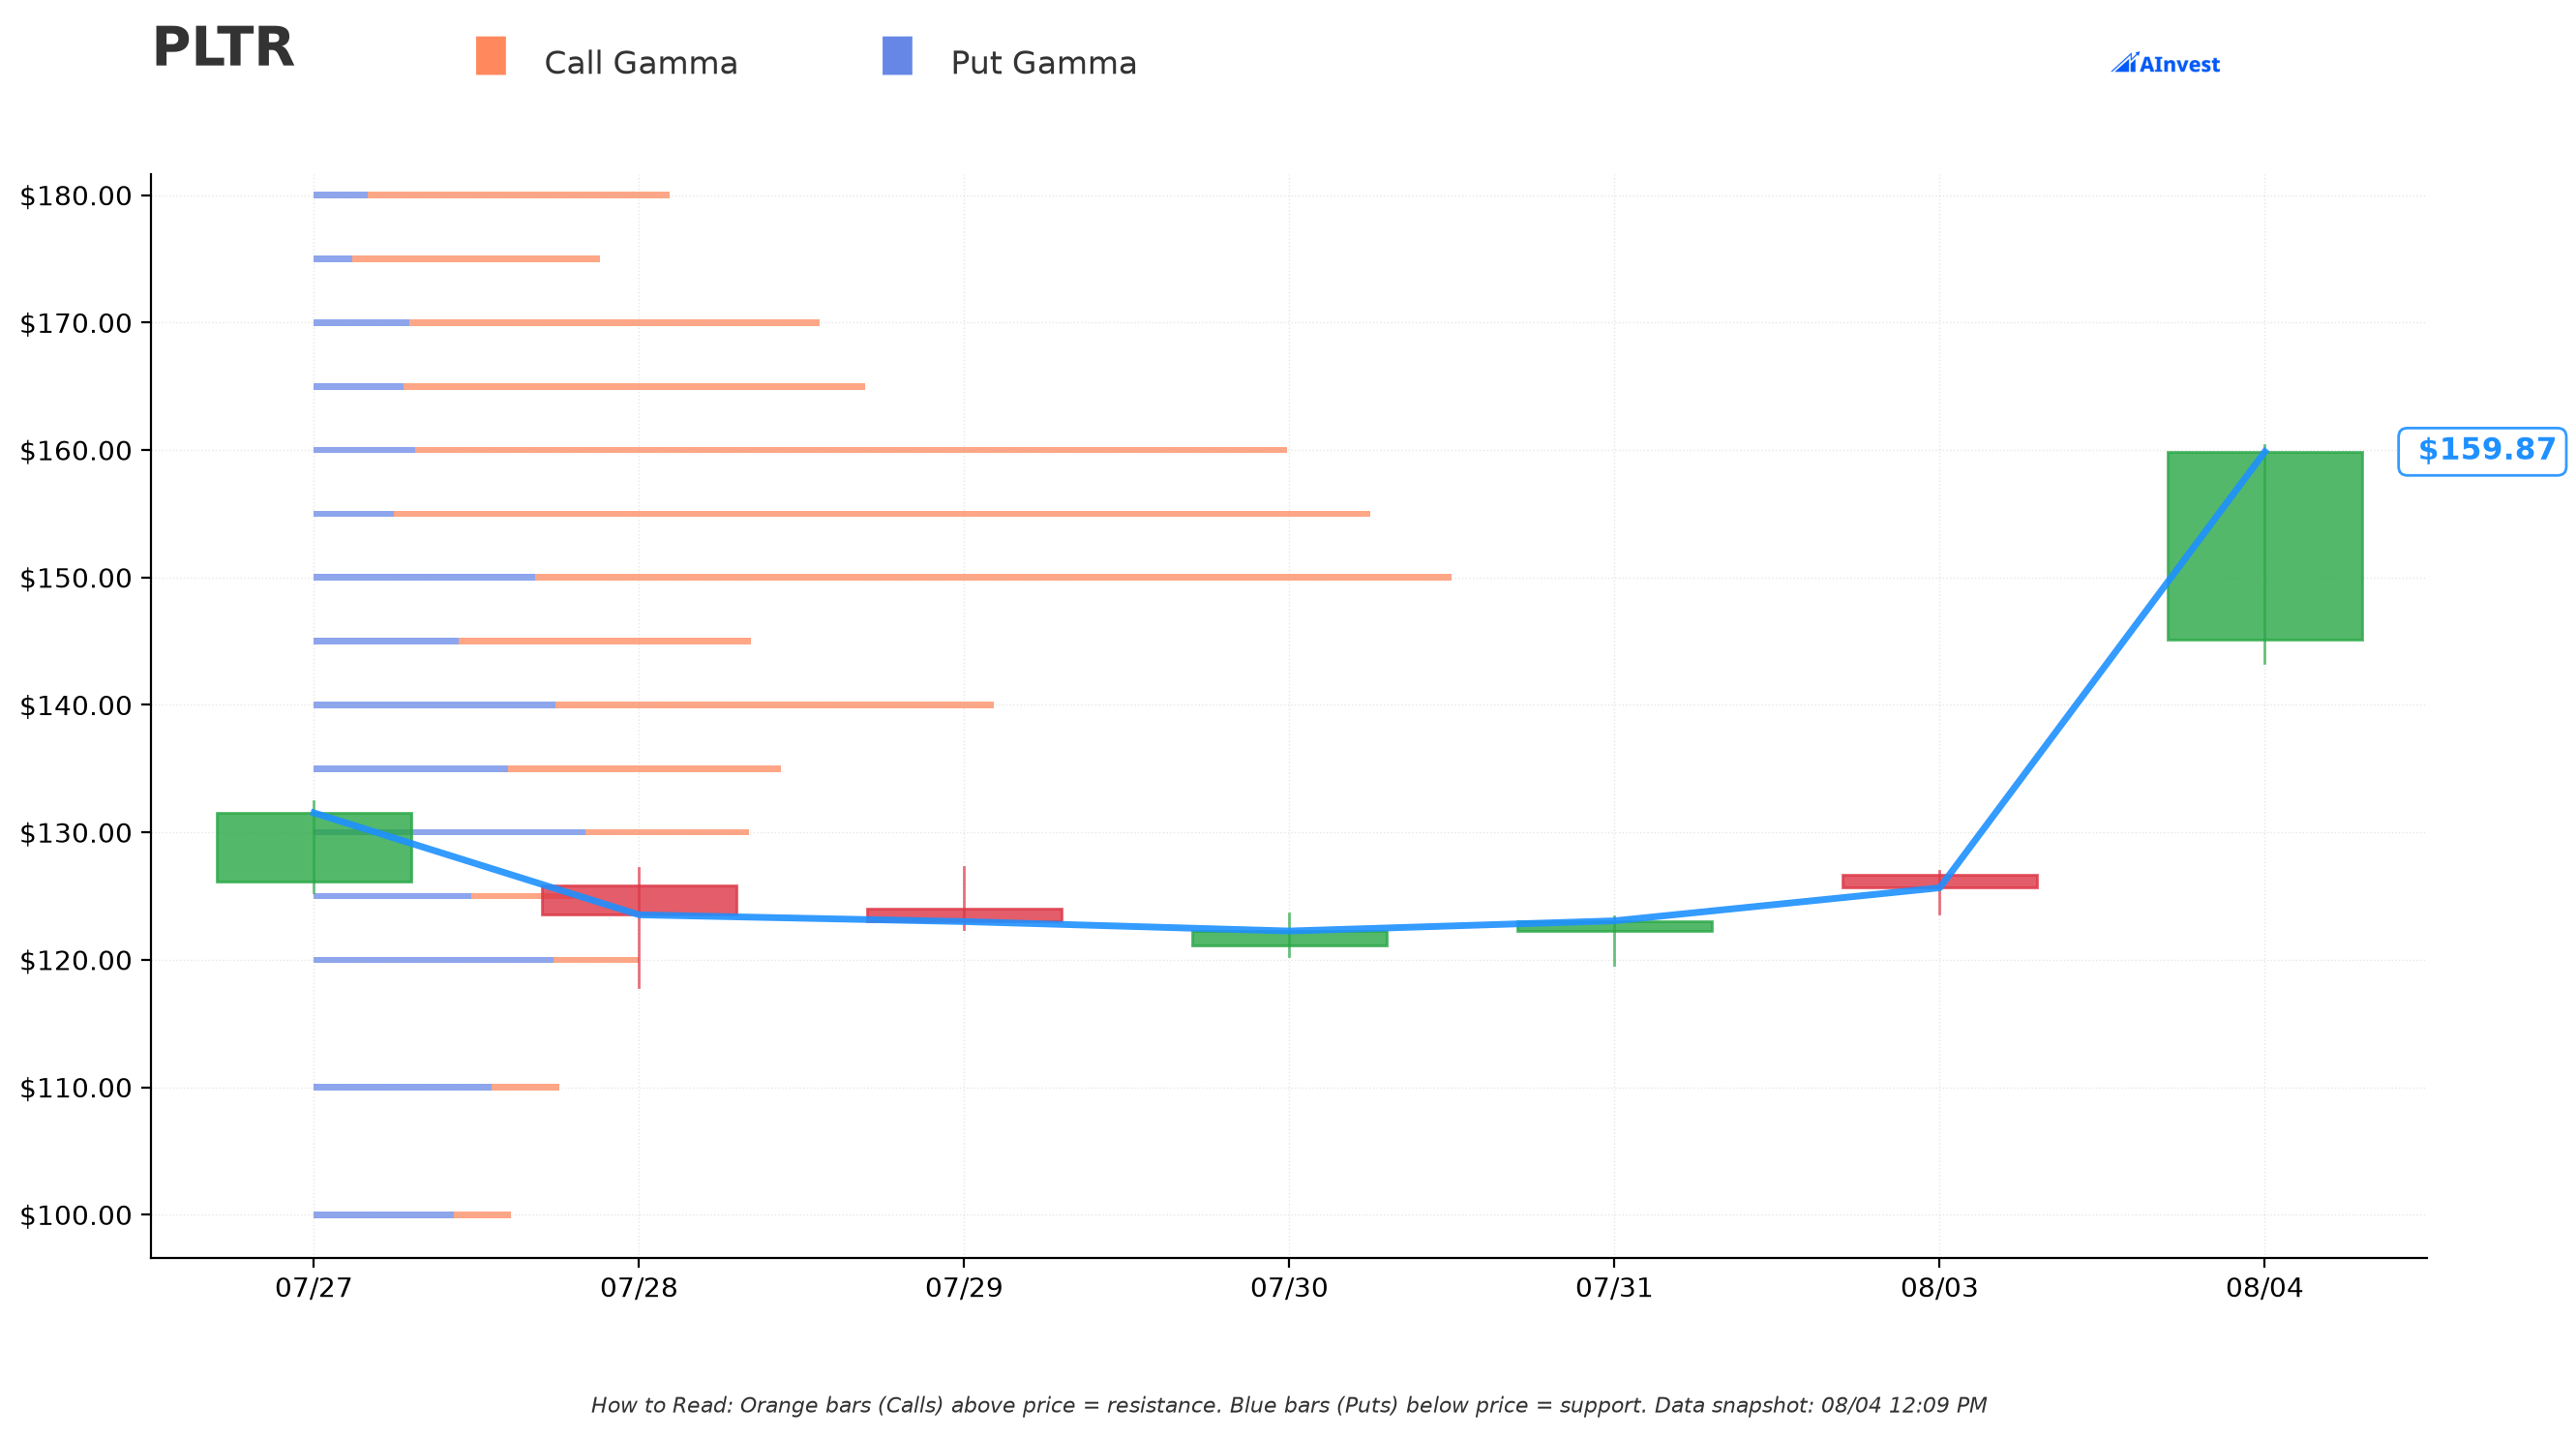
Reference spot for this map: $159.96.
- $160 — the single strongest level on the board, essentially at spot (≈$23.4M total gamma, ≈$18.5M net, call-dominated ≈$21.0M call vs. ≈$2.5M put). Dealer hedging flows are concentrated right where the stock trades right now.
- $165 — a Very Strong resistance wall (≈$13.3M total gamma, ≈$9.0M net, call-heavy ≈$11.1M vs. ≈$2.2M put), only ≈3.2% above spot. This is exactly the strike the desk bought today. The long leg of this spread sits directly on a real dealer gamma wall, not in some quiet, thin corner of the chain.
- $200 — also a defined resistance wall (≈$9.0M total gamma, ≈$8.2M call vs. ≈$0.7M put), ≈25% above spot. This is exactly the strike the desk sold. Both ends of the spread line up with real, measurable open-interest concentration — this wasn't picked at random.
- Support below: $155 (Very Strong, ≈$25.5M total / ≈$21.6M net gamma, ≈3.1% below spot) and $150 (Very Strong, ≈$27.5M total / ≈$16.8M net, ≈6.2% below). If the post-earnings pop fades, these are the levels dealer hedging is likely to slow the decline around.
Implied Move
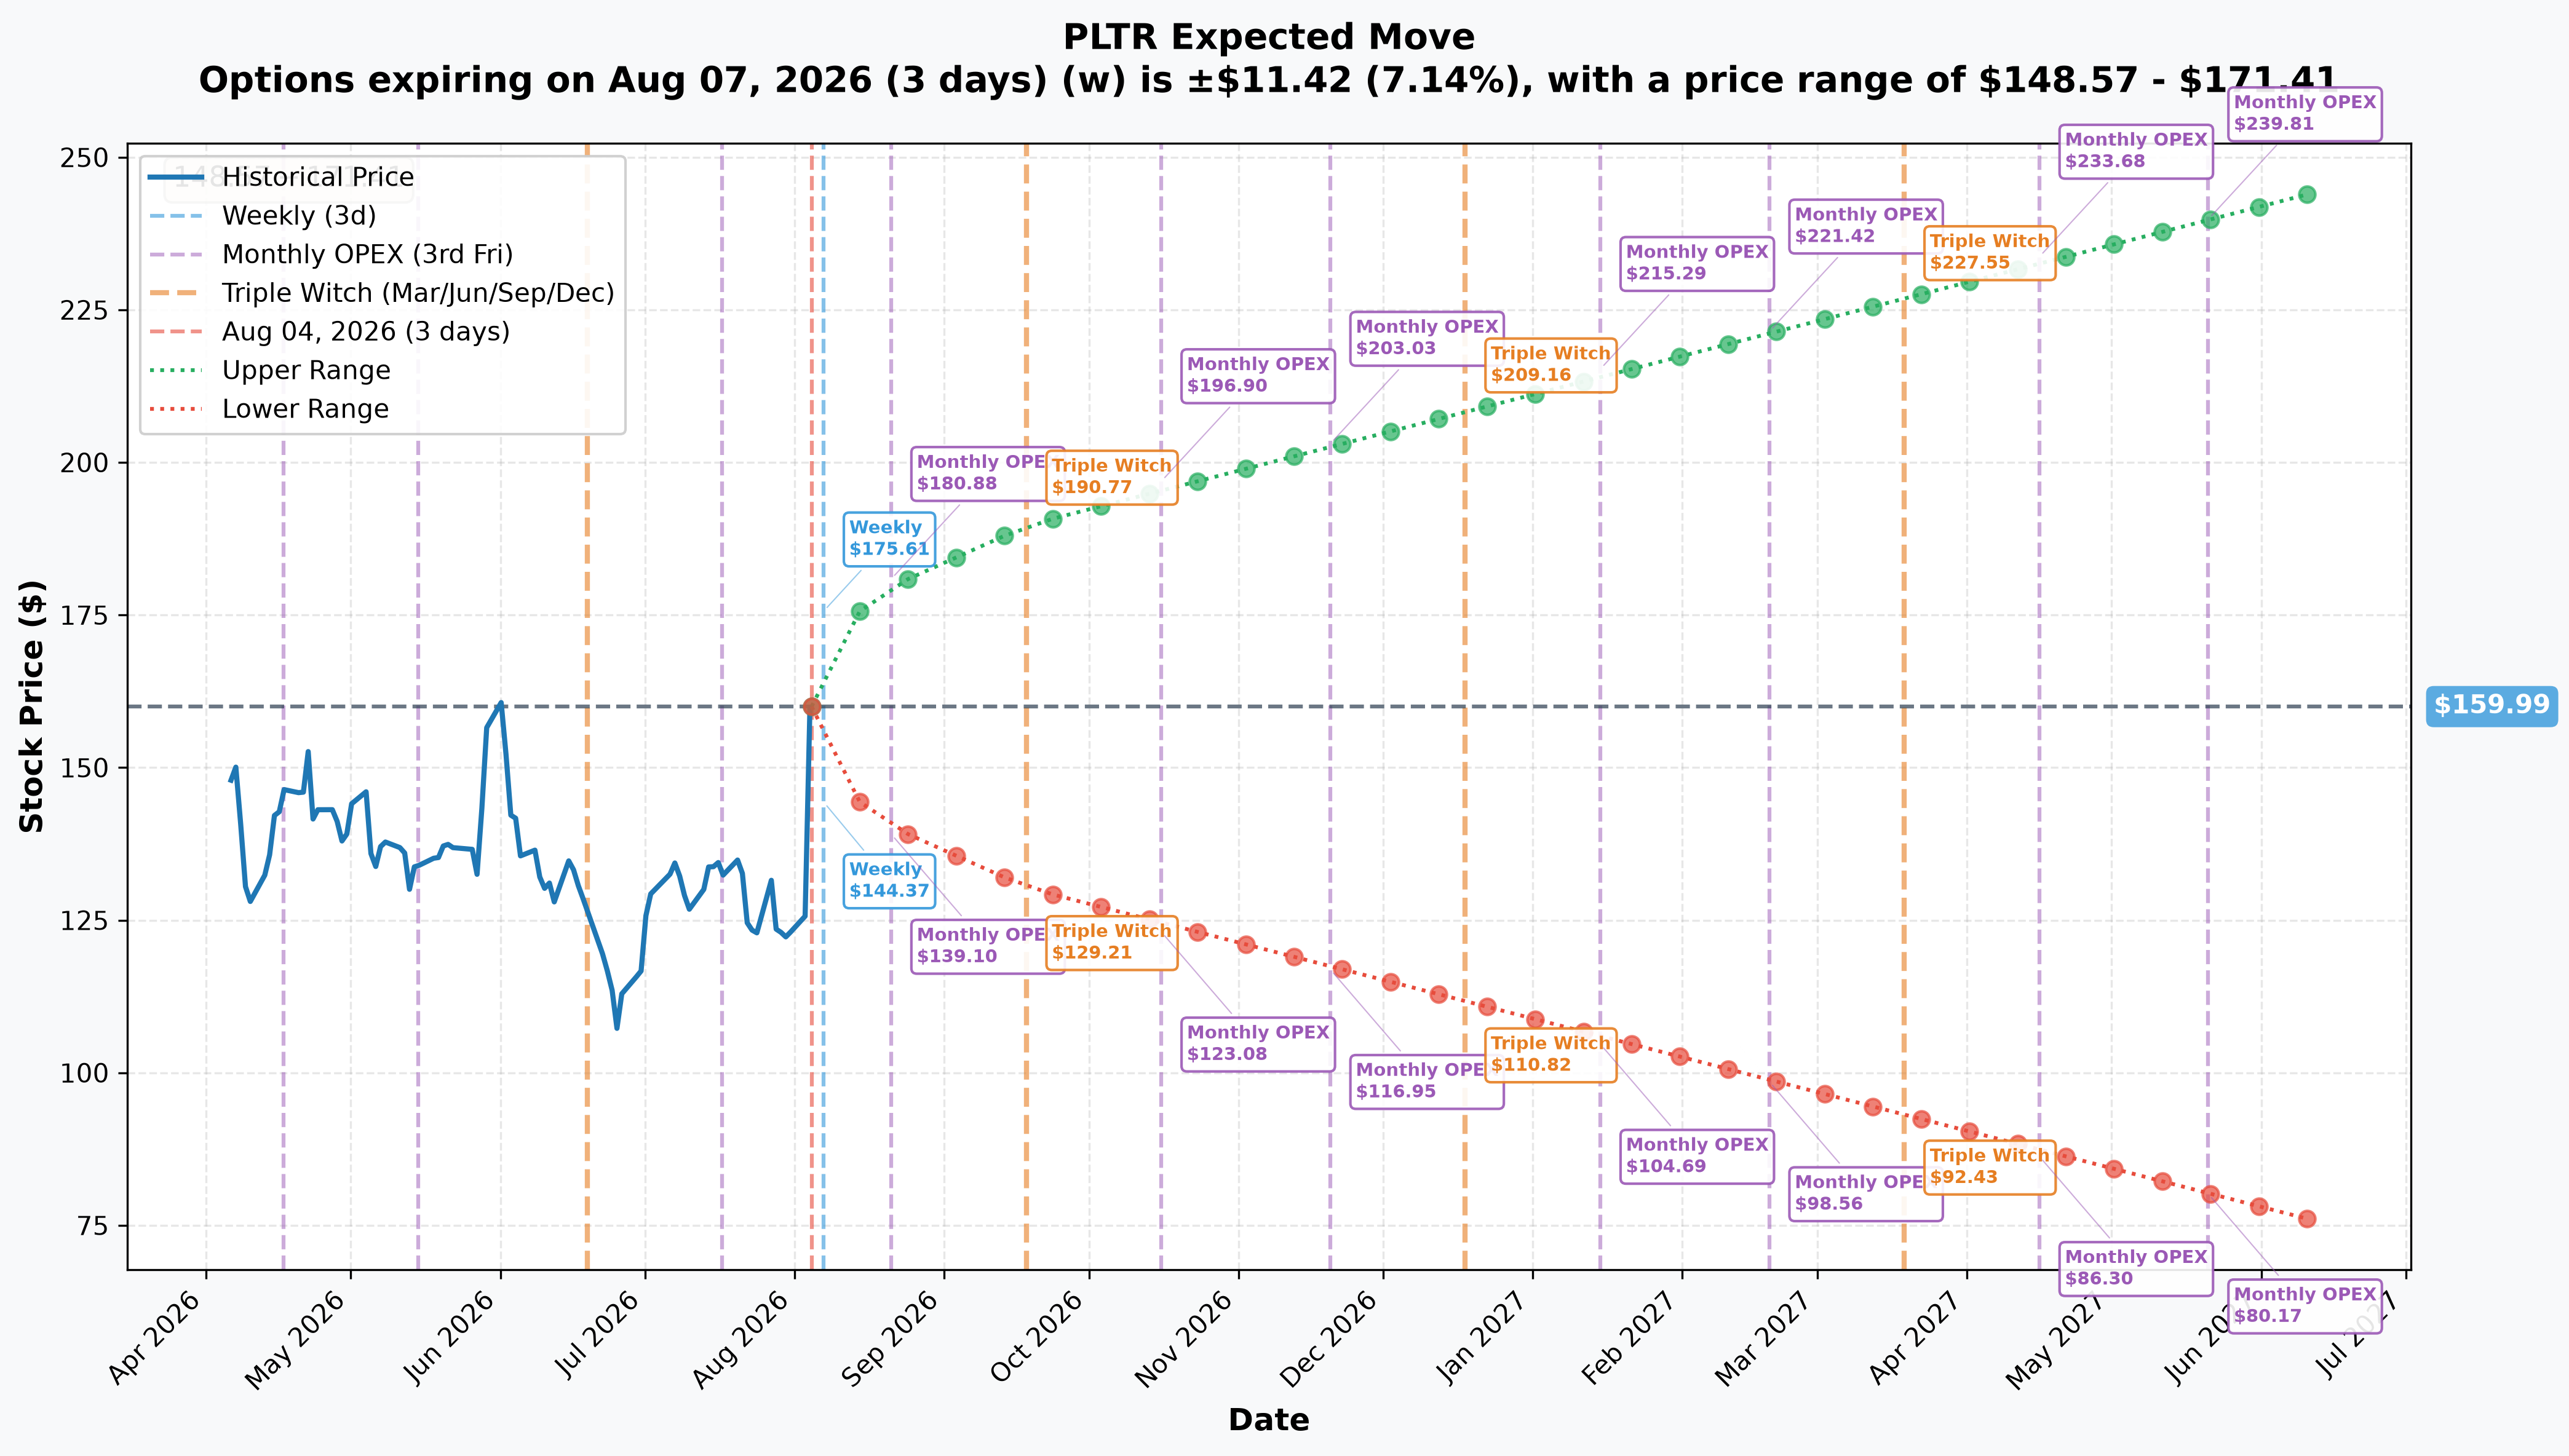
| Expiry | Days to expiry | Implied move | Range |
|---|---|---|---|
| Weekly (2026-08-07) | 3 | ≈7.14% (≈$11.42) | $148.57 – $171.41 |
| Monthly OPEX (2026-08-21) | 17 | ≈12.39% (≈$19.83) | $140.16 – $179.82 |
| Quarterly / Triple Witch (2026-09-18) | 45 | ≈18.60% (≈$29.76) | $130.23 – $189.75 |
| Yearly LEAPS (2027-06-17) | 317 | ≈53.34% (≈$85.34) | $74.65 – $245.33 |
The trade's actual expiration — March 19, 2027 — is itself labeled a Triple Witch date on the chart, with a one-year-plus implied range of $92.43 – $227.55. That range comfortably brackets both strikes in this spread ($165 and $200): the options market's own pricing says neither leg is a tail bet, which is a useful sanity check on a position sized in the tens of millions of dollars.
⚡ Catalysts
🟠 Already fired — the dominant one
- August 3, 2026, after the close — Q2 2026 results. EPS $0.41 vs. $0.34 consensus (+20.6% surprise); revenue $1.94B vs. $1.81B (+7.2% surprise), +93% year over year. U.S. commercial revenue $764M, +149% YoY. GAAP net income $1.06B, a 55% margin. Rule of 40 came in at 155% — StockTitan, Investing.com earnings history.
- FY2026 guidance raised to $8.150–$8.158B revenue, U.S. commercial revenue guided above $3.424B, Q3 guided at $2.2B vs. a $2.0B prior consensus — StockTitan, MarketBeat earnings.
- The most actionable, least obvious follow-on: sell-side consensus has not caught up. FY2026 consensus revenue still shows ≈$7.72B on at least one major estimates page — StockAnalysis forecast — against company guidance of ≈$8.15B, a gap of roughly $430M, or 5.6%. That's a mechanical, near-term catalyst: analyst models plausibly get revised upward over the next one to two weeks as coverage catches up to the new guide. This is an inference from the size of the gap, not a confirmed event — there's no guarantee the timing lines up cleanly.
🔵 Structural, ongoing
- U.S. Army NGC2 program — Palantir secured the cloud data-layer role for the Army's Next Generation Command and Control program, built on Foundry alongside Anduril's Lattice — StockTitan. No contract dollar value has been disclosed in any sourced release; treat this as a structural, program-of-record relationship rather than a dated dollar catalyst. It is plausibly connected to the +90% YoY U.S. government revenue growth printed in Q2.
- Commercial land-grab, June–July 2026: four separate AIP/Foundry partnership announcements in roughly three weeks (Oligo Security/FedStart, Zeta Global, NVIDIA Nemotron, Surf Air Mobility) plus a first Latin American commercial customer (GNP Seguros, Mexico) — StockTitan. The $2.13B record U.S. commercial total contract value booked in Q2 is the financial receipt for this — TCV leads revenue by roughly two to four quarters.
🟡 The re-rating cascade — and the honest split in it
Analyst targets moved hard in both directions after the print. RBC reiterated Underperform with a $90 target on July 31 — roughly 44% below today's spot — MarketBeat price target. Cantor Fitzgerald raised its target to $156 on August 4 — but that "raise" still lands below the $158.54 print-time spot, which tells you how conservative even the bullish revision is — MarketBeat. On the other side, Mizuho moved to $215, UBS to $220, Truist to $223, and Bank of America maintained the Street-high $255 — StockAnalysis forecast, Investing.com. Across the full analyst panel, 13 of 35 are Hold or Sell — MarketBeat. The average target of ≈$187 is only ≈17% above spot, while the low is $80 — a spread wide enough that consensus itself doesn't agree on the sign of the next big move, let alone the size.
⚪ Next scheduled catalyst — inside this trade's window, but not confirmed
- Q3 2026 earnings: ESTIMATED November 9, 2026 — not company-confirmed. Investing.com's forward calendar lists the date without a confirmation stamp; MarketBeat shows no confirmed forward date at all, only "last reported August 3, 2026." Historical anchor: Q3 2025 was reported November 3, 2025. This estimated print — and the one after it, roughly February 2027 — both fall inside the March-19-2027 expiration on this spread, meaning at least one or two more binary earnings events sit between now and settlement.
- No index-inclusion, share-lockup, or rebalancing catalyst was found in a targeted news scan — treat that as genuinely absent from the current calendar, not as a pending, unreported item.
👥 Four-Reader Interpretation
🎲 YOLO trader: This spread needs PLTR at $200 or higher — +26.2% from spot, by March 2027 — to pay out its full $29.04M. That's a real move, not a gimme, on a stock that just gapped 27% in one session. If you're chasing this kind of structure, understand you're capped: no matter how far past $200 the stock runs, this specific position stops collecting. A naked long call captures all of that; this doesn't.
📊 Swing trader: The gamma map is the more tradable read for a shorter horizon. $160 is the strongest level on the board, sitting right at spot — expect chop and dealer-driven mean reversion around it near term. $165 and $200 are both real resistance walls — notably, the exact two strikes in today's spread — while $155 and $150 are the nearest support shelves below. The ≈12.4% monthly-OPEX implied move (range $140–$180) is a tighter, more actionable window than the March 2027 expiry most retail traders will ever actually hold to.
💰 Premium collector: The mechanics here are instructive even if you wouldn't run this exact trade. Selling the $200 call funded roughly half the cost of the $165 call — that's the same logic behind covered calls and credit spreads: collect premium against a directional view to lower your breakeven, in exchange for capping the top end. If you're inclined to sell calls against PLTR strength here, the fact that $200 is a real gamma wall (not just a round number) is a legitimate reason to like that strike as a cap.
🌱 Beginner: A bull call spread is buying one call and selling a second call at a higher strike, same expiration. You pay less than you would for the call alone (here, $12.96M instead of $32.64M), and your breakeven is closer (here, $175.80 instead of $192.20) — but your maximum gain is fixed the moment you put the trade on ($29.04M here, no matter how high the stock goes). It's a way to express "I think this goes up" without paying for unlimited upside you might never actually capture. The trade-off — cheaper and closer, but capped — is the whole point of the structure, not a flaw in it.
⚠️ Honest Risk & Limits
- This position was opened after a 27% single-day move, not before it. The binary risk of the earnings outcome is already resolved; what's left is a bet on continuation of the re-rating, valuation debate, and whatever happens at the next (still-unconfirmed) earnings print inside the holding period. Buying calls the day after a huge gap means paying a price that already reflects the good news.
- The spread needs +10.9% just to break even, and +26.2% to reach max profit — both meaningful moves on a stock already up 27% today. This is not a small-odds, high-payout lottery ticket; it's a real directional bet with real capital ($12.96M) at risk.
- Upside is hard-capped at $200. If PLTR runs well past $200 by March 2027 — plausible given the Street-high target of $255 — this specific position stops benefiting from further gains. Whoever holds it gave that up deliberately in exchange for a lower cost and closer breakeven.
- The valuation debate is real and unresolved. Trailing P/E is cited anywhere from ≈136.6 to ≈179.6 depending on source and methodology; forward P/S sits around 40x. RBC's $90 target and 13-of-35 Hold/Sell ratings are not a fringe view — they represent a substantial slice of professional coverage that thinks this stock is overvalued even after accounting for the growth.
- No short-squeeze cushion exists to backstop this position. Short interest is only ≈3.6–3.7% of float with less than two days to cover — if sentiment sours, there's no forced-buying floor beneath the stock.
- The tape cannot tell us who put this trade on, why, or what else they hold. We don't know if this is outright speculation, a partial hedge against a larger short position, an institutional overwrite adjustment, or something else entirely. We also cannot see prior-quarter earnings-day price reactions for PLTR — that data was not obtainable from any source checked for this piece, so we can't say how this stock has historically behaved in the weeks after a big earnings gap.
- Next earnings is estimated, not confirmed, and falls inside this spread's life. If the November 9, 2026 date (or whatever the actual date turns out to be) disappoints, this position faces a second binary event before expiration.
- Options trading involves substantial risk of loss and is not suitable for all investors. Nothing in this piece is a recommendation to buy or sell any position — it is a forensic read of what printed on the tape today, the arithmetic behind it, and the catalysts and risks surrounding the stock.
Resolved 2026-08-05 pre-market: the $165 call's open interest moved to 12,326 and the $200 call's to 14,049 — against predictions of ≈12,900 and ≈14,600. Both legs opened as fresh positions, ≈95% net-new. See the ✅ RESOLVED box above.
Last updated: 2026-08-05 — next-day OPRA open-interest resolution added: both legs confirmed OPEN — ≈95% net-new on each.