🚢 RCL $6M Bearish-Lean Put Buy — Right After the Beat-and-Raise, Someone Bought Downside on Royal Caribbean
📅 July 28, 2026 | 🔥 Unusual Activity Detected
🎯 The Quick Take
✅ Update (July 29, 2026): next-day open interest confirmed this as a fresh open (BTO) — OI at the $280 strike rose 267 → 10,863 (+10,596). The confirmation also revealed that this article covered only part of the day's activity: a separate 7,500-contract multi-leg floor trade hit the same strike earlier in the session, and together the two prints opened ≈99% of the strike's 10,769-contract volume. The provisional ⏳ flag is resolved. See the ✅ RESOLVED box.
Hours after Royal Caribbean beat Q2 earnings and raised its full-year profit guide, a desk bought 3,218 December 18, 2026 $280 puts for ≈$18.54 each — ≈$6.0 million total — with no offsetting stock trade on the tape. The catch: buried inside the good headline numbers, management also cut the full-year revenue-growth target and guided Q3 net yields flat, citing softening demand on select sailings. That's the exact crack a put buyer would want to press, and this one is unhedged, meaning it reads as a standalone directional bet rather than portfolio insurance. 👀
📊 Company Overview
Royal Caribbean Cruises Ltd. (RCL) is the world's second-largest cruise operator, running five brands — Royal Caribbean International, Celebrity Cruises, and Silversea, plus its TUI Cruises / Hapag-Lloyd Cruises German joint venture. The company operates a fleet of ≈70 ships and private destinations (Perfect Day at CocoCay, the new Royal Beach Club Paradise Island), and carried ≈2.4 million guests in Q2 2026 alone.
- Sector / Industry: Consumer Discretionary → Travel & Leisure → Cruise Lines
- Market Cap: ≈$78.7–79.1B
- 52-week range: $232.10 – $366.50
- YTD 2026: ≈+1% — essentially flat despite today's earnings beat
💰 The Option Flow Breakdown
📊 What Just Happened
The Tape (July 28, 2026 @ 14:28:12 ET):
| Time | Buy/Sell | Call/Put | Expiration | Premium | Strike | Volume | Prior OI | Size | Spot | Option Price | Option Symbol |
|---|---|---|---|---|---|---|---|---|---|---|---|
| 14:28:12 | BUY | PUT | 2026-12-18 | ≈$6.0M | $280 | 11,000 | 267 | 3,218 | $321.67 | $18.54 | RCL20261218P280 |
🎯 Flow tag: facilitated auction put buy, unhedged. This traded through an exchange's price-improvement auction — a worked order, not a negotiated block cross and not a lit sweep — and filled 94% of the way from the bid toward the ask, meaning the buyer paid up rather than waiting for a better price. We checked the equity tape around the print for a paired stock trade (the kind a hedger uses to offset directional risk) — the surrounding window only shows ≈19,300 shares of ordinary volume, nothing close to a dedicated hedge block. No visible stock offset = this reads as a directional-lean bearish bet, not a delta-hedged package.
⚠️ A quick price note before we go further: the trade-desk spot tagged to this print was $321.67, but Royal Caribbean reported Q2 earnings this morning (July 28) and, after closing $299.26 on July 27, rose ≈3.9% to trade around $299–305 intraday today. At the real ≈$305 tape, the $280 strike is only ≈8% out of the money — closer to the money than the $321.67 reference implies (which would put it ≈13% OTM). Either way, this is not a far-out-of-the-money lottery ticket; it's a fairly efficient way to buy real downside.
✅ RESOLVED — Open Confirmed, and It Was Part of Something Bigger (updated July 29, 2026)
The July 29 pre-market OPRA snapshot is in — and it came in far above our prediction, for an instructive reason.
Resolved from the OPRA open-interest snapshot for EOD July 28, 2026. This box replaces the ⏳ provisional flag published on July 28.
| Leg | Baseline OI (Jul 28 snap) | Resolving OI (Jul 29 snap) | Δ | Print Size | Verdict |
|---|---|---|---|---|---|
| Dec-18-2026 $280 PUT | 267 | 10,863 | +10,596 | 3,218 (strike's full session volume 10,769) | ✅ OPEN CONFIRMED (BTO) — and part of a ≈10,700-contract build |
What this proves, first: our print opened. We predicted open interest would rise "from 267 toward ≈3,485," with a rise meaningfully below 3,218 signalling a partial transfer. Open interest rose by 10,596 — comfortably more than our print, so there is no transfer question at all. The BTO label is confirmed.
And here is what the number revealed that the July 28 article did not cover. We wrote about one trade: the 3,218-contract facilitated auction at 14:28. But the strike's total session volume was 10,769 contracts, because a second, larger print — 7,500 contracts as a multi-leg floor trade at 11:27:38 ET — had already gone through nearly three hours earlier. Add them up: 3,218 + 7,500 = 10,718, against an open-interest rise of 10,596. That is a ≈99% match, which means essentially both prints opened new contracts, with almost nothing transferring.
What that changes, concretely:
- The day's real position at this strike is ≈3.3× the size we reported. Roughly 10,600 new Dec-18 $280 puts were created on July 28, not ≈3,200. Open interest at the strike went from a nearly-empty 267 to 10,863 — a ≈40× increase in a single session.
- Our ≈$6.0M figure covers one slice. It remains the correct premium for the 3,218-lot auction this article analyses. The strike-wide commitment on July 28 was substantially larger.
- The 7,500-lot print is a different animal, and we are not claiming it says the same thing. It printed as a multi-leg floor trade, meaning it was manually negotiated on an exchange floor as part of a multi-leg structure — so at least one other option leg exists that we have not analysed. A leg inside a spread can be bullish, bearish, or directionally neutral depending on what it is paired with. We deliberately do not fold it into this article's bearish-lean read; the two prints share a strike, not necessarily a thesis.
- What is fair to say: demand to open Dec-18 $280 puts on July 28 was real, broad, and roughly triple what a single-print view suggested — and it materialised on the day RCL beat, raised EPS guidance, and trimmed its revenue-growth target.
🤓 What This Actually Means — Plain English
- 💵 What they paid: $18.54 per contract × 3,218 contracts × 100 shares = ≈$6.0 million in total premium — all at risk if RCL doesn't fall far enough by December 18.
- 📉 Buying a put = betting the stock goes down (or that downside fear/volatility spikes). The independent option-pricing delta here is ≈−0.256, meaning this position currently behaves like being short ≈82,400 shares of RCL (3,218 × 100 × 0.256) — a meaningful synthetic short, not a token hedge.
- 🚫 Not a portfolio hedge in the classic sense — no stock leg found. When someone wants to protect a long stock position, they typically buy puts against shares they already own. We can't see what's happening off-tape, but there's no on-tape stock trade making this look like a delta-neutral insurance package. Taken at face value, it reads as a standalone directional bet that cruise stocks have more room to fall, though we can't fully rule out an unseen hedge on a large existing long.
- 🧩 The nuance that makes this trade coherent: a beat-and-raise headline with a crack underneath. RCL's Q2 adjusted EPS beat ($4.21 vs ≈$3.97 consensus) and full-year EPS guidance was raised — genuinely strong numbers. But in the same release, management cut the full-year revenue-growth target to ≈9% from ≈10% and guided Q3 net yields flat versus 2025, explicitly citing "softening demand for certain sailings" tied to geopolitical tensions. That's the first real dent in the "record cruise pricing" story, and it's exactly the kind of detail a put buyer would be pressing.
- 🗓️ Dec-18-2026 is the option's clock, not a catalyst by itself. The put's ≈5-month life comfortably spans RCL's next earnings report — Q3 2026, expected ≈late October — the single most likely trigger for this thesis to play out or fail, roughly 7 weeks before the put expires.
- 🎯 Breakeven math: at expiration, this put only turns a profit below $280 − $18.54 = ≈$261.46 — a further ≈14% decline from today's real ≈$305 tape (or ≈19% below the $321.67 print-time reference). Anything above that at expiry and the position loses value, up to the full $6.0M if RCL is at or above $280 on December 18.
📈 Technical Setup / Chart Check-Up
YTD Performance Chart
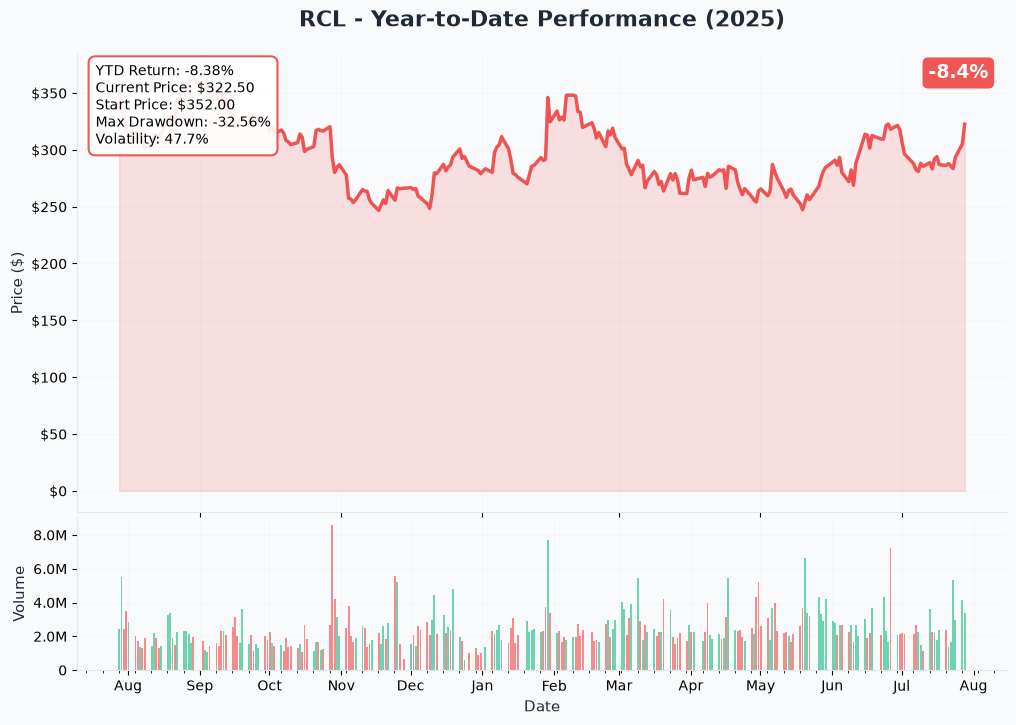
RCL's chart tells a "strong company, tired stock" story: shares are roughly flat on the year (≈+1%) and sit ≈17% below the 52-week high of $366.50 set earlier in the run, even after today's post-earnings pop toward ≈$305. The stock has spent the last several months digesting a huge multi-year advance rather than making fresh highs — the exact backdrop where a valuation-driven pullback thesis gets traction.
Gamma-Based Support & Resistance Analysis
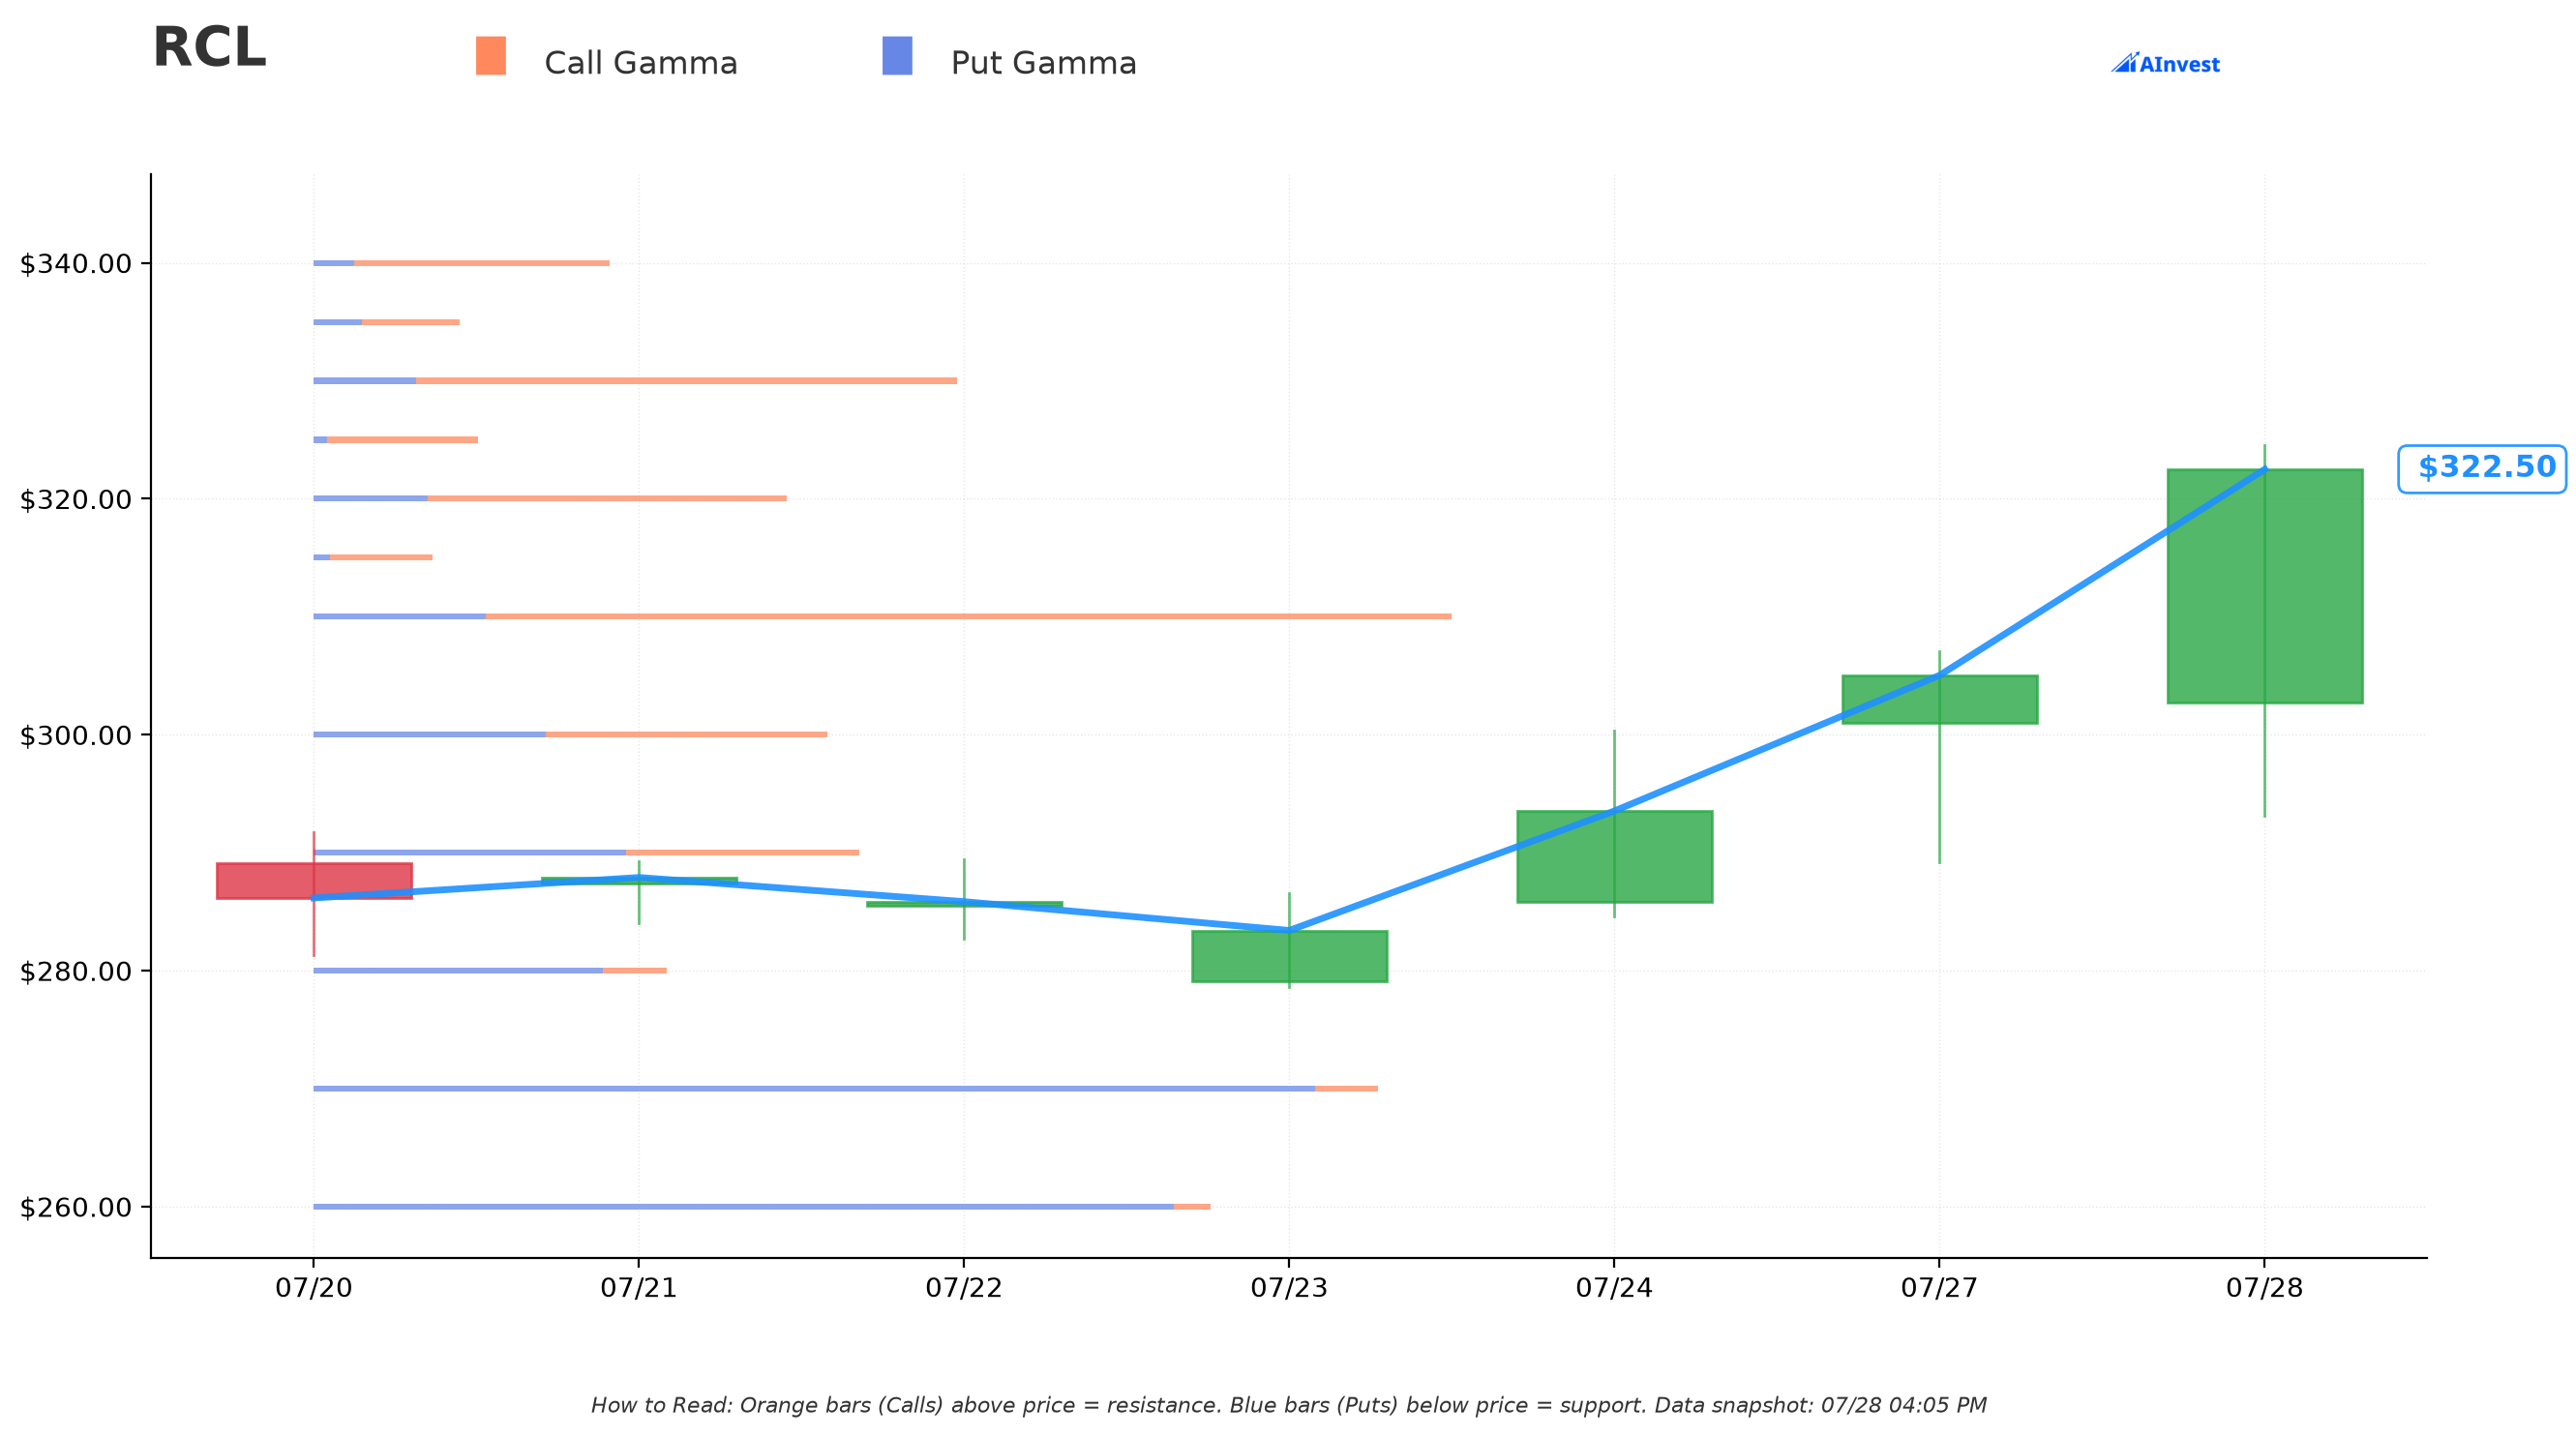
Reference price in the chart: ≈$322 (the gamma model's underlying snapshot — see the price note above for why the real tape is closer to ≈$305).
- 🟠 $325–$330 resistance zone — call-gamma builds noticeably here (net call-gamma tilts positive), just 1–2% above the chart's reference price. This is the nearest overhead lid dealers would be leaning against on any bounce.
- 🔵 $310 — heaviest total gamma just below the reference price (≈3.7% down) — the single largest options concentration on the board, a zone that tends to slow moves in either direction before a real breakdown or breakout.
- 🔵 $270 and $260 — the strongest true put-dominated support shelf, ≈16–19% below the reference price. This is where dealer hedging flows would lean most heavily bullish (buying stock) if RCL slides — the real technical floor, not just a round number.
- 🔵 $280 — our put's strike — sits in a moderate put-gamma pocket, ≈13% below the reference price. It's a real, but not the strongest, technical shelf; the bigger walls are $270 and $260 further down. That means if this bearish thesis plays out, the stock likely has to work through $280 before finding its heaviest support.
What this means for traders: the $280 strike isn't sitting on the market's strongest floor — it's in the middle of the gamma map. A clean break of the $310 zone would be the first real technical tell that this trade's thesis is gaining traction.
Implied Move Analysis
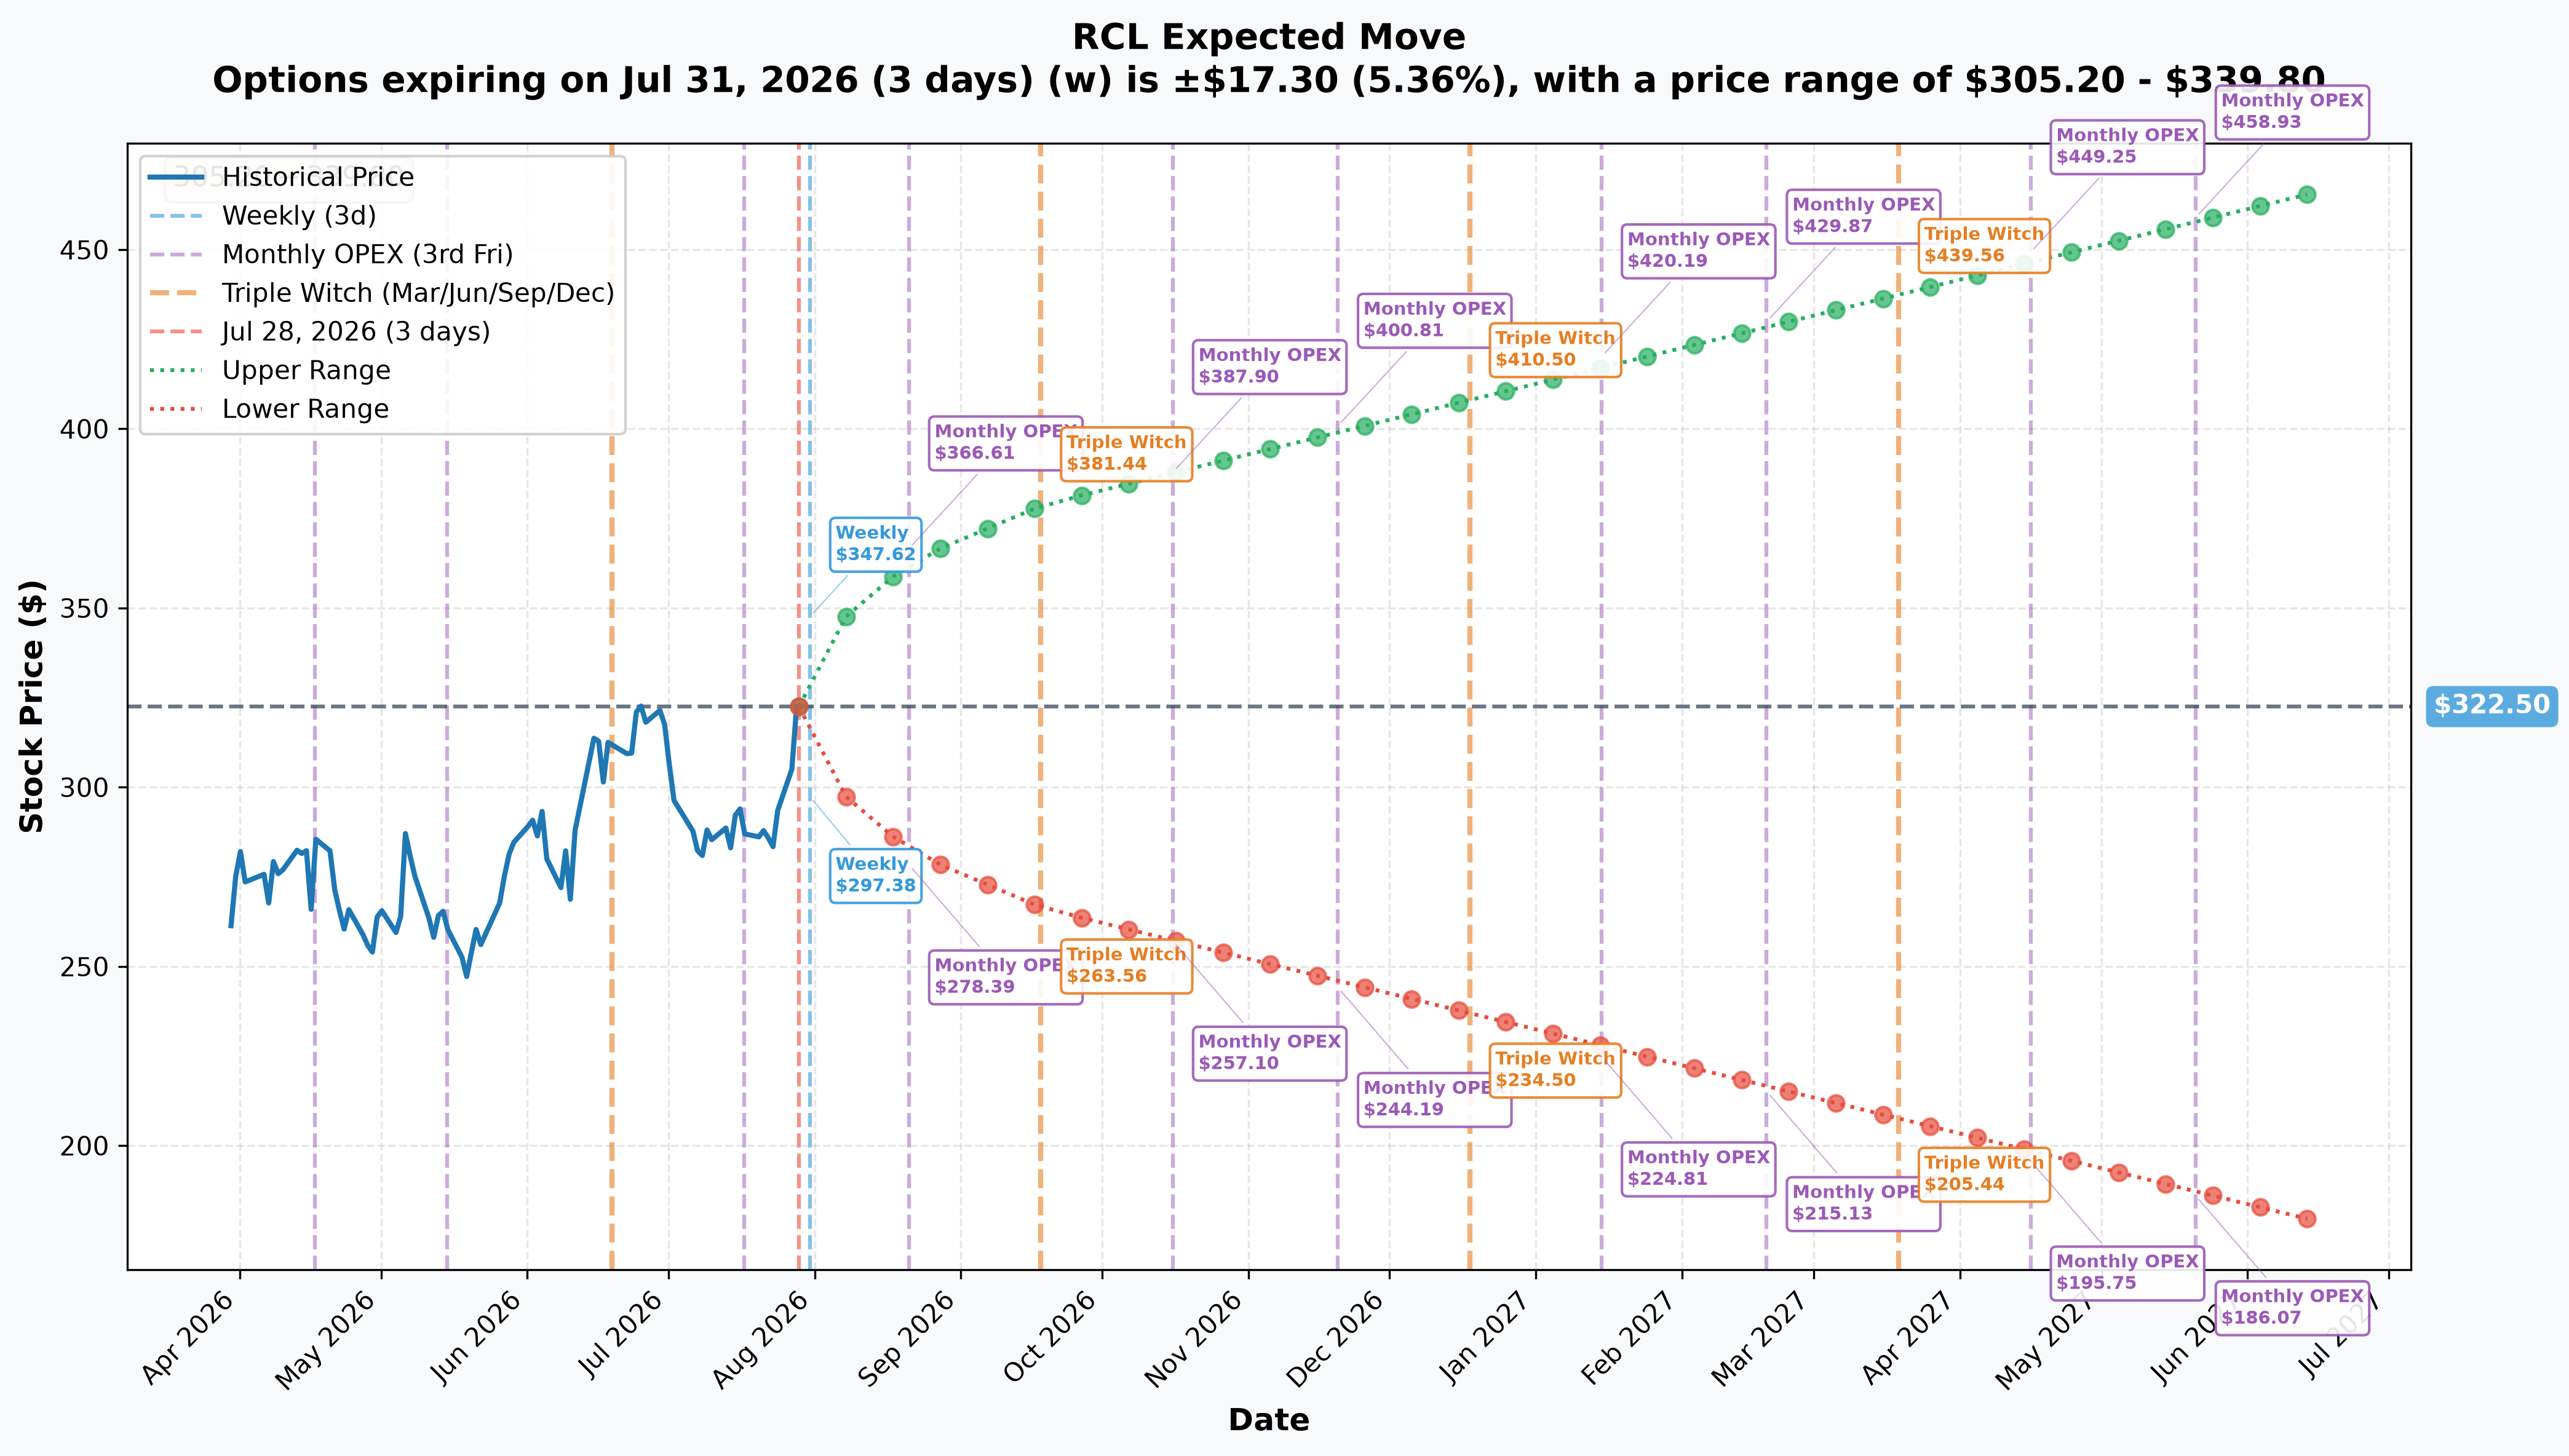
What the options market is pricing in (reference spot ≈$322.50 in the model):
- 📅 Weekly (July 31 — 3 days): ±5.36% (±$17.30) → range $305.20 – $339.80
- 📅 Monthly OPEX (August 21 — 24 days): ±12.64% (±$40.77) → range $281.73 – $363.27 — the $280 strike sits almost exactly on the monthly 1-sigma downside edge, meaning a normal-sized monthly swing already gets the stock roughly to this put's strike.
- 📅 Quarterly Triple Witch (September 18 — 52 days): ±17.48% (±$56.36) → range $266.14 – $378.86
- 📅 This trade's own expiration (December 18, 2026 — Triple Witch): implied range ≈$234.50 – $410.50
- 📅 Yearly LEAPS reference (June 2027 — 324 days): ±44.71% (±$144.18) → range $178.32 – $466.68
Translation for regular folks: the options market itself thinks RCL could reasonably swing to ≈$281.73 just by the August 21 monthly expiration — before Q3 earnings has even happened. Zoom out to this put's own December 18 range and the market's own pricing puts the plausible low end at ≈$234.50, well below both the $280 strike and the ≈$261.46 breakeven. In other words, the market's own volatility pricing already treats a move past this trade's breakeven as a realistic (not extreme-tail) outcome over the life of the position — which is part of why this reads as a genuine directional bet rather than a cheap lottery ticket.
🎪 Catalysts
🔥 Already Happened (Today and Recent)
- July 28, 2026 (this morning) — Q2 2026 earnings. Revenue $4.83B (+6% YoY), adjusted EPS $4.21 vs ≈$3.97 consensus (a ≈6% beat), 110% load factor, 2.4M passengers carried. Full-year adjusted EPS guidance raised to $17.73–$17.87 — but full-year revenue-growth guidance was cut to ≈9% from ≈10%, and Q3 net yields were guided flat vs 2025, with management citing "softening in demand for certain sailings" tied to geopolitical tensions (Quartz, RCL press release, Alphastreet). The stock rose ≈3.9% on the print (Quartz).
- Perfecta Program tracking ahead of plan. Management says it's tracking a ≈23% adjusted-EPS CAGR through the first two years of its 2024–2027 program, ahead of the 20% target (RCL Q2 press release).
- Analyst reaction: Consensus remains Buy, average 12-month price target ≈$337–356 (stockanalysis.com forecast). But Barclays cut its price target to $342 from $358 even as UBS raised its target to $301 from $271 (Barclays cut — TipRanks/TheFly, UBS raise — TipRanks/TheFly) — a split reaction that mirrors the beat-but-trimmed nature of the quarter.
🚨 Coming Up (dates, distinct from the Dec-18 option expiry)
- ⭐ Q3 2026 earnings — expected ≈late October 2026 (RCL has historically reported around Oct 27–29; not yet formally dated). This sits comfortably ≈7 weeks before the Dec-18-2026 put expiration, and is the single most likely trigger for this trade's thesis: Q3 net yields are already guided flat, so any miss or soft forward-booking commentary on the call is the clearest downside catalyst inside this put's window (MarketChameleon earnings dates).
- 2027 wave-season booking signals. Early holiday/2027 pricing color typically leaks on the Q3 call and in the weeks after — a read on whether the "flat yields" guide is a one-quarter blip or a trend.
- Ongoing geopolitical-itinerary disruption. Management explicitly flagged this as an active drag on select sailings; further disruption in affected regions would reinforce the revenue-trim narrative the put is betting on.
👥 How Four Different Traders Might Read This
🎲 YOLO Trader
This is a real, unhedged, $6M directional bet — not a hedge dressed up as one. If you're chasing the same idea, remember the breakeven is ≈$261.46 (≈14% below today's real spot), and the strike sits mid-way through the gamma map, not on the market's strongest support. Size it as a leveraged, catalyst-timed bet on Q3 earnings (≈late October) confirming the demand slowdown — not a sure thing against a stock that just beat and raised.
📈 Swing Trader
Watch $310 — the heaviest total-gamma concentration just below today's reference price — as the first tell. A clean break below $310 into Q3 earnings (≈late October) would support the bearish thesis gaining traction; a hold above $320–325 on continued good news would argue the beat-and-raise story is winning. Trade the level, not the headline dollar figure.
💵 Premium Collector
Implied volatility here isn't extreme — the monthly (Aug 21) options market prices only a ≈12.6% swing — but selling premium against a stock that just guided Q3 yields flat and has a confirmed earnings event 7 weeks before this put expires is not free money. If you want income here, keep it defined-risk and size small; a Q3 miss (or a sharp beat) can move this stock fast in either direction.
🌱 Beginner
The lesson: a put buy isn't automatically bearish "conviction," and it isn't automatically a hedge either — you have to check both the tape and the fundamentals. Here, there's no paired stock trade making this look like portfolio insurance, so it reads as a standalone directional bet. But notice why it's plausible even after a beat: the headline (EPS beat, raised guide) and the substance (revenue-growth cut, flat Q3 yields) told two different stories in the same earnings release — always read past the headline number.
⚠️ Risk Factors — What This Trade Cannot Tell Us
- Open vs. close is largely — not fully — confirmed. Size (3,218) is more than 12× prior OI (267), which strongly supports a fresh open, but the definitive test is tomorrow's ≈06:30 ET OPRA open-interest snapshot. We predict OI rises toward ≈3,485; a smaller rise would mean some of today's print was existing contracts trading hands rather than a pure new position.
- This could be a hedge we can't see. We found no on-tape stock trade offsetting this put, but that only rules out a visible, same-window hedge — it doesn't rule out protection on a large existing long stock or call position held elsewhere, or a package executed off this particular tape window.
- The fundamental backdrop still favors the bulls. RCL beat Q2 earnings, raised full-year EPS guidance, is tracking ahead of its Perfecta EPS-growth target, runs 110% load factors, and carries a Buy consensus with price targets ($337–356) well above both the real spot (≈$305) and the print-time reference ($321.67). Cruise demand has been resilient through multiple prior scares; a premium-multiple growth story doesn't need much good news to keep working.
- Cost tailwinds partly offset the yield concern. Q3 net-cruise-cost guidance (ex-fuel) is down ≈1.2–1.7%, which can support margins even if pricing growth genuinely flattens.
- We cannot see who placed this trade or why. The options tape shows the mechanism (a facilitated auction), the price, and the size — not the broker, the counterparty's identity, or whether this trader holds an offsetting position elsewhere that this put is quietly protecting.
- A single option print does not predict the stock. This is one $6.0M bet among RCL's total option flow today, on a day when the stock is also digesting its own earnings reaction. Treat it as one data point, not a forecast.
Disclaimer: Options trading involves substantial risk of loss and is not suitable for all investors. This analysis is for educational purposes only and is not financial advice. Past performance does not guarantee future results. The trade discussed here is a single institutional options print; it does not imply the trade will be profitable or that you should copy it. Royal Caribbean is a high-beta, premium-multiple consumer-discretionary stock that just reported earnings — outcomes here are genuinely two-sided. Always do your own research and consider consulting a licensed financial advisor before trading, especially around earnings-adjacent flow like this.
🎯 The Bottom Line
Real talk: Royal Caribbean beat Q2 earnings and raised its profit guide this morning — and a few hours later, someone paid ≈$6.0 million for December $280 puts with no hedge in sight. That's not a contradiction; it's a bet that the revenue-growth cut and flat Q3 yield guide buried inside today's good headline are the more important signal, and that Q3 earnings (≈late October) will confirm a cooling cruise consumer before this put expires on December 18.
What this trade tells us:
- 🎯 The $280 strike is only ≈8% below today's real ≈$305 spot — an efficient, fairly close-to-the-money way to buy downside, not a far-out lottery ticket
- 📅 The December 18, 2026 expiration comfortably spans the next real catalyst — Q3 2026 earnings, ≈late October, with net yields already guided flat
- ✅ Open CONFIRMED: open interest rose 267 → 10,863 (+10,596) — and that build covers both this 3,218-lot auction and a separate 7,500-lot multi-leg floor trade earlier the same day, together ≈99% opening
- 🔎 The strike went from nearly empty (267) to 10,863 contracts in one session — a ≈40× increase, and materially bigger than the single print this article analyses
- ⚖️ This is a leveraged, defined-risk bet with a ≈$261.46 breakeven (≈14% below spot) set against a Street that's still broadly bullish (Buy consensus, PTs $337–356) — genuinely two-sided, not a slam dunk either way
Mark your calendar:
- ✅ July 29, 2026, ≈06:30 ET — RESOLVED. Open interest rose 267 → 10,863 (+10,596), confirming the fresh open and revealing a companion 7,500-lot print at the same strike. See the ✅ RESOLVED box above.
- 📅 ≈Late October 2026 — Q3 2026 earnings, the single biggest catalyst inside this put's window
- 📅 December 18, 2026 — this put expires
This is a bet that "beat and raise" isn't the whole story — and the open-interest confirmation shows the bet was placed at roughly three times the scale a single-print view revealed. Now watch how RCL behaves around the $310 gamma zone heading into Q3 earnings; that will tell you more about the thesis than any headline premium figure.
Last updated: July 29, 2026 — next-day OPRA open interest resolved the provisional flag and confirmed the read: open interest rose 267 → 10,863 (+10,596). The confirmation also surfaced a separate 7,500-contract multi-leg floor trade at the same strike earlier in the session; combined with this article's 3,218-lot auction, ≈99% of the day's 10,769-contract volume opened new positions. The 7,500-lot print is a multi-leg structure with at least one unanalysed leg and is deliberately not folded into this article's directional read.
About Royal Caribbean Cruises Ltd. (RCL): the world's second-largest cruise operator, running Royal Caribbean International, Celebrity Cruises, and Silversea across ≈70 ships, trading at a ≈$78.7–79.1B market cap in the Consumer Discretionary / Travel & Leisure sector following its July 28, 2026 Q2 earnings report.
Published: July 28, 2026.