🧩 SNDK's $436M Day, Now Resolved: The $289M Put Was a Close, the $132M Call Was a Pure Transfer, and the Only Real New Position Was the Small Lit Call
📅 August 10, 2026 | Three separate trades, hours apart, all sells — do not read them as one coordinated story
✅ Updated 2026-08-11 pre-market — the next-day OPRA open interest is in, and it settled both provisional legs against the "new short" reading. The $289M January $1,660 put fell 5,660 → 660, exactly −5,000, landing on the precise branch we published in advance ("falls back toward ≈660"): that trade closed last week's position — it was STC, not STO. The $132M June-2027 $1,020 call moved 5,911 → 5,910, a change of one contract: a pure transfer between two parties, neither an open nor a close. The only genuinely new position on the day is the small lit August $1,300 call (168 → 2,108). Of $436.55M in headline premium, roughly $15.55M represents an actual new position. See the ✅ RESOLVED box below.
📊 Company Overview
Sandisk Corporation designs and manufactures NAND flash memory and flash-based storage — raw 3D NAND wafers and die, enterprise and client SSDs, embedded flash, memory cards and USB drives — sold under the Sandisk and WD brands. Nearly all of its wafer supply comes from a 50/50 manufacturing joint venture with Kioxia, extended through December 31, 2034 in January 2026. Sandisk spun out of Western Digital in February 2025 and has since joined both the S&P 500 (Nov 28, 2025) and the Nasdaq-100 (Apr 20, 2026).
- Sector/Industry: Technology Hardware (S&P 500, Nasdaq-100 member)
- Market cap: ≈$182–187 billion, per CompaniesMarketCap and StockAnalysis — figures differ only by intraday timing
- Shares outstanding: 149.00 million, float 143.34 million (StockAnalysis)
- Current price: ≈$1,257
This is a stock up several hundred percent in 2026 — that is real, not a data error. It's driven by a NAND pricing supercycle (contract prices surged over 100% in 1H26 per TrendForce), a datacenter mix that went from 12% to 38% of revenue in one year, forced index buying, and a record-high short interest getting run over. Shares hit an all-time high of $2,354.39 on June 22, 2026 per The Motley Fool and now sit roughly 47% below that peak while still up several hundred percent for the year. Keep that two-way violence in mind for everything below.
💰 The Option Flow — Three Separate Trades, Not One Story
Trade A (10:51:52) — the $289.0M headline: 5,000 deep-in-the-money puts SOLD
Someone (or a matched pair of counterparties) crossed 5,000 January 15, 2027 $1,660 puts, SOLD at $578.00, with the stock at $1,245.28. This printed as a negotiated block cross — a broker matched a known buyer and seller off the open book. There is no urgency here and no aggressor to read; it's a done deal between two parties who already agreed on price.
Trade B (09:52:46) — the only genuinely lit print on today's board: 1,767 near-dated calls SOLD
Earlier the same morning, 1,767 August 28, 2026 $1,300 calls SOLD at $88.00 for ≈$15.55M, with the stock at $1,243.00. This print took the displayed bid — a real, aggressive, seller-initiated trade on the lit book. Of the 53 legs that traded across today's entire flow board, this is the only one that was genuinely lit; everything else (including Trade A) was a negotiated block, floor trade, or facilitated auction. That makes this small trade more informative, not less.
Trade C (15:31:10) — a new $132.0M leg: 2,500 far-dated deep-in-the-money calls SOLD, and it flips the intrinsic/time story
Late in the session, 2,500 June 17, 2027 $1,020 calls SOLD at $528.00 for ≈$132.0M, with the stock at $1,252.44. This printed as a single-leg floor block — manually negotiated between a known counterparty, not a cross and not a lit sweep. No urgency verbs apply; this is a facilitated, off-book trade.
The strike is ≈$232 in the money, so on the surface this looks like the same kind of deep-ITM print as Trade A. It is not. Breaking the $528.00 price down: $232.44 is intrinsic value, and $295.56 — more than half — is time value. That is the striking detail. Even sitting that far in the money, over half of what was paid (or in this case, collected) for the option is pure time premium, because the contract runs ≈10 months on a stock whose implied volatility is enormous. Contrast this directly with Trade A: on that $1,660 put, only ≈28% of the price was time value (≈$163.28 of $578.00) — intrinsic value did almost all the work. Trade C runs the split almost exactly the other way. See "What This Actually Means" below for why.
Full Trade Details
| Field | Trade A 🤝 | Trade B ⚡ | Trade C 🤝 |
|---|---|---|---|
| Time | 10:51:52 | 09:52:46 | 15:31:10 |
| Buy/Sell | SELL | SELL | SELL |
| Call/Put | PUT | CALL | CALL |
| Expiration | 2027-01-15 | 2026-08-28 | 2027-06-17 |
| Premium | $289.0M | ≈$15.55M | $132.0M |
| Strike | $1,660 | $1,300 | $1,020 |
| Volume (day) | 5,000 | 2,000 | 2,500 |
| Prior Open Interest | ≈5,660 | 168 | 5,911 |
| Size (this print) | 5,000 | 1,767 | 2,500 |
| Spot at print | $1,245.28 | $1,243.00 | $1,252.44 |
| Option price | $578.00 | $88.00 | $528.00 |
| Option symbol | SNDK20270115P1660 | SNDK20260828C1300 | SNDK20270617C1020 |
| Order type | ✅ STC (resolved — was STO ⏳) | ✅ STO (proven open) | ✅ Pure transfer (resolved — was STO ⏳) |
| Strategy | Deep-ITM Put closed — block cross, position retired | Short Call — lit, proven open | Deep-ITM Call transferred — floor block, no net OI change |
| Mechanism | 🤝 BLOCK CROSS (negotiated, known counterparty) | ⚡ LIT (took displayed liquidity) | 🤝 FLOOR BLOCK (manually negotiated, known counterparty) |
SNDK's net premium for the day is now ≈$436.55M across these three trades ($289.0M + ≈$15.55M + $132.0M, all sells — no offsetting legs, so gross equals net here) — comfortably the largest single-name total on today's board.
✅ RESOLVED — The Next-Day OI Snapshot Settled Both Provisional Legs, and Neither Was a New Short
Updated 2026-08-11 pre-market. The resolving OPRA open-interest snapshot is timestamped August 11 and reflects the August 10 close. The baseline is the August 10 snapshot (which reflects the August 7 close — i.e. before these prints).
| Leg | Baseline (Aug-10 snap) | Resolving (Aug-11 snap) | Δ | Print size | Δ as % | Day vol | Our published prediction | Verdict |
|---|---|---|---|---|---|---|---|---|
| Trade A — Jan-15-2027 $1,660 put (sold) | 5,660 | 660 | −5,000 | 5,000 | −100.0% | 5,002 | "falls back toward ≈660" | 🔄 CLOSE (STC) — was STO ⏳ |
| Trade B — Aug-28-2026 $1,300 call (sold) | 168 | 2,108 | +1,940 | 1,767 | +109.8% | 2,100 | "rise toward ≈1,935" | ✅ OPEN (STO) — confirmed |
| Trade C — Jun-17-2027 $1,020 call (sold) | 5,911 | 5,910 | −1 | 2,500 | −0.04% | 2,501 | rise to ≈8,411 or fall | 🔄 PURE TRANSFER — neither |
Trade A landed on the exact branch we published, to the contract. We wrote that a fall back toward ≈660 would confirm the print closed the position built the prior Thursday/Friday. Open interest printed 660 — not "toward" it, exactly it, erasing precisely the 5,000 that had been added. That is as clean as this check ever gets: the ⏳ STO label was wrong, and the leading interpretation in the body of this article was right. This was a position being retired, not a $289 million bearish bet being placed. The order type is now STC.
Trade C did something neither branch anticipated: nothing at all. Open interest moved by a single contract while 2,500 changed hands on the floor. That means the buyer opened and the seller closed in equal measure — a pure transfer of an existing position from one holder to another. No new risk entered the market, and no risk left it. The $132.0M is real money changing hands, but it represents zero net new positioning, which is why "a desk sold $132M of calls" would have been a misleading way to describe it. The order type is now transfer, not STO.
Trade B — the small one — is the only genuinely new position on the board. Open interest rose 1,940 against a 1,767-lot print, slightly above our ≈1,935 estimate. The single smallest trade of the three, and the only lit one, is the only one that added new exposure.
The scoreboard, in the terms that matter: of the $436.55M headline premium, the close accounts for ≈$289.0M, the transfer for ≈$132.0M, and the actual new position for ≈$15.55M — about 3.6% of the number in the headline. This is the single best illustration on today's board of why premium totals should never be read as conviction until open interest resolves them.
🤓 What This Actually Means — Plain English
Start with the arithmetic, because it changes the whole story. The $1,660 put strike sits ≈$415 above where the stock actually traded ($1,245.28) — this put is deep in the money. Of the $578.00 price paid per contract, $414.72 is pure intrinsic value (money that exists simply because the strike is above the stock price, regardless of what happens next) and only $163.28 is time value. Scaled to the full 5,000-contract, $289.0 million headline: ≈$207.4 million is intrinsic value and only ≈$81.6 million is time value. A reader who reads "$289 million" as a measure of fresh bearish-or-bullish conviction is being misled by arithmetic — most of that number would be there even if this were a completely different trade struck yesterday or last month. This is exactly the kind of print that gets written up as a dramatic whale sighting when it should not be, because the real new-information content is closer to $82 million of time value — and, as the next-day open interest went on to prove, even that overstates it: the position was closed, not opened, so the new-information content of the $289.0 million headline is effectively zero.
What does selling a deep in-the-money put actually do? A short put that deep ITM behaves a lot like being long the stock — its delta is close to +1 in stock-equivalent terms, meaning its value moves almost dollar-for-dollar with SNDK. Institutions use structures like this for reasons that often have nothing to do with a fresh directional view: financing (borrowing against a position), unwinding or transferring an existing options position, or manufacturing a specific payoff as part of a larger package. We cannot see whether there's a stock leg sitting against this print — OPRA shows us the option tape, not any hedge sitting in someone's equity account. Combined with the OI history (a position opened ≈5,000 contracts last Thursday/Friday, and almost exactly that size trading again today), the more probable read is that this is the unwinding of last week's position — not a brand-new $289 million bearish bet placed today. The next-day snapshot confirmed exactly that: open interest fell 5,660 → 660, retiring precisely the 5,000 contracts built the prior session. This was a close.
What does selling near-dated, out-of-the-money calls after a ≈355% YTD run mean? This is the piece of today's board that actually carries information. Someone sold 1,767 calls struck ≈4.6% above the stock, expiring in just 18 calendar days, and did it by hitting the bid — taking real, displayed liquidity, not negotiating a quiet block. That combination (aggressive selling, near-dated, modestly OTM, into a stock that just had a violent multi-hundred-percent run and a -13% earnings reaction five days earlier) reads as a desk betting the rally pauses or that the stock doesn't clear $1,300 in the next two-and-a-half weeks — consistent with locking in gains via a covered call against existing shares, or an outright bet that upside is capped into the August 13 Investor Day. We cannot see whether shares are held against it either, so we can't rule out a naked short view. But unlike Trade A, this one is a proven opening position from a single, real, seller-initiated trade — it deserves to be taken seriously, without overclaiming what one desk's 18-day view tells us about the next five months.
Trade C, and the single best teaching point on today's board: two deep-ITM options, and their price splits run in opposite directions. Line the two up side by side:
| Trade A (put) | Trade C (call) | |
|---|---|---|
| How far in the money | ≈$415 (≈33.3% of spot) | ≈$232 (≈18.6% of spot) |
| Days to expiration at print | ≈158 | ≈311 |
| Option price | $578.00 | $528.00 |
| Intrinsic value | $414.72 (≈71.8%) | $232.44 (≈44.0%) |
| Time value | $163.28 (≈28.2%) | $295.56 (≈56.0%) |
Trade A is proportionally deeper in the money and has less time to expiration, so intrinsic value dominates its price — nearly three-quarters of the $578.00 is money that would be there regardless of what SNDK does next. Trade C is less deep in the money in percentage terms and has almost double the time to expiration (≈10 months versus ≈5), so time value dominates instead — more than half of the $528.00 is pure premium for volatility and duration, not a reflection of how far the strike already sits from the stock. The lesson generalizes: "deep in the money" alone does not tell you how much of a quoted premium is real optionality. You need the strike-to-spot percentage and the time to expiration together, and on a name as volatile as SNDK — where a LEAP-length contract prices in an implied range of roughly $155 to $2,333 by its own expiration — duration can overwhelm even a large dollar amount of intrinsic value.
🧭 Three Large Negotiated Sells, One Name, One Session — Coordinated, or Coincidence?
Zoom out and the pattern on the page is: a $289.0M put cross at 10:51 a.m., a $15.55M genuinely lit call sale at 9:52 a.m., and a $132.0M call floor block at 3:31 p.m. — all three sells, all three on the same underlying, in the same session. It is tempting to read that as one actor running a coordinated book. We cannot prove that, and we should not imply it.
What we can say from the tape: two of the three (Trade A and Trade C) were negotiated off-book — a cross and a floor block, respectively, each with its own known counterparty that OPRA does not identify to us. They are different mechanisms (cross vs. floor), different expirations (Jan-2027 vs. Jun-2027), different strikes, and different times of day, more than four hours apart. The one thing tying them together on the page is direction (SELL) and underlying (SNDK) — which is also exactly what you'd see from three unrelated desks independently deciding SNDK's option premium looks rich after a ≈355% run, with zero coordination between them. Sizable, unrelated sellers converging on the same expensive-premium name after a parabolic move is a completely ordinary market pattern, not evidence of a single hand.
What would actually support a "one actor" read — and what we don't have — is a shared broker/MMID (not visible on the public tape), matching order timestamps to the millisecond across legs, or a package that nets to a specific combined payoff (like a diagonal or calendar spread) rather than three economically independent options. Absent that, the honest framing is: three separate large sell trades, same name, same day, unknown whether one desk or three. Treat SNDK's ≈$436.55M total as a sum of independent data points, not as one $436.55M conviction bet.
📈 Technical Setup
YTD Chart
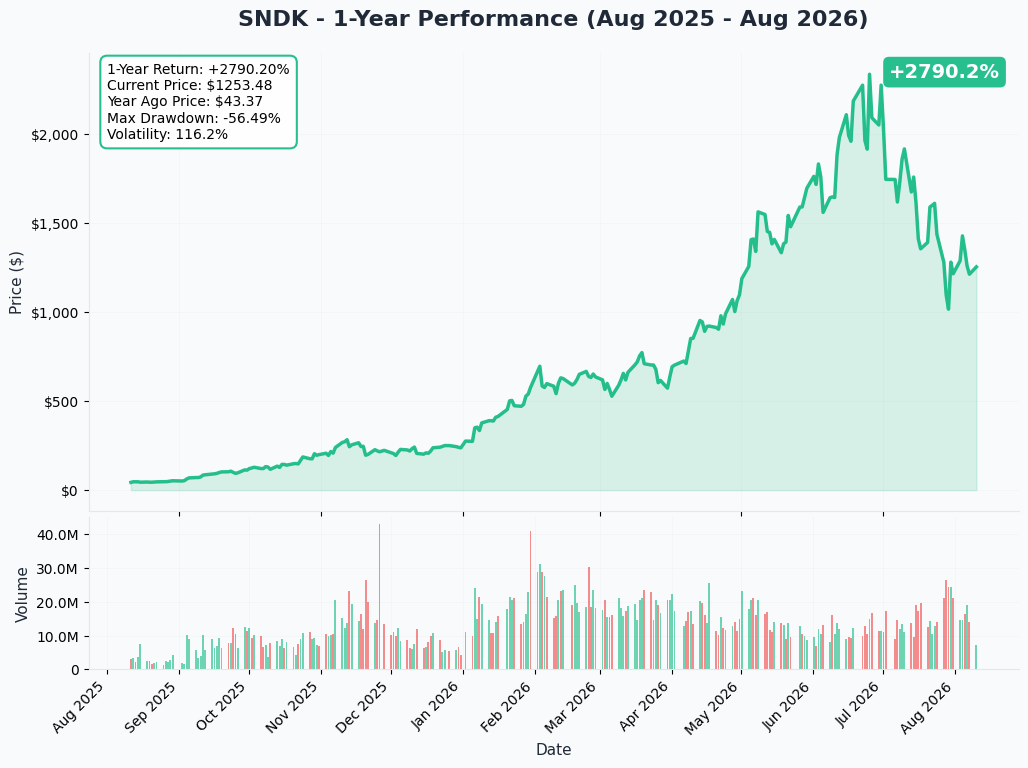
The chart tells the same story as the numbers above: a parabolic run to an all-time high of $2,354.39 on June 22, a violent ≈47% drawdown since, and a stock that is still up several hundred percent for the year even after that pullback. This is not steady, low-volatility appreciation — it's a name that has already proven it can move hundreds of dollars in either direction in a matter of weeks.
Gamma-Based Support & Resistance
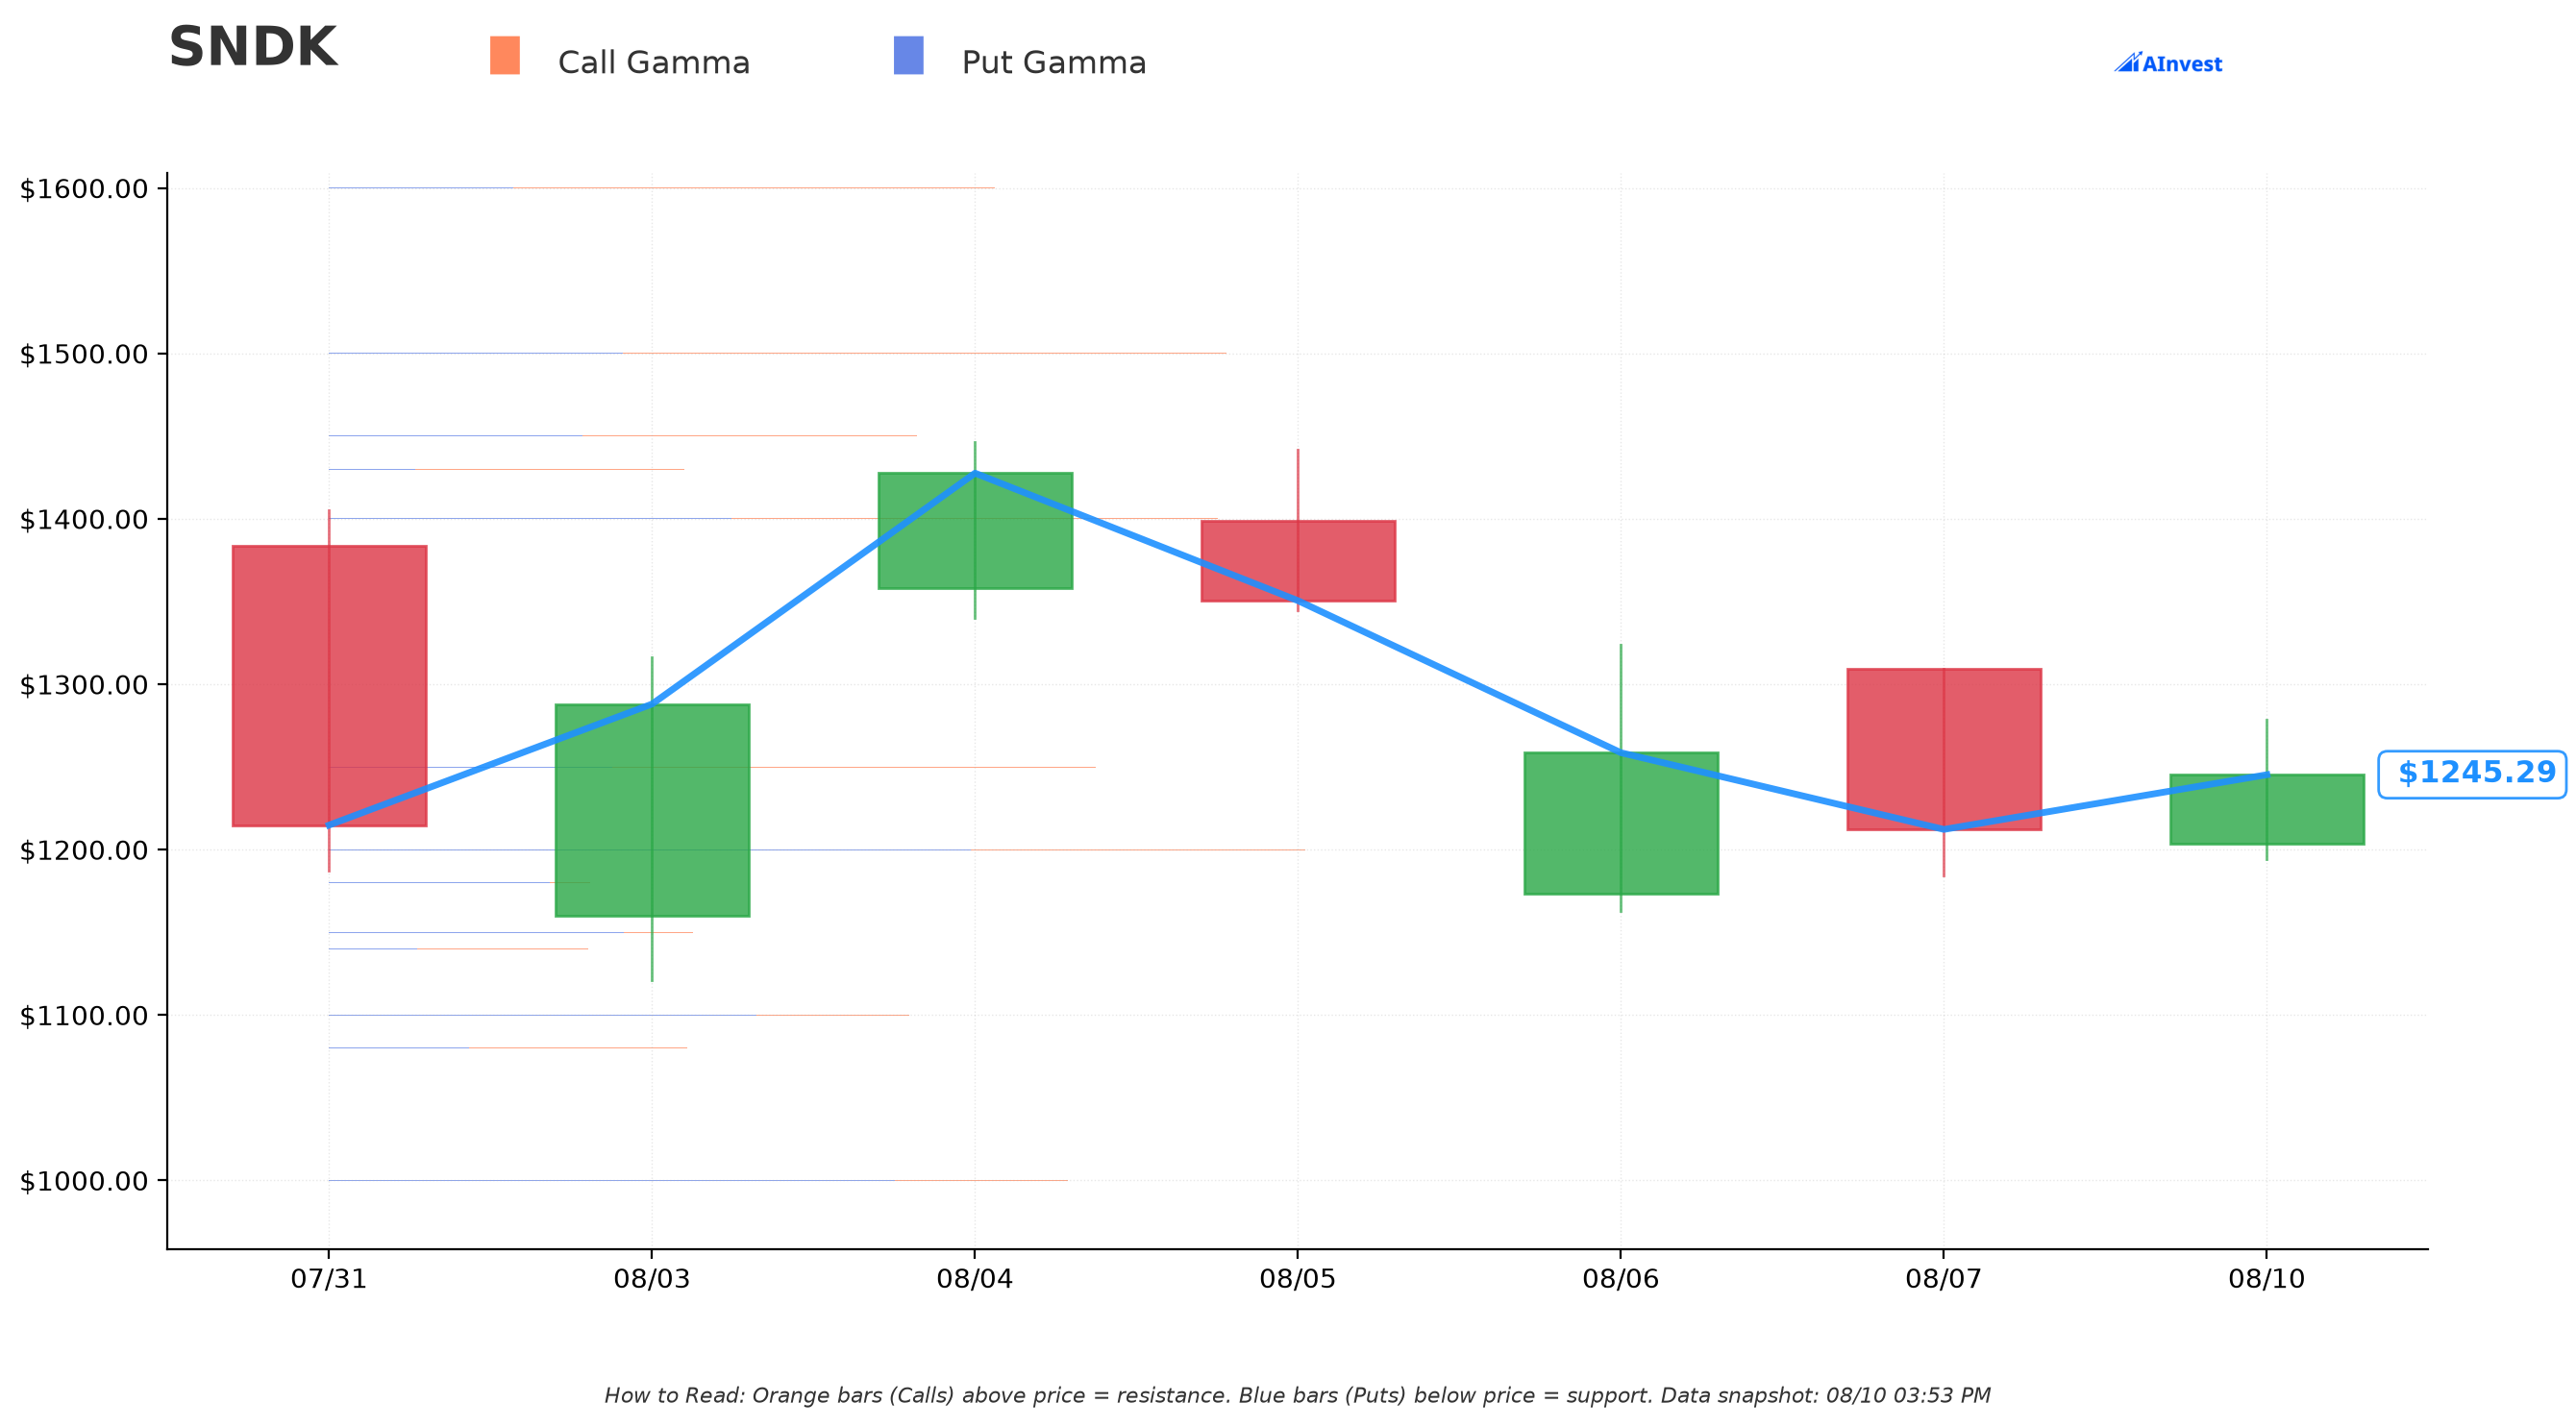
Current price in the (refreshed, post-Trade-C) gamma data: ≈$1,243. A few concrete levels relevant to today's three trades:
- $1,300 (Trade B's strike): the single largest gamma concentration near current price — ≈1.66 total gamma exposure units, net positive (call-dominant). This is the nearest meaningful overhead level, and it's exactly where the lit call was sold — the seller picked a strike sitting right on top of real dealer gamma.
- $1,200: a large support-side level below spot — ≈1.44 total gamma exposure, net negative (put-dominant) — the nearest significant floor beneath current price.
- $1,250: essentially at-the-money, ≈1.14 total gamma exposure, net positive — the immediate pivot zone.
- $1,660 (Trade A's strike): carries a large put-gamma print (≈0.42 total, net negative) purely because today's 5,000-lot cross sits in the chain there — this is a byproduct of the trade itself, not a pre-existing market structure support/resistance level, since it sits ≈33% above spot.
- $1,020 (Trade C's strike): by contrast, a genuinely gamma-quiet level — only ≈0.32 total gamma exposure, roughly flat/net. Unlike Trade A's strike, this is not even inflated by the trade itself in a way that stands out on the chain; $1,020 sits ≈18% below spot in an otherwise unremarkable part of the gamma map. Nothing about dealer positioning explains why this particular strike was chosen — it reads as a pricing/economics decision (premium collected, delta profile, time-to-expiration), not a level the market was defending.
Read: SNDK's nearest real dealer-positioning ceiling is close to where the lit call was sold, and its nearest real floor is well below all three trades' strikes. None of today's three prints line up with a level the market was already defending — Trade A's and Trade C's strikes are both financing/close-style artifacts sitting well outside the gamma-dense zone, not technical levels.
Implied Move
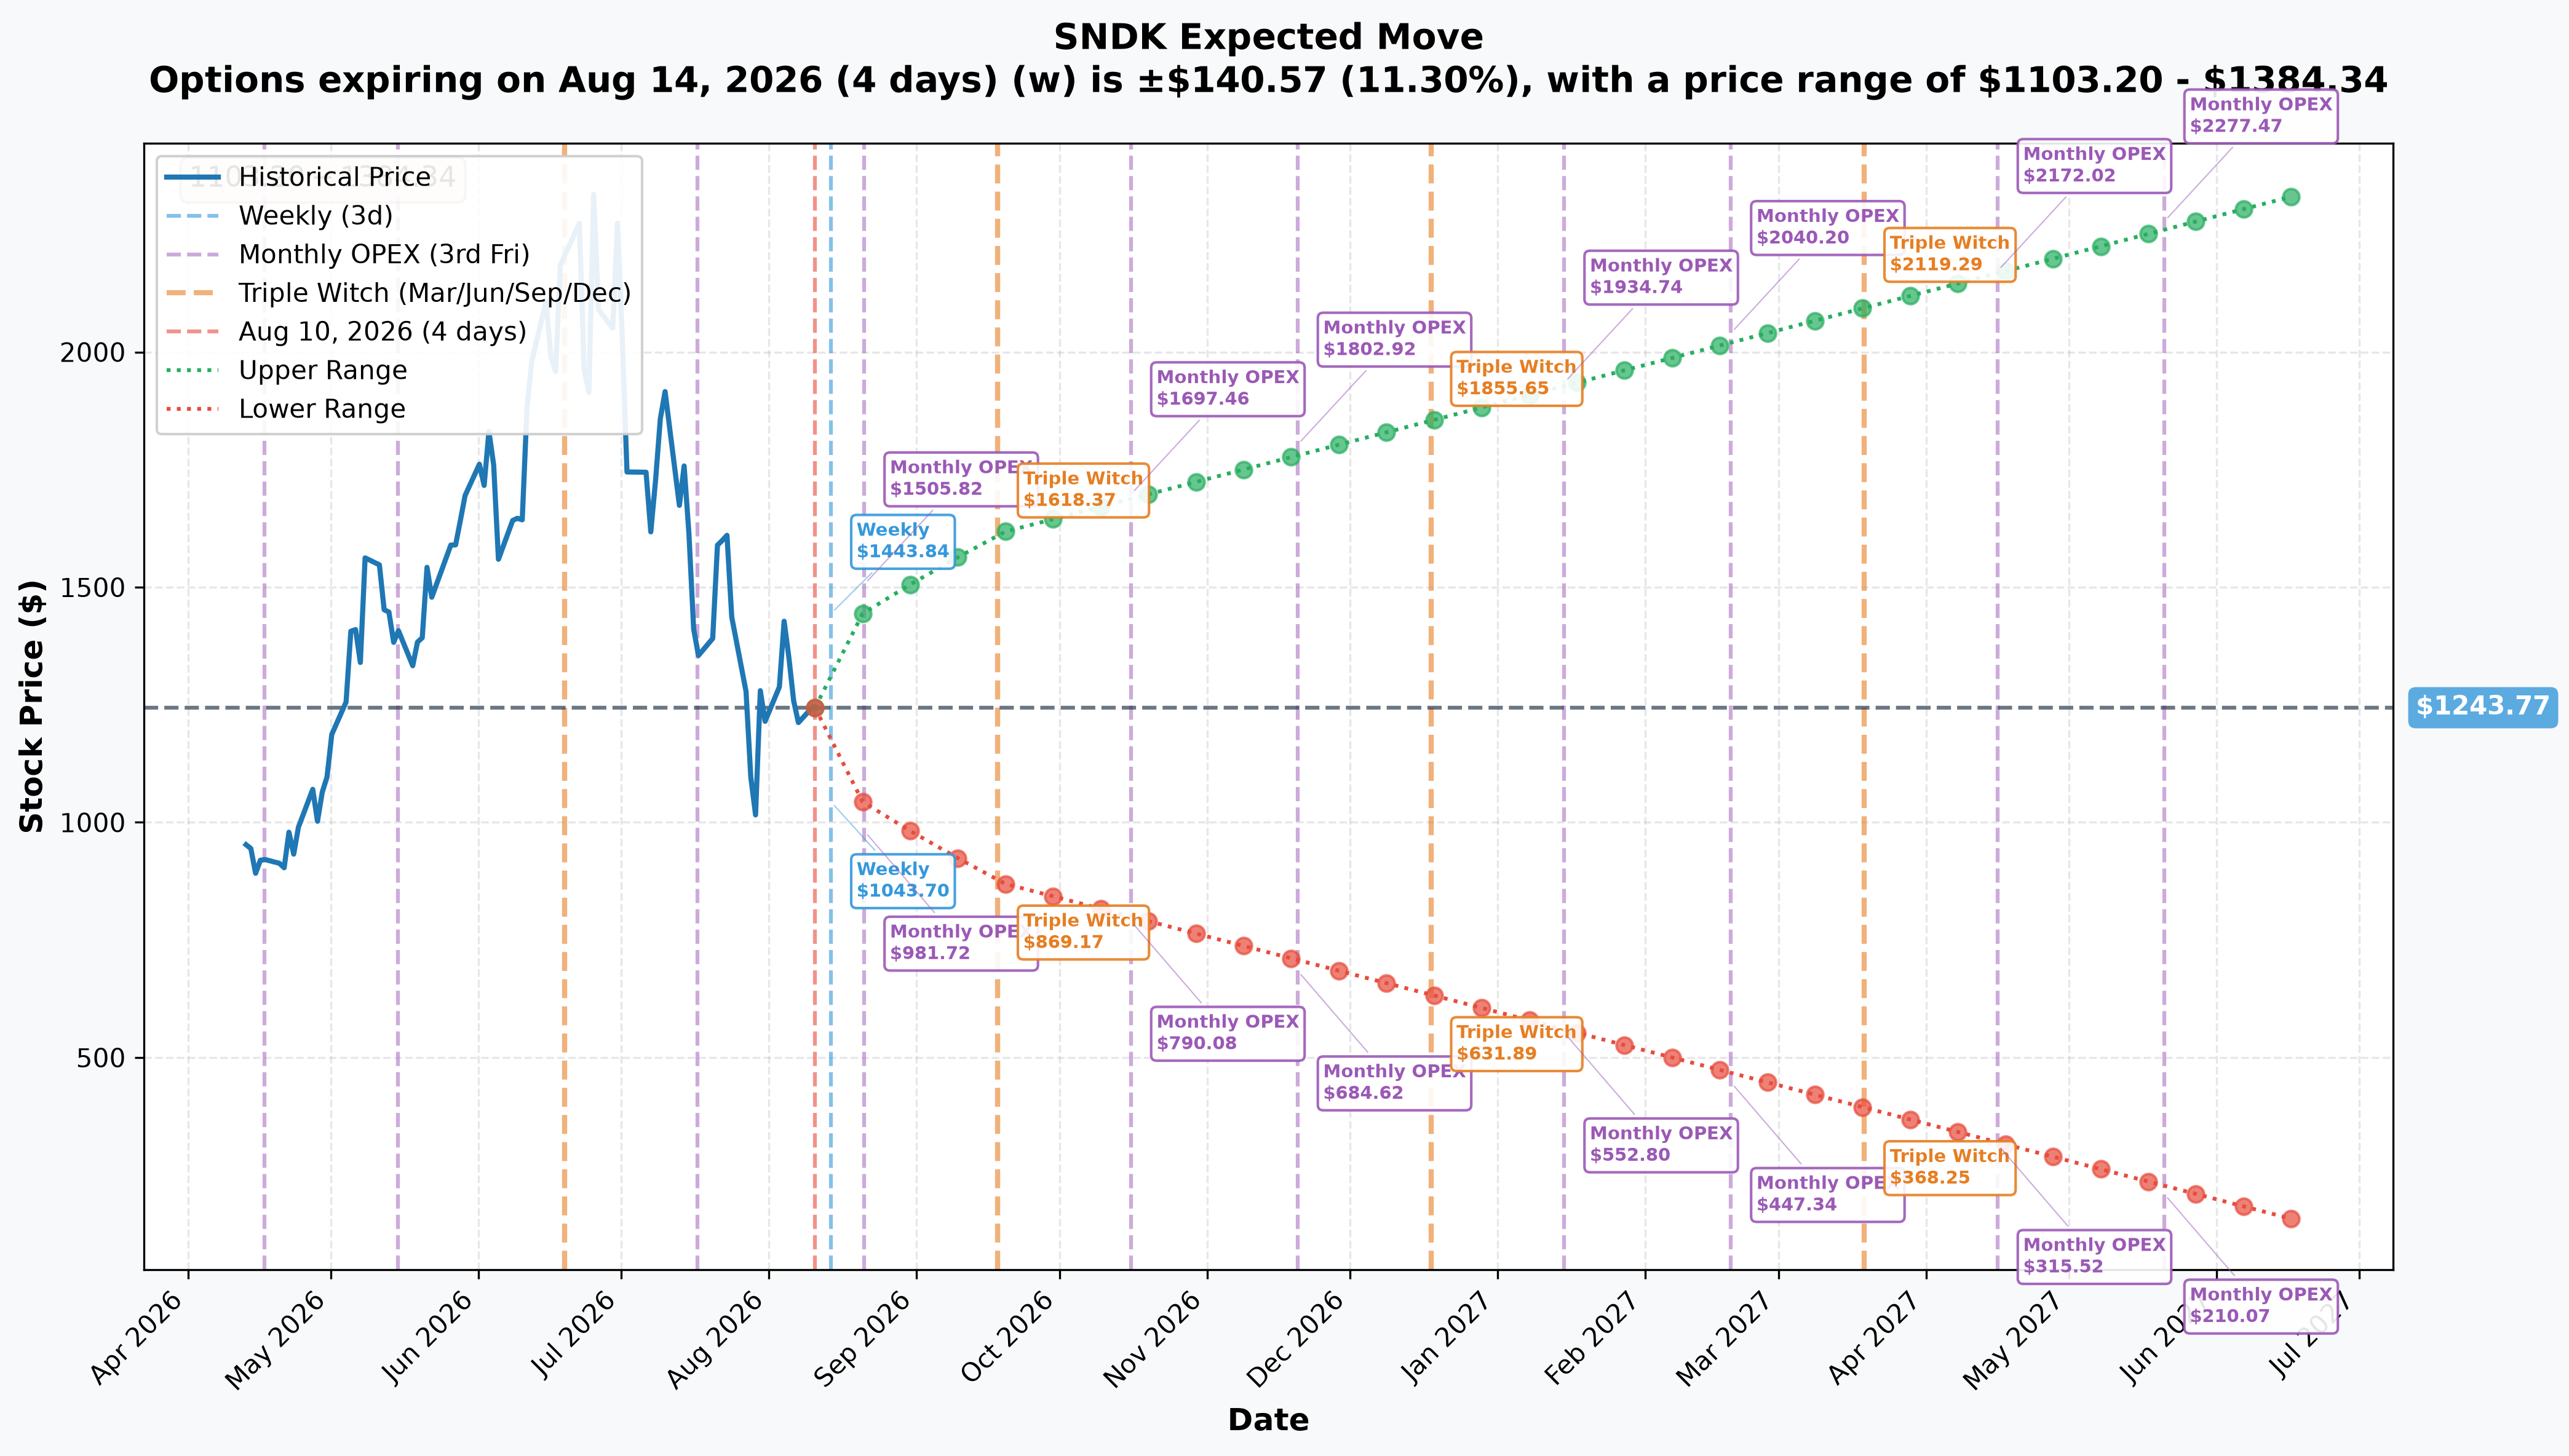
From the options market itself (current price in this refreshed dataset: ≈$1,244):
- Weekly (Aug 14, 4 days): ±11.3% (±$140.57) → range $1,103.20 – $1,384.34
- Monthly OPEX (Aug 21, 11 days): ±16.88% (±$209.99) → range $1,033.78 – $1,453.76
- Quarterly triple witch (Sep 18, 39 days): ±29.91% (±$371.96) → range $871.81 – $1,615.73
- Jan 15, 2027 expiration (Trade A's exact expiration): implied range ≈$552.80 – $1,934.74
- Jun 17, 2027 expiration (Trade C's exact expiration, 311 days): ±87.56% (±$1,089.07) → implied range ≈$154.70 – $2,332.84
Trade B's Aug 28 expiration falls between the Aug 21 and Sep 18 brackets above — figure on an implied range roughly between $1,034–$1,454 and $872–$1,616, tightening toward the Aug 21 numbers since Aug 28 is closer in time. Trade A's exact expiration (Jan 15, 2027) prices in a genuinely enormous range — from ≈$553 to ≈$1,935 — which underlines how much can happen to this stock before that put ever needs to matter economically. Trade C's exact expiration (Jun 17, 2027) is wider still — ≈$155 to ≈$2,333, a range that spans roughly 15x from bottom to top — the options market itself is pricing in the possibility that essentially anything happens to this stock before that call ever needs to settle. That enormous priced-in range is a big part of why more than half of Trade C's premium is time value: the market is charging a lot for ten months of exposure to a stock this violent, regardless of how deep the strike currently sits.
🎪 Catalysts — Mapped to the Right Window (never confuse a catalyst date with an expiration date)
Before the Aug 28 expiration (Trade B's window):
- August 13, 2026 — Investor Day, 9:00 a.m. ET, confirmed by the company. This is the only scheduled company event inside Trade B's expiration window — no earnings report falls inside it. Analysts expect coverage of capital allocation, High Bandwidth Flash, and customer-contract durability. It lands eight days after the Aug 5 earnings' ≈13% post-earnings drop and is management's first structured chance to rebut the "peak margin" worry.
Between Aug 28 and the Jan 15, 2027 expiration (inside BOTH Trade A's and Trade C's windows):
- September 22, 2026 — Micron fiscal Q4 earnings (StockAnalysis), the sector's read-through print on NAND pricing.
- ≈October 2026 — TrendForce 4Q26 memory price outlook (cadence only, not a fixed date); the 3Q26 outlook already showed the price surge decelerating to +10–15% QoQ from over 100% in 1H26.
- ≈November 5, 2026 — Sandisk fiscal Q1 2027 earnings, expected per Investing.com's calendar but not yet company-confirmed, against a guide of $10.30–10.80B revenue and $44–46 non-GAAP EPS. This is the only Sandisk earnings print that falls inside Trade A's expiration.
Between Jan 15, 2027 and the Jun 17, 2027 expiration (Trade C's exclusive extra window — this is what "≈10 months out" actually buys):
- ≈Late January 2027 — Sandisk fiscal Q2 2027 earnings (prior-year analogue: January 29, 2026, per Investing.com; not yet announced). This falls just outside Trade A's expiration but comfortably inside Trade C's — the put expires roughly two weeks before this earnings print, while the June-2027 call survives well past it.
- ≈February–March 2027 — TrendForce quarterly memory-price outlook updates (cadence only, no fixed date).
- ≈April–May 2027 — Sandisk fiscal Q3 2027 earnings (not yet announced; based on the company's historical quarterly cadence). A second full earnings report that Trade C's expiration reaches but Trade A's does not.
So Trade C's June-2027 contract sits across two additional Sandisk earnings reports (fiscal Q2 and fiscal Q3 2027) beyond the single one captured by Trade A's January-2027 contract — that is the concrete, dated version of "≈10 months buys more catalysts."
After the Jun 17, 2027 expiration:
- ≈August 2027 — Sandisk fiscal Q4 2027 earnings (not yet announced), the first earnings report to fall outside all three of today's trades.
- Contracted NBM (New Business Model) coverage stepping to ≈two-thirds of fiscal 2028 bits — the de-cyclicalization thesis mostly pays off beyond every expiration used today, Trade C included.
The core valuation tension underneath all of this: SNDK trades at a forward P/E of just 5.87x — cheap-looking only if the guided ≈$44-46 quarterly EPS run-rate holds or improves for four straight quarters. Forbes flagged a forward PEG of 0.11, a ≈90% discount to the sector median — the market is pricing high odds that current margins are not durable. Analyst targets range from $235 to $3,050 — a 13x spread that tells you the Street has no consensus anchor here either.
🎲 Four Ways to Read This
🎰 YOLO Trader
Nothing in today's flow is a green light to chase. The headline $289M number is mostly intrinsic value sitting on a position whose open/close status isn't even resolved, and the new $132M call sale is the same story with the intrinsic/time split flipped — neither Trade A nor Trade C gives you a fresh, provable directional signal to copy. The one real signal (Trade B) is a single desk selling calls against an 18-day window on a stock up several hundred percent, which is a bet on a pause, not a launchpad for a new long. If you trade this name, understand that option premiums here are enormous in absolute dollars purely because the stock is priced near $1,250 — a single contract move of $10-20 is routine. Size accordingly; a stock that's already down ≈47% from its own high in seven weeks can keep moving violently either direction.
📈 Swing Trader
The gamma map gives you real levels to work with independent of today's prints: ≈$1,300 is the nearest meaningful overhead gamma concentration (and where Trade B was sold), ≈$1,200 is the nearest real floor below spot. Neither Trade A's $1,660 strike nor Trade C's $1,020 strike sits in a gamma-dense zone — both are financing/close-style prints, not levels the market was defending. The Aug 28 expiration's implied range (roughly $1,034–$1,454) brackets the Investor Day — a binary, management-controlled event with no earnings backstop inside that window. If you want to trade the Investor Day specifically, that's the trade to study; Trade A's and Trade C's far-dated strikes are too far out of the relevant near-term structure to be useful here.
💰 Premium Collector
Trade B is genuinely interesting as a template, not a trade to blindly copy: selling a modestly OTM, near-dated call into elevated implied volatility after a huge run is a textbook premium-collection structure — if you already own or want covered exposure. Note the strike (≈4.6% OTM, 18 days) and that it printed at $88.00 against a $1,243 stock — the premium collected per contract is enormous in dollar terms even though the strategy itself is standard. Trade C is a useful contrast rather than a template: selling a deep-ITM, far-dated call for $528.00 collects a huge headline premium, but more than half of that ($295.56) is time value being sold away over ≈10 months on an extremely volatile name — a very different risk/reward than Trade B's near-dated, modestly-OTM structure, and one that behaves much more like a covered-call-against-existing-shares or financing trade than a pure income play. Trade A tells you nothing usable for premium collection either — it's someone else's already-existing position, likely being closed, not a fresh income trade you can replicate.
🌱 Beginner
Two lessons matter more than any specific trade here. First: a huge headline dollar figure does not mean a huge directional bet, and it does not even tell you whether you're looking at intrinsic value or time value without doing the math. $207.4 million of Trade A's $289.0 million print is money that exists purely because of where the strike sits relative to the stock; flip to Trade C and it's the opposite — $73.89 million of its $132.0 million is time value, more than half. Same "deep in the money" label, opposite composition. Second: this stock is not a normal stock. It's up several hundred percent this year and down ≈47% from its own June high — the kind of two-way volatility that can wipe out an undersized options position fast in either direction. If you're new to options, SNDK is a name to study from the sidelines before risking capital in it.
⚠️ Honest Limits — What the Tape Cannot Prove
- No counterparty identity. OPRA shows the print, not who placed it or why. "Desk," "fund," or "institution" are inferences from size and structure, not facts.
- No visibility into any stock or hedge leg. If Trade A or Trade C is part of a larger package (financing, conversion, or a hedge against existing shares), the option tape alone cannot show it.
- Trade A is now resolved: it was a close (STC). Open interest fell 5,660 → 660, exactly −5,000 — the matching-size, matching-timing read against last week's build was correct. What the tape still cannot show is who closed, or why.
- Trade C is now resolved as a pure transfer — open interest moved by one contract on a 2,500-lot print. It was neither an open nor a close in net terms. What the tape cannot show is which side was opening and which was closing; only that the two exactly offset.
- We cannot prove or disprove that the same desk is behind more than one of today's three trades. Same underlying, all sells, same session — but different mechanisms, strikes, expirations, and hours apart in time. That pattern is equally consistent with one actor and with three unrelated sellers; do not read it as evidence of coordination.
- We cannot see the order behind Trade B beyond the single print — whether the seller holds shares, how large their total position is, or whether this is one of several similar trades spread across venues.
- This is one day of flow. Options prices and open interest can shift materially by the next session, especially heading into the August 13 Investor Day.
Options trading involves substantial risk of loss and is not suitable for all investors. Nothing here is a recommendation to buy or sell any security or option. Position sizing and risk control matter more than direction in a name with SNDK's realized volatility profile.
Last updated: 2026-08-11 (pre-market) — the next-day OPRA open-interest snapshot resolved both provisional legs. Trade A (Jan-2027 $1,660 put) fell 5,660 → 660, exactly −5,000: CLOSE (STC), landing on the published branch to the contract. Trade C (Jun-2027 $1,020 call) moved 5,911 → 5,910, a change of one contract: pure transfer, neither open nor close. Trade B (Aug-28 $1,300 call) rose 168 → 2,108: OPEN (STO) confirmed. The title, the trade table's order-type row, the plain-English section and the honest-limits section were updated; the ⏳ provisional callout was replaced with the ✅ RESOLVED box.