🇺🇸 SPY — Two New Strikes Opened Above a Monday Position That Did Not Actually Close
🔄 Updated August 10, 2026. We wrote that Monday's $775 long calls were being sold out. Open interest says the line did not shrink — 89,368 → 90,973, essentially flat on 136,560 contracts of volume. That is a transfer, not an exit: whoever sold, somebody else bought and opened against them. The $780/$788 vertical did open exactly as predicted, and the direction of that vertical remains unresolved as we said it would. Title and the $775 section corrected below.
SPDR S&P 500 ETF Trust tracks the S&P 500, holding 505 large- and mid-cap U.S. stocks weighted by market capitalisation. Assets $812.05B, expense ratio 0.09%, listed since January 1993. The fund trades at $772.80, up 0.55% today, and is +23.26% over the past year (StockAnalysis). Follow it on the SPDR S&P 500 fund page.
🤝 The Trade in Plain English
At 14:23:13–14, with the fund at $771.71, three call strikes crossed together as stock-plus-options floor trades — negotiated packages that carry a share leg by definition, worked in clips on a single exchange within 180 milliseconds. A separate put package printed earlier at 14:00:12.
| Time | Buy/Sell | C/P | Expiration | Strike | Size | Volume | OI (prior) | Option Price | Premium | Spot | Option Symbol |
|---|---|---|---|---|---|---|---|---|---|---|---|
| 14:23:14 | SELL | CALL | 2026-08-14 | $775 | 82,908 | 133,960 | 89,368 | $3.22 | $26,696,376 | $771.71 | SPY20260814C775 |
| 14:23:13 | SELL | CALL | 2026-08-14 | $780 | 138,230 | 146,193 | 5,775 | $1.58 | $21,840,340 | $771.71 | SPY20260814C780 |
| 14:23:13 | BUY | CALL | 2026-08-14 | $788 | 138,230 | 141,592 | 258 | $0.38 | $5,252,740 | $771.71 | SPY20260814C788 |
| 14:00:12 | SELL | PUT | 2026-09-18 | $620 | 50,000 | 50,456 | 128,720 | $0.54 | $2,700,000 | $772.13 | SPY20260918P620 |
Net: a $45,983,976 CREDIT.
The $780 and $788 legs are decisive proven opens — 138,230 contracts against prior open interest of 5,775 and 258. Those are brand-new positions; the $788 strike barely existed this morning.
⭐ The $775 Calls Were Bought on Monday
The open-interest history on the $775 strike has the signature we look for:
| Aug 3 | Aug 4 | Aug 5 | Aug 6 | Aug 7 |
|---|---|---|---|---|
| 2,419 | 2,721 | 87,968 | 88,813 | 89,368 |
Flat near 2,500 contracts, then +85,247 in a single session. Since a morning open-interest figure reflects the prior day's trading, we taped August 4 — and found a 49,745-lot auction at $3.20, with the strike's size-weighted fill at 71% across the spread.
That is the buy side. The $775 calls were bought to open on Monday.
Today, 82,908 of them trade at $3.22 — below the bid — at a size that fits inside the 89,368 that exist. We read that as Monday's long position being sold out. The August 10 snapshot says otherwise: the strike went 89,368 → 90,973, up 1,605. On 136,560 contracts of volume, the market-wide position at $775 did not move.
That is a transfer, not an exit. An individual holder may well have sold — but every contract they sold was bought by somebody opening a new long against them, so the aggregate line stands. The one thing we can now rule out is the alternative we flagged: this was not a large new short at $775 either. It was churn.
And in the same instant, two new strikes open above it: $780 and $788, at 138,230 contracts each — both confirmed as genuine new opens, and larger than the $775 line that stayed put.
🤔 What We Can and Cannot Say About the New Position
What is proven: the $780 and $788 legs are new, they are the same size, same expiry, same right, same millisecond. That is a vertical spread at $780/$788.
What is not proven: which way round it is. On a negotiated stock-plus-options floor package, the pricing engine allocates a net price across the legs — so a per-leg fill of "below the bid" does not reliably identify the seller, the way it would on a lit trade. All three call legs printed below their bids, which cannot all be aggressive selling.
Both readings are live, and they are opposites:
- Bull call spread (buy $780, sell $788): pay $1.20 for a spread worth up to $8.00 — a 6.7:1 payoff needing SPY to clear $781.20, about +1.1%. This is the natural continuation of a long call position being rolled up.
- Bear call spread (sell $780, buy $788): collect $1.20 against $6.80 of risk — a bet the index stalls below $780.
We lean to the roll-up reading, because a long position at $775 is demonstrably being closed in the same breath and rolling a winner up and out is the ordinary thing to do with one. But we are not going to state it as fact, and we have marked the legs accordingly.
✅ RESOLVED — The August 10 Snapshot
Resolving OPRA open interest is timestamped August 10 and reflects the August 7 close.
| Leg | Baseline (Aug-7) | Resolving (Aug-10) | Δ | Print size | Δ as % | Day vol | Verdict |
|---|---|---|---|---|---|---|---|
| $780 call (Aug-14) | 5,775 | 145,531 | +139,756 | 138,230 | 101.1% | 147,834 | ✅ OPEN — as predicted |
| $788 call (Aug-14) | 258 | 139,721 | +139,463 | 138,230 | 100.9% | 142,396 | ✅ OPEN — as predicted |
| $775 call (Aug-14) | 89,368 | 90,973 | +1,605 | 82,908 | 1.9% | 136,560 | ⚠️ NOT A CLOSE — pure transfer |
| $620 put (Sep-18) | 128,720 | 148,025 | +19,305 | 50,000 | 38.6% | 50,545 | ✅ OPEN (STO) — partial, ≈39% |
The vertical opened exactly as called. 138,230 new contracts at each of $780 and $788, within 1% of the print on both. And as we said in advance: that still does not tell you which side was bought. Open interest proves a position was created, not who owns which end of it. That ambiguity has not resolved and it will not.
The $775 call is the correction. We predicted 89,368 → down ≈82,900 on a genuine close, and named a rise as the outcome that would mean a materially different story. What actually happened was the third thing: essentially nothing. Up 1,605 on 136,560 contracts of volume. Monday's long line is still there. Somebody sold a large clip and somebody else opened the other side of it — a change of ownership, not a change in the market's position.
The $620 put came in between the outcomes we named. Not the flat transfer we flagged as the third possibility, but not a clean 50,000-contract open either: +19,305 of new short puts, ≈39% of the print. The remaining ≈61% changed hands between existing holders. So the tail-risk sale is real but roughly a third of the headline size.
Score for this board: 2 clean calls, 1 partial, 1 refuted.
🤓 What This Actually Means — Plain English
A vertical spread caps both ends. You trade two strikes of the same type and expiry, and the most it can ever be worth is the gap between them — here $8.00. Everything above $788 and below $780 is irrelevant to the payoff.
Rolling up is what you do with a winner — but that is not what the open interest shows here. SPY sits about 0.5% below its 52-week high of $776.85, so a call struck at $775 is barely out of the money, and re-establishing higher would be the ordinary move. The snapshot says the $775 line never came down, though. So read the $780/$788 vertical as a standalone new position, not as the second half of a roll. The roll framing was our inference, and it did not survive.
The $620 put deserves its own note. At $0.54 with a delta of −0.0166, it is nearly worthless — struck 19.8% below the index. Selling 50,000 of them collects $2.7M for an obligation that only bites in a crash. This one printed as a stock-plus-options cross, and we did find its share leg: a 35,000-share block at $770.74, plus a further 15,500 shares moments earlier.
One honest gap. The much larger 14:23 call package carries the same stock-plus-options marking, but we could not locate a matching large equity block on the consolidated tape anywhere near that time — the biggest print in a two-minute window was 2,470 shares. The marking says a non-option leg exists; we could not find it, and we would rather tell you that than invent a hedge.
📊 The Charts
One-Year Price Action
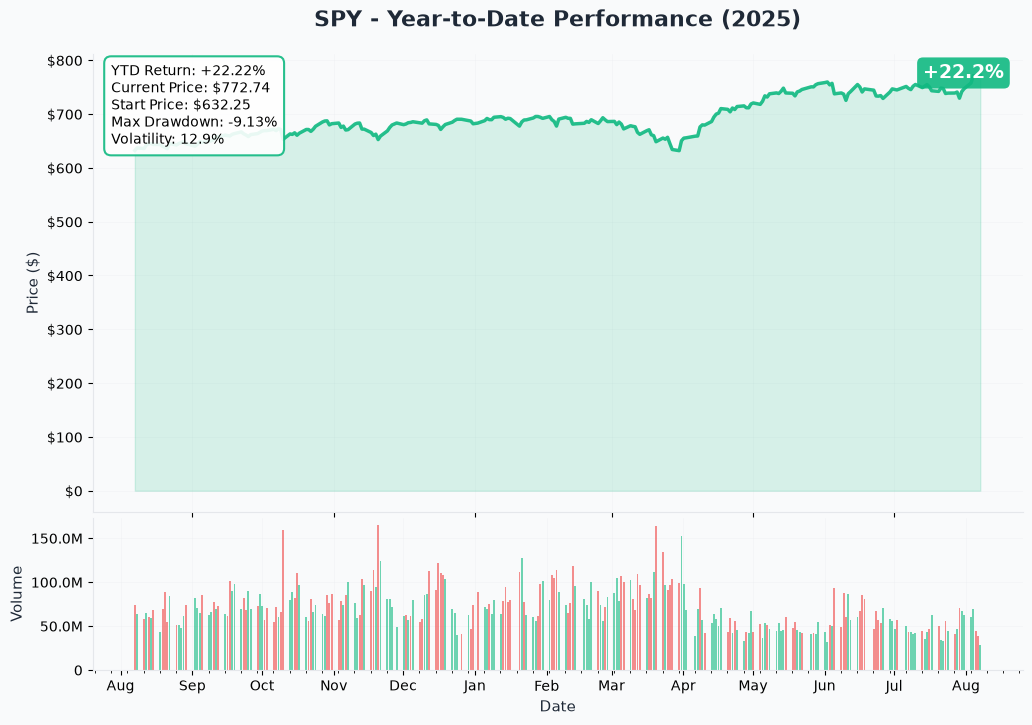
SPY is +22.2% on this chart, with a quoted one-year total return of +23.26% (StockAnalysis). The 52-week range is $629.11–$776.85, so today's $772.80 sits within ≈0.5% of the high.
Worth pairing with the valuation note: commentary observes that "the S&P 500 is finally rising again — and it's getting cheaper, too," with multiples declining even as the index gained 22% (StockAnalysis). Earnings growing faster than price is what produces a falling PE in a rising market — currently 26.82.
Gamma Support and Resistance
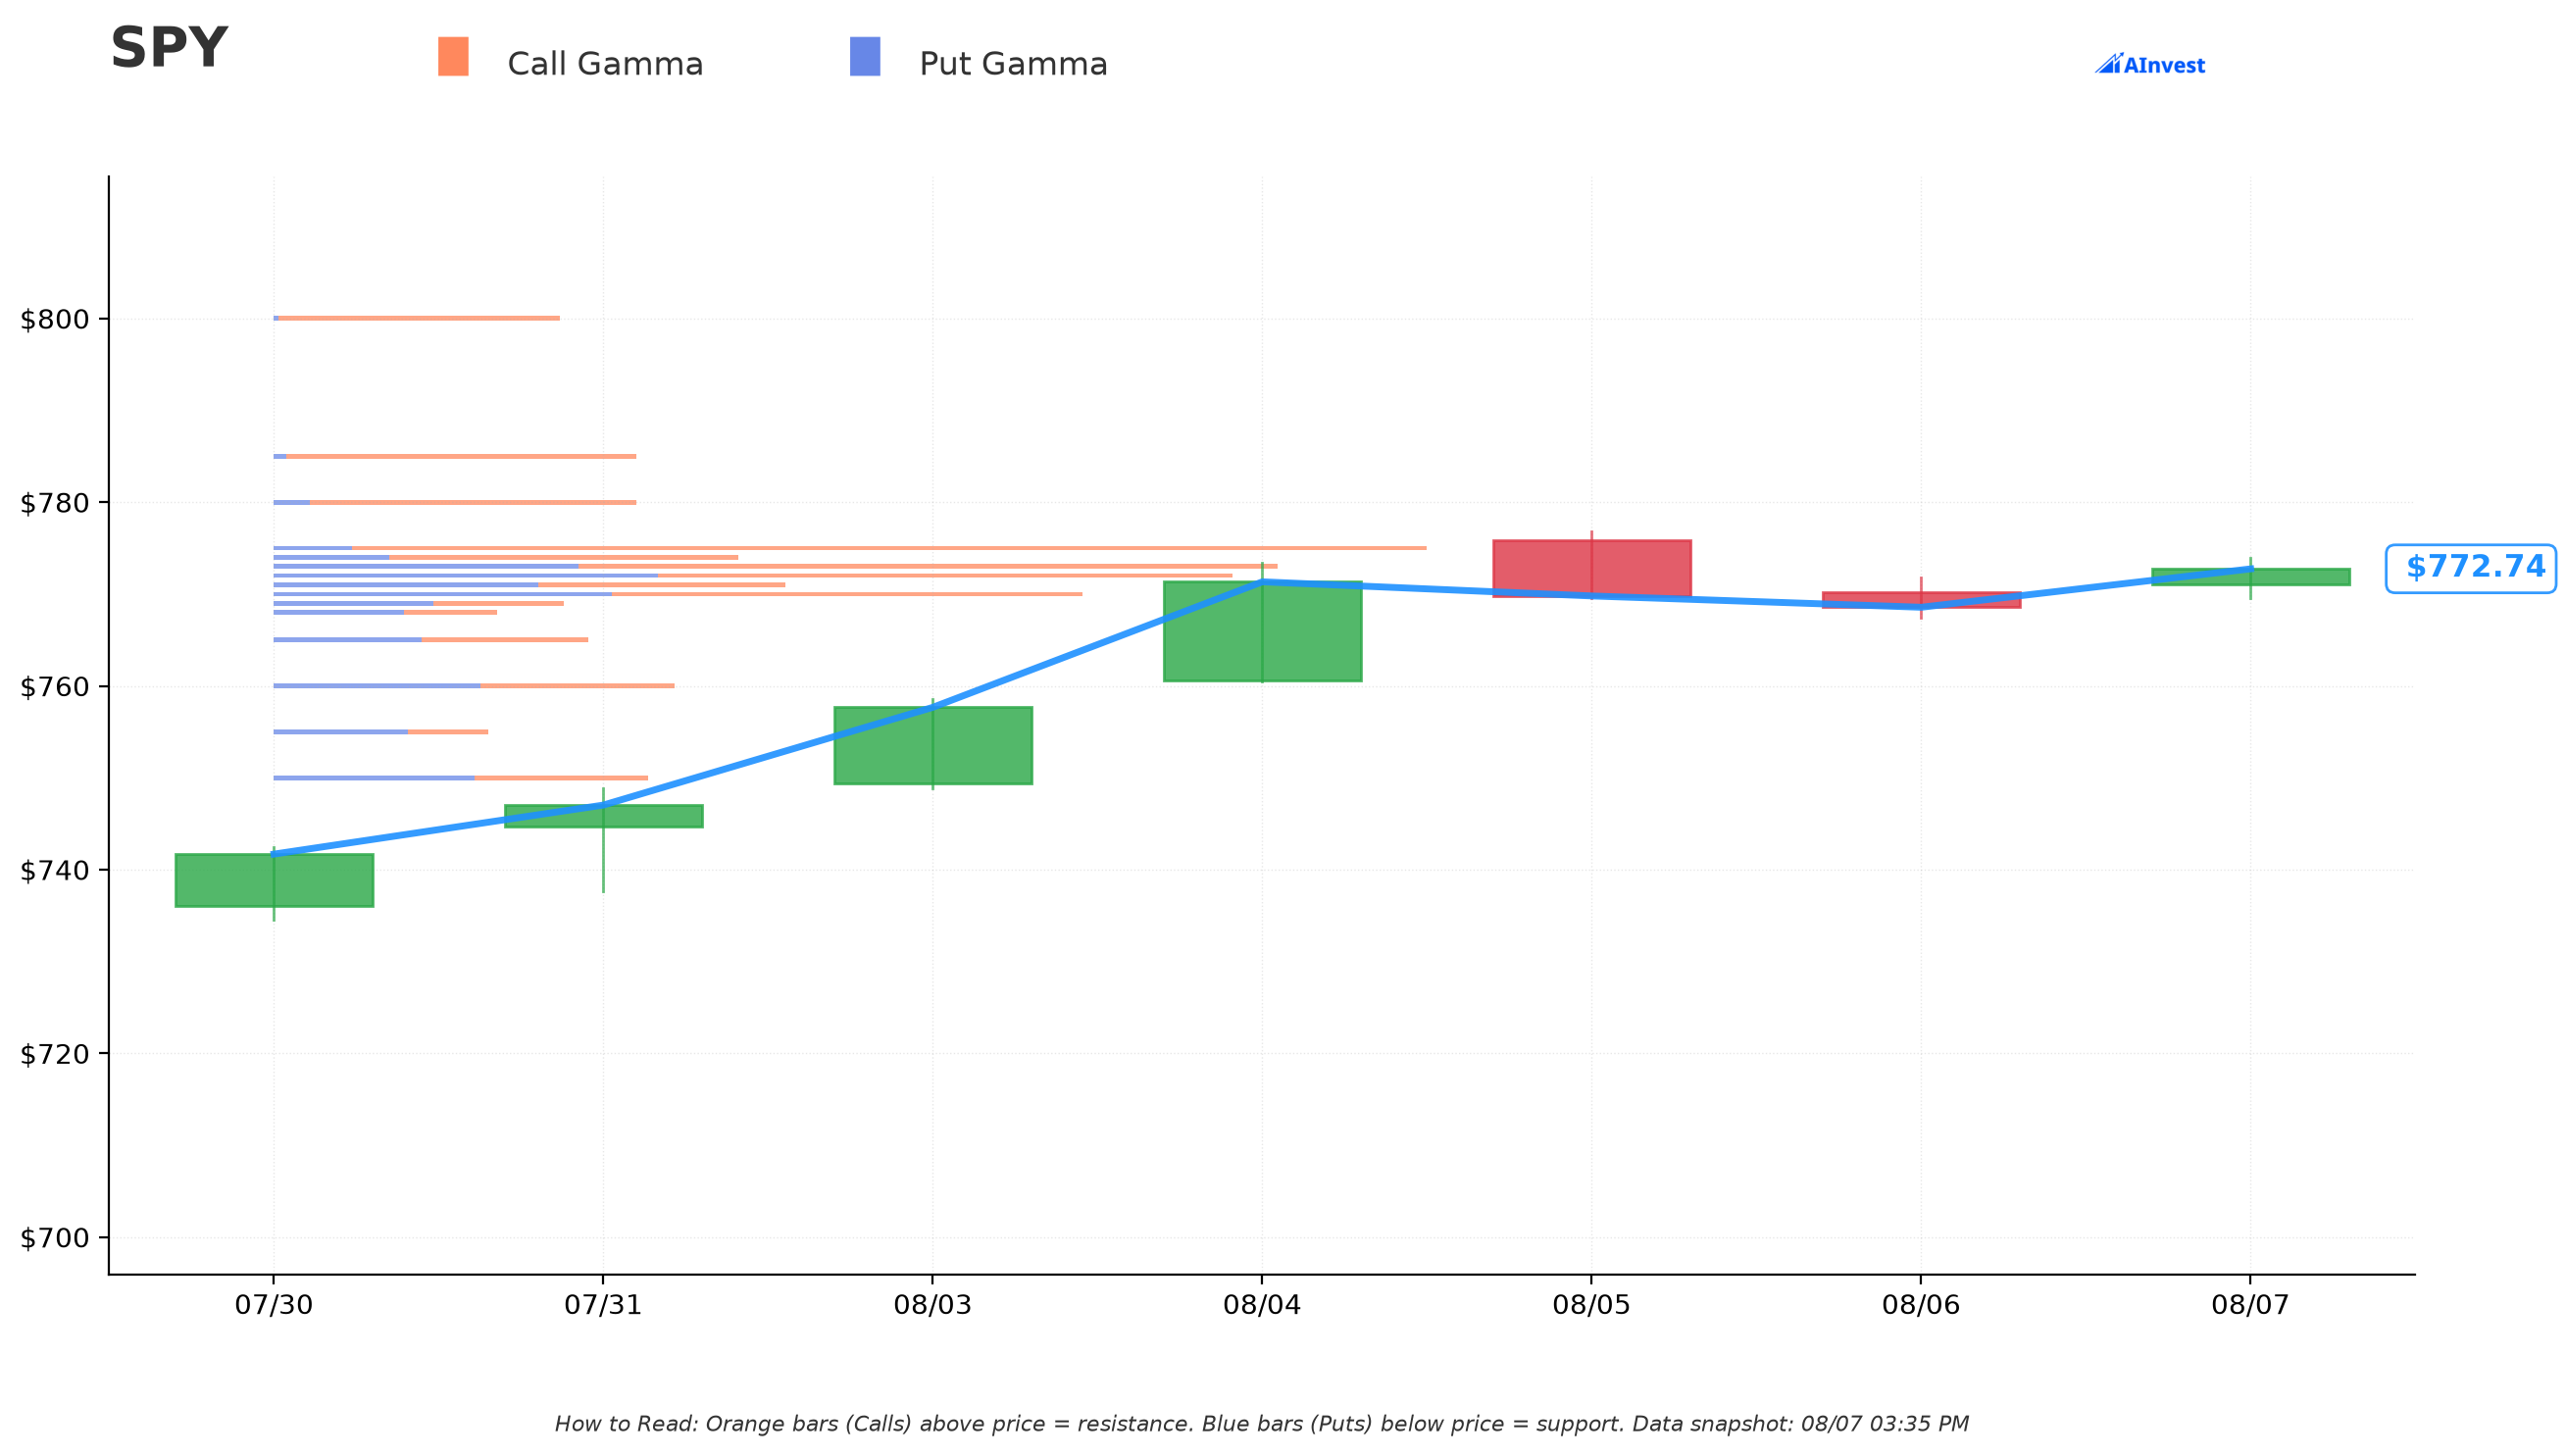
Dealer gamma is extremely tight in the most heavily traded option in the world: support at $772, $771, $770 and $760, resistance at $773, $774 and $775. The whole battleground is a five-dollar corridor, and the fund is sitting inside it.
Note where the strikes fall. $775 is the top of the resistance structure — exactly where Monday's long calls were struck, and exactly where they are being sold. $780 and $788 sit above the entire map, in territory with no dealer hedging to slow a move. That is a meaningful detail for either reading of the new spread.
Implied Move
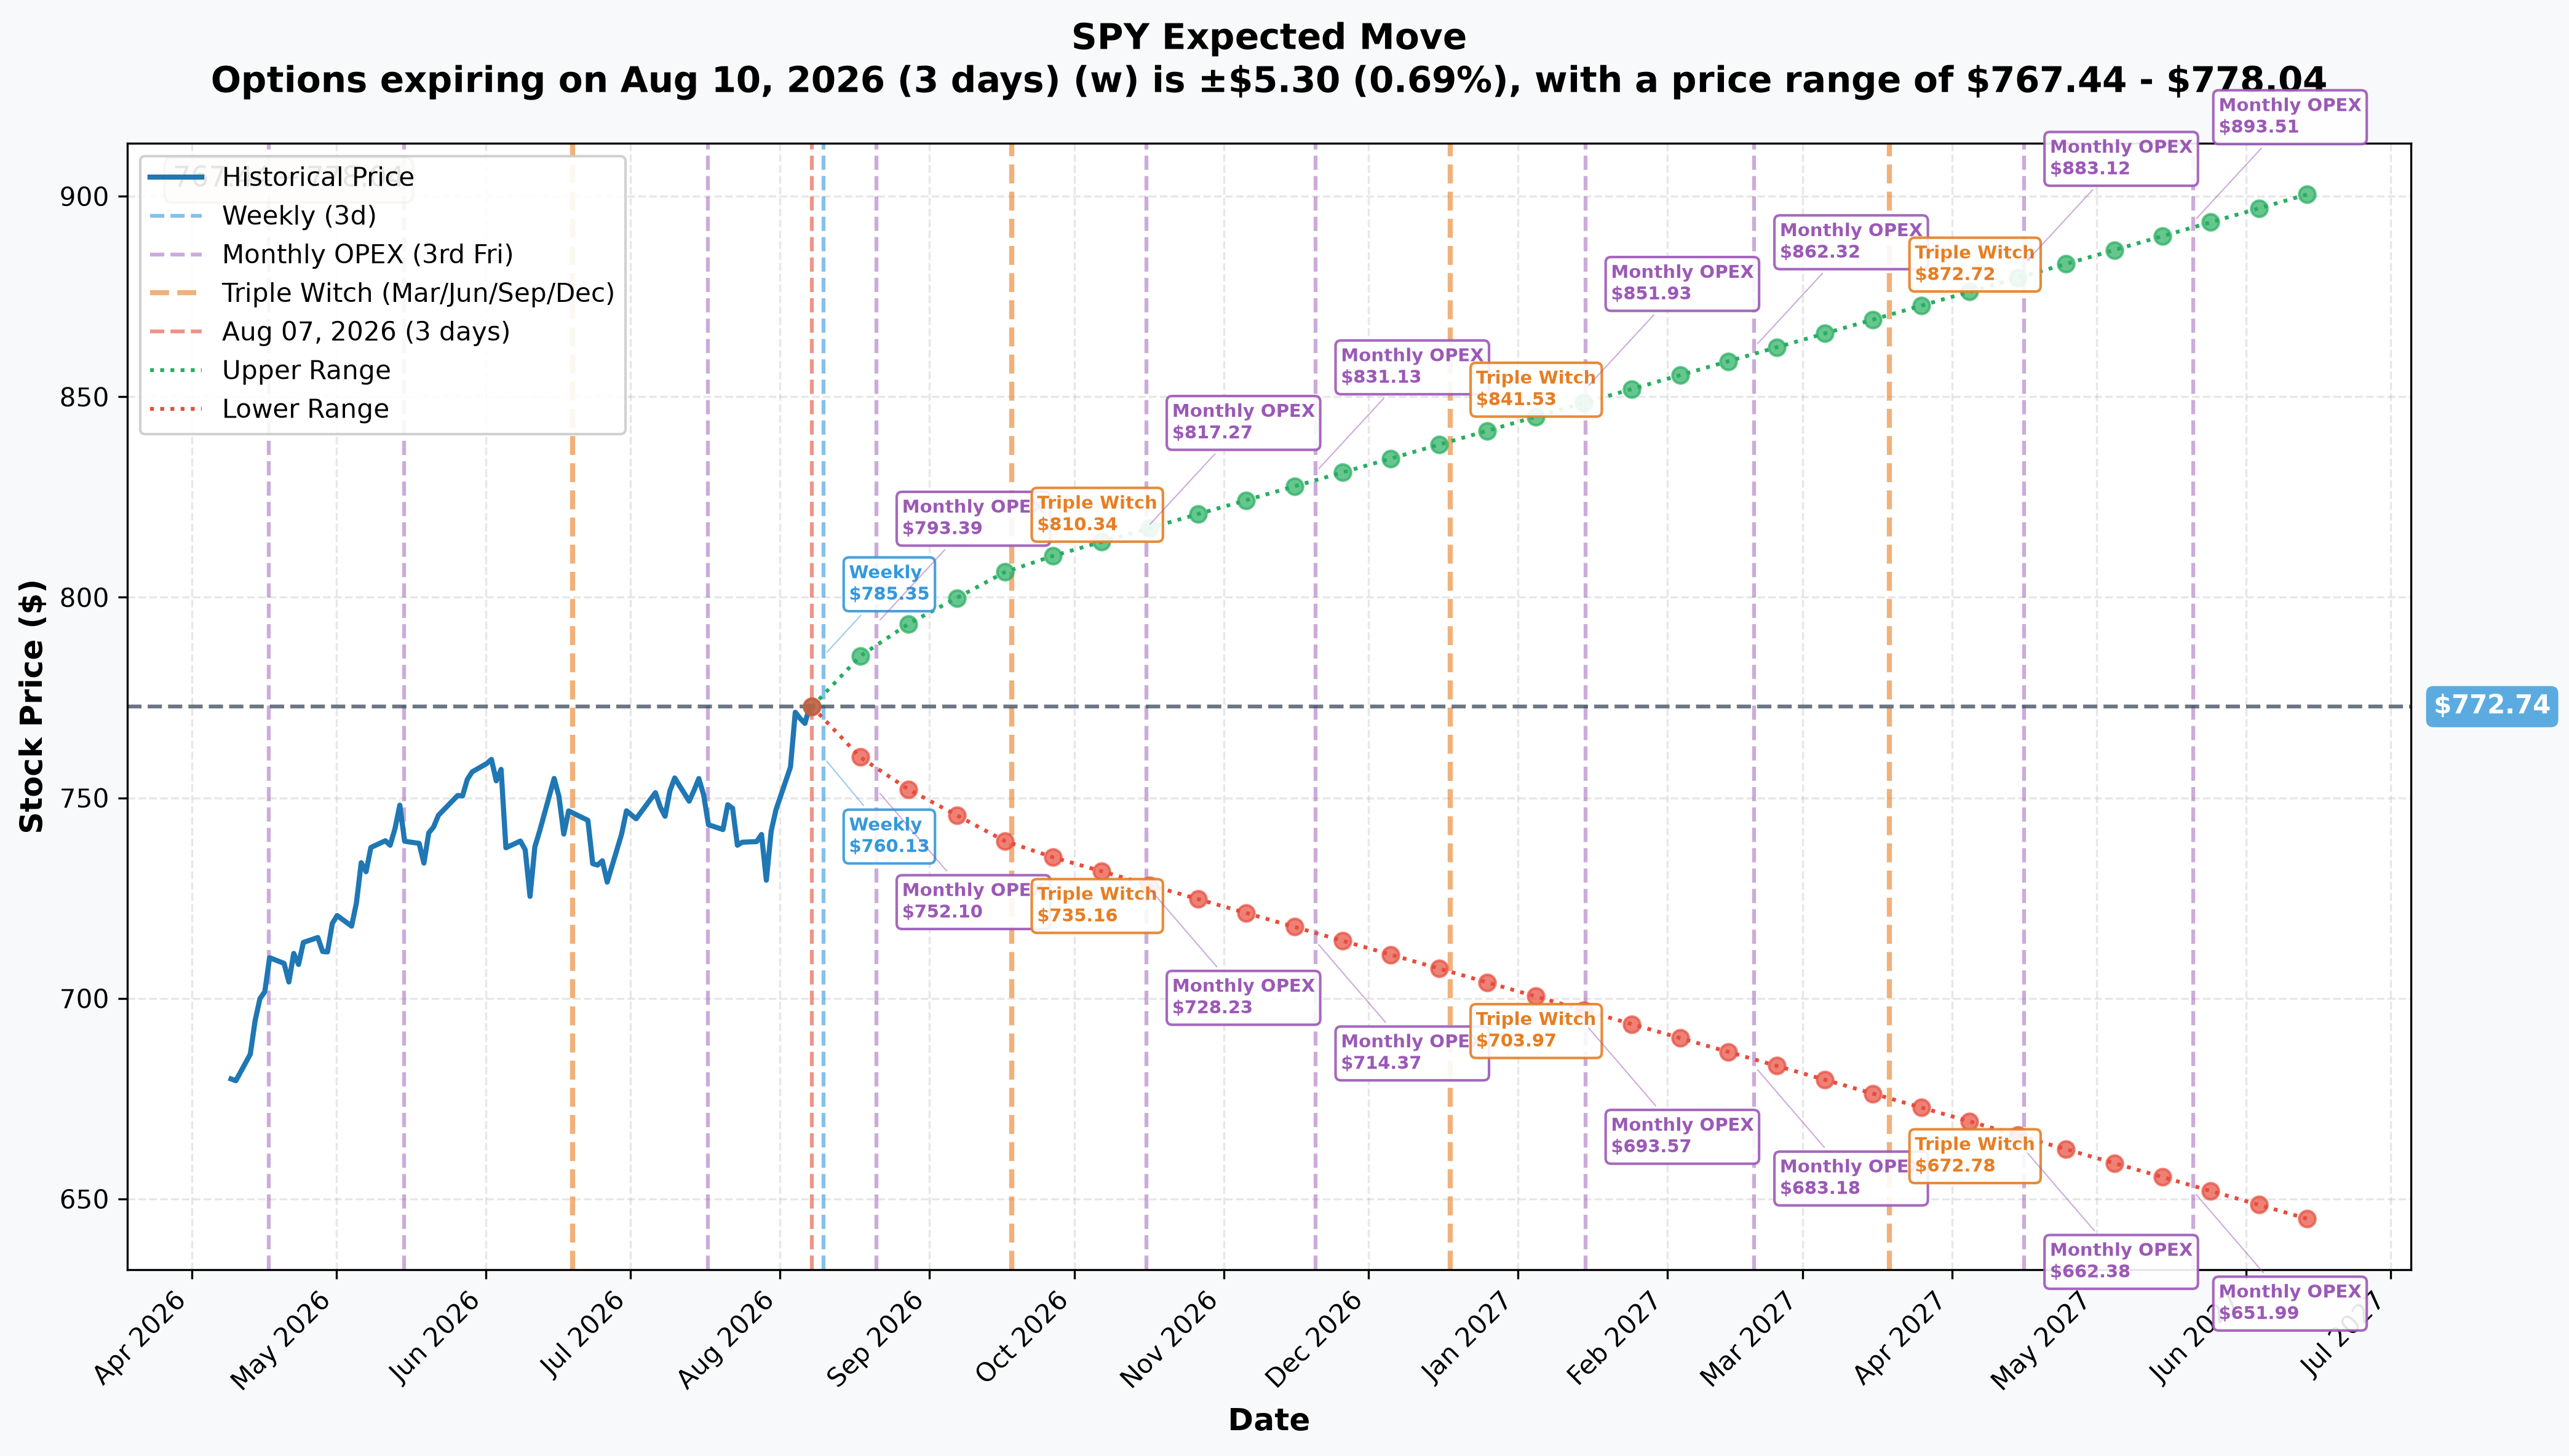
The chain prices ±0.69% by August 10 ($767.44–$778.04), ±2.17% by August 21 ($755.96–$789.52), ±4.51% by September 18 ($737.93–$807.57), and ±16.70% out to June 2027 ($643.67–$901.83).
Hold the August 21 range against the new strikes: $755.96–$789.52 brackets both $780 and $788. So the market considers that whole spread genuinely in play over the next two weeks — the $788 strike sits just inside the top of the expected range. This is not a lottery ticket; it is a contested zone.
And the $620 put? The September range bottoms at $737.93, nearly $118 above the strike. That is why it costs 54 cents.
📅 Catalysts
- The August 14 expiry contains no FOMC meeting. The July 29 meeting held at 3.50–3.75% on a 9–3 vote, with three officials preferring a hike (Federal Reserve). The next is September 15–16 (Federal Reserve) — inside the $620 put's expiry, outside the calls'.
- ⭐ NVDA reports August 26 — confirmed (StockAnalysis). At 7.37% of the index it is an index-level event — and it falls after the August 14 expiry, before September 18. A call spread expiring August 14 deliberately sidesteps it.
- Concentration is the risk nobody prices separately: the top ten holdings are 37.06% of the fund — Apple 7.64%, NVIDIA 7.37%, Microsoft 5.23%, Amazon 3.60%, Alphabet 3.05% (StockAnalysis). Two of them, NVDA and META, are on today's board in their own right.
- The index is within ≈0.5% of its 52-week high. Trading around $775–$788 here is trading at the top of the range.
👥 Four Ways to Read This
🎲 The YOLO trader — if the roll-up reading is right, the $780/$788 spread pays 6.7:1 for a +1.1% move in two weeks, and it sits above the entire gamma structure. That is genuinely attractive geometry. But you would be guessing at the direction of a package we have told you we cannot resolve — and guessing wrong puts you on exactly the opposite side.
📈 The swing trader — the cleanest map on today's board. $770–$772 support, $773–$775 resistance, the index 0.5% off its high, and the August 14 expiry deliberately clear of both the FOMC and NVIDIA's print. If SPY breaks $775 there is no gamma structure above it until well past $780.
💰 The premium collector — the $620 put is the instructive one: $2.7M collected for a strike 19.8% below spot that the September chain does not come within $118 of. That is what selling genuine tail risk pays at index level, and it is a thin reward for an obligation that only ever bites in a crash.
🌱 The beginner — three lessons now, and the third is the best one. First, the open-interest history is where the story lives: a strike sitting flat near 2,500 and then jumping to 87,968 told us Monday's buyers were today's sellers. Second, "proven open" is not "proven bullish" — the snapshot confirmed 138,230 new contracts at $780 and $788 and still cannot tell you which side of that spread was bought. Third, and this is the one this update earned: a big sale that fits inside existing open interest has three possible endings, not two. Closed, opened-as-a-new-short, or — the one that actually happened — neither: it simply changed hands. Volume of 136,560 moved the position by 1,605 contracts. When you see that, the honest word is "transfer."
⚠️ Honest Risk and Limits — What the Tape Cannot Prove
- The direction of the $780/$788 vertical is genuinely unresolved, and open interest did not settle it — exactly as we said in advance. Both readings remain live.
- ✅ The $775 leg is now settled, and against our read. It was not closed: open interest went 89,368 → 90,973. The exit was an inference and it was wrong. Note also that our "roll-up" lean on the new vertical rested partly on that exit — with the close refuted, that supporting argument is gone, which makes the vertical's direction less resolved than the original article implied, not more.
- We could not find the equity leg for the 14:23 call package despite its stock-plus-options marking. That is an unexplained gap and we are flagging it rather than filling it.
- The clip structure is unusual — each strike printed in a 1:1:3 size pattern within 180 milliseconds on one exchange. We have used the full tape totals, but we cannot rule out that some prints represent the same underlying order reported more than once.
- We do not know the participant or their broader book, and an index-level package is very often one leg of something much larger.
Nothing here is investment advice.
Last updated: August 10, 2026 — ⏳ provisional open/close flags resolved against the August 10 OPRA open-interest snapshot. The $775 close was refuted (transfer, not exit); the $780/$788 opens confirmed; the $620 put open confirmed at ≈39% of the print.