🛡️ STX $5.1M Collar Buys Protection Through a Window With Zero Company Catalysts
📅 2026-08-12 | 🤝 Negotiated Floor Block
✅ Updated 2026-08-13 pre-market — the next-day OPRA open interest confirmed both collar legs as opens, with the call side landing well above prediction. The $1,050 call rose 54 → 1,150 (+1,096) against a 706-lot print — 155% of size — and the $780 put rose 290 → 1,991 (+1,701) against 1,832 printed, capturing 93%. Both STO / BTO labels stand. See the ✅ RESOLVED box.
🎯 The Quick Take
A desk just paid a ≈$5.09M net debit to build a collar on Seagate Technology — sold 706 September 18 $1,050 calls and bought 1,832 September 18 $780 puts in one negotiated floor block. The sizing is deliberately lopsided: ≈2.6 puts for every call, meaning this is protection-first, not a balanced hedge. And the window it covers — September 18 — contains zero company-scheduled events. No earnings, no ex-dividend. Someone is paying real money to insure against a move that has nothing to do with a report card.
🏢 Who Is Seagate
Seagate Technology Holdings plc makes the hard drives that live inside cloud data centers — internal and external HDDs, SSDs, enterprise storage systems and NAS. Founded in 1978, domiciled in Singapore, roughly 30,000 employees, trading on Nasdaq. It sits in the Technology / Computer Hardware classification and is a member of both the S&P 500 (rank 58 by market cap) and the Nasdaq-100 (rank 30) — at that size, there's effectively no risk of being kicked out of either index.
The business today is really one story: nearline mass-capacity storage for AI-era cloud demand, built on Seagate's HAMR (heat-assisted magnetic recording) / Mozaic platform. Management describes it as being "well positioned to address strengthening exabyte demand through our Mozaic platform and differentiated HAMR technology roadmap" — Seagate's fiscal Q4 2026 results release.
Market cap: ≈$196B. The company pays a quarterly dividend of $0.740/share (≈0.34% yield — economically irrelevant to the option math here) and runs an unusual fiscal calendar: a 52/53-week year ending the Friday nearest June 30. FY2026 closed on July 3, 2026 and was reported July 28, 2026. That fiscal quirk matters directly to this trade — more on that below.
💰 The Trade in Plain English
At 14:58:06 ET, a single negotiated floor block printed both legs of a collar simultaneously on Seagate:
- SOLD 706 contracts of the September 18 $1,050 calls at $28.22 (≈$1.99M collected)
- BOUGHT 1,832 contracts of the September 18 $780 puts at $38.69 (≈$7.09M paid)
Net: a ≈$5.09M debit. Spot at the time of the print was $873.32.
| Time | Buy/Sell | Call/Put | Expiration | Premium | Strike | Volume | OI | Size | Spot | Option Price | Option Symbol |
|---|---|---|---|---|---|---|---|---|---|---|---|
| 14:58:06 ET | SELL | Call | 2026-09-18 | ≈$1.99M | $1,050 | 706 | 54 | 706 | $873.32 | $28.22 | STX20260918C1050 |
| 14:58:06 ET | BUY | Put | 2026-09-18 | ≈$7.09M | $780 | 1,832 | 290 | 1,832 | $873.32 | $38.69 | STX20260918P780 |
🤝 Mechanism: floor block — this was a negotiated, off-book print, not a lit sweep. The BUY/SELL labels above are reported from the print, not proven by an aggressor read (a negotiated block took no liquidity, so the usual %-across and IV-change checks don't apply here). No urgency, no known counterparty identity — just two parties who already agreed on price.
The sizing is the headline. 1,832 puts against only 706 calls is roughly a 2.6:1 weighting toward the downside leg. A textbook zero-cost collar sells enough call premium to fully fund the puts bought — this one didn't come close, and the buyer paid ≈$5.09M out of pocket to get more protection than the calls could pay for. That is a deliberate choice to prioritize the floor over the cap.
Strike geometry: the $1,050 short call sits ≈20.2% out of the money; the $780 long put sits ≈10.7% out of the money. Both are proven brand-new positions — read on.
✅ RESOLVED — Both Collar Legs Opened; the Call Strike Drew Extra Sellers
Updated 2026-08-13 pre-market. Resolving OPRA snapshot timestamped August 13 (reflects the August 12 close, after this print); baseline is the August 12 snapshot (reflects the August 11 close, before this print).
| Leg | Baseline (Aug-12) | Resolving (Aug-13) | Δ | Print size | What we published | Verdict |
|---|---|---|---|---|---|---|
| Sep-18 $1,050 call (sold) | 54 | 1,150 | +1,096 | 706 | "$1,050 call OI should rise from 54 to ≈760" | ✅ OPEN (STO) — 155% of size |
| Sep-18 $780 put (bought) | 290 | 1,991 | +1,701 | 1,832 | "$780 put OI should rise from 290 to ≈2,122" | ✅ OPEN (BTO) — 93% of size |
Both legs opened; neither fell. The put side captured 93% of its print, with ≈131 contracts matching against existing holders. The call side ran well past its target: +1,096 against a 706-lot print means roughly 390 contracts of additional call selling landed at $1,050 beyond the block we captured.
That widens the collar's ratio in the resolving book. Against the captured print the structure looked like 706 calls sold versus 1,832 puts bought; in open-interest terms the session added 1,096 calls versus 1,701 puts. The protective shape is unchanged, but more upside was written at $1,050 than this article recorded.
Unchanged: this was a negotiated floor block, so the BUY/SELL tags are reported rather than tape-proven, and open interest cannot see the share position the collar is presumably protecting.
🤓 What This Actually Means — Plain English
A collar is what you build when you already own a big stock position and want to protect it without paying the full sticker price for insurance. You do two things at once:
- Buy a put (here, the $780 strike) — this is your floor. No matter how far the stock falls, you can sell at $780.
- Sell a call (here, the $1,050 strike) — you collect premium for agreeing to give up any gain above $1,050. If the stock rockets past $1,050, you don't participate above that level.
The call premium is supposed to help pay for the put. In a "costless" collar, the two premiums roughly cancel out. This one didn't cancel out — it cost ≈$5.09M net, because the buyer bought roughly 2.6 times more puts than calls. That tells you two things: whoever built this either (a) owns a very large stock position and only wants to cap a fraction of it while insuring the whole thing, or (b) isn't hedging existing stock at all and this is simply a downside-skewed bearish bet, lightly financed by selling some upside. The tape alone cannot prove which — but the strike geometry (a cap set below where most analysts think the stock is headed) leans toward "protection first."
Either way: you give up unlimited upside above $1,050 in exchange for a hard floor at $780, and you paid real money for the privilege of that floor being extra-large relative to the cap.
📈 Charts
1-Year Performance
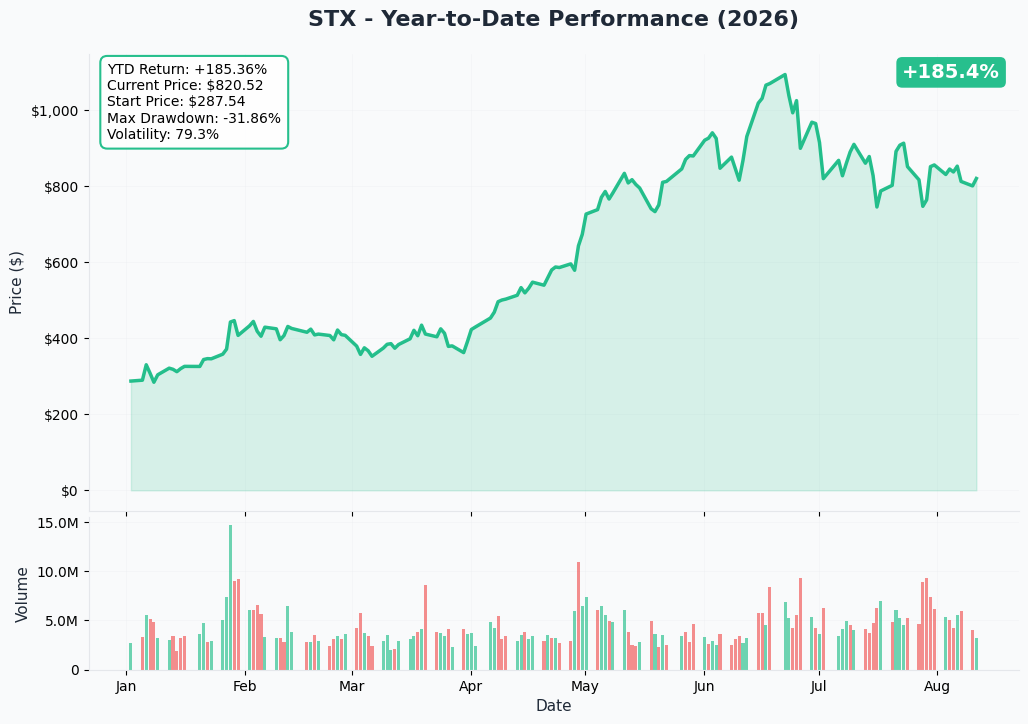
STX has been one of the market's most dramatic re-ratings over the past year, though our own daily-bar chart above shows a different magnitude than the sourced 52-week statistics page — see the honest flag on that discrepancy below. What both agree on: the stock is now sitting ≈24.6% below its 52-week high of $1,145.00, at $863.96.
Gamma Support & Resistance
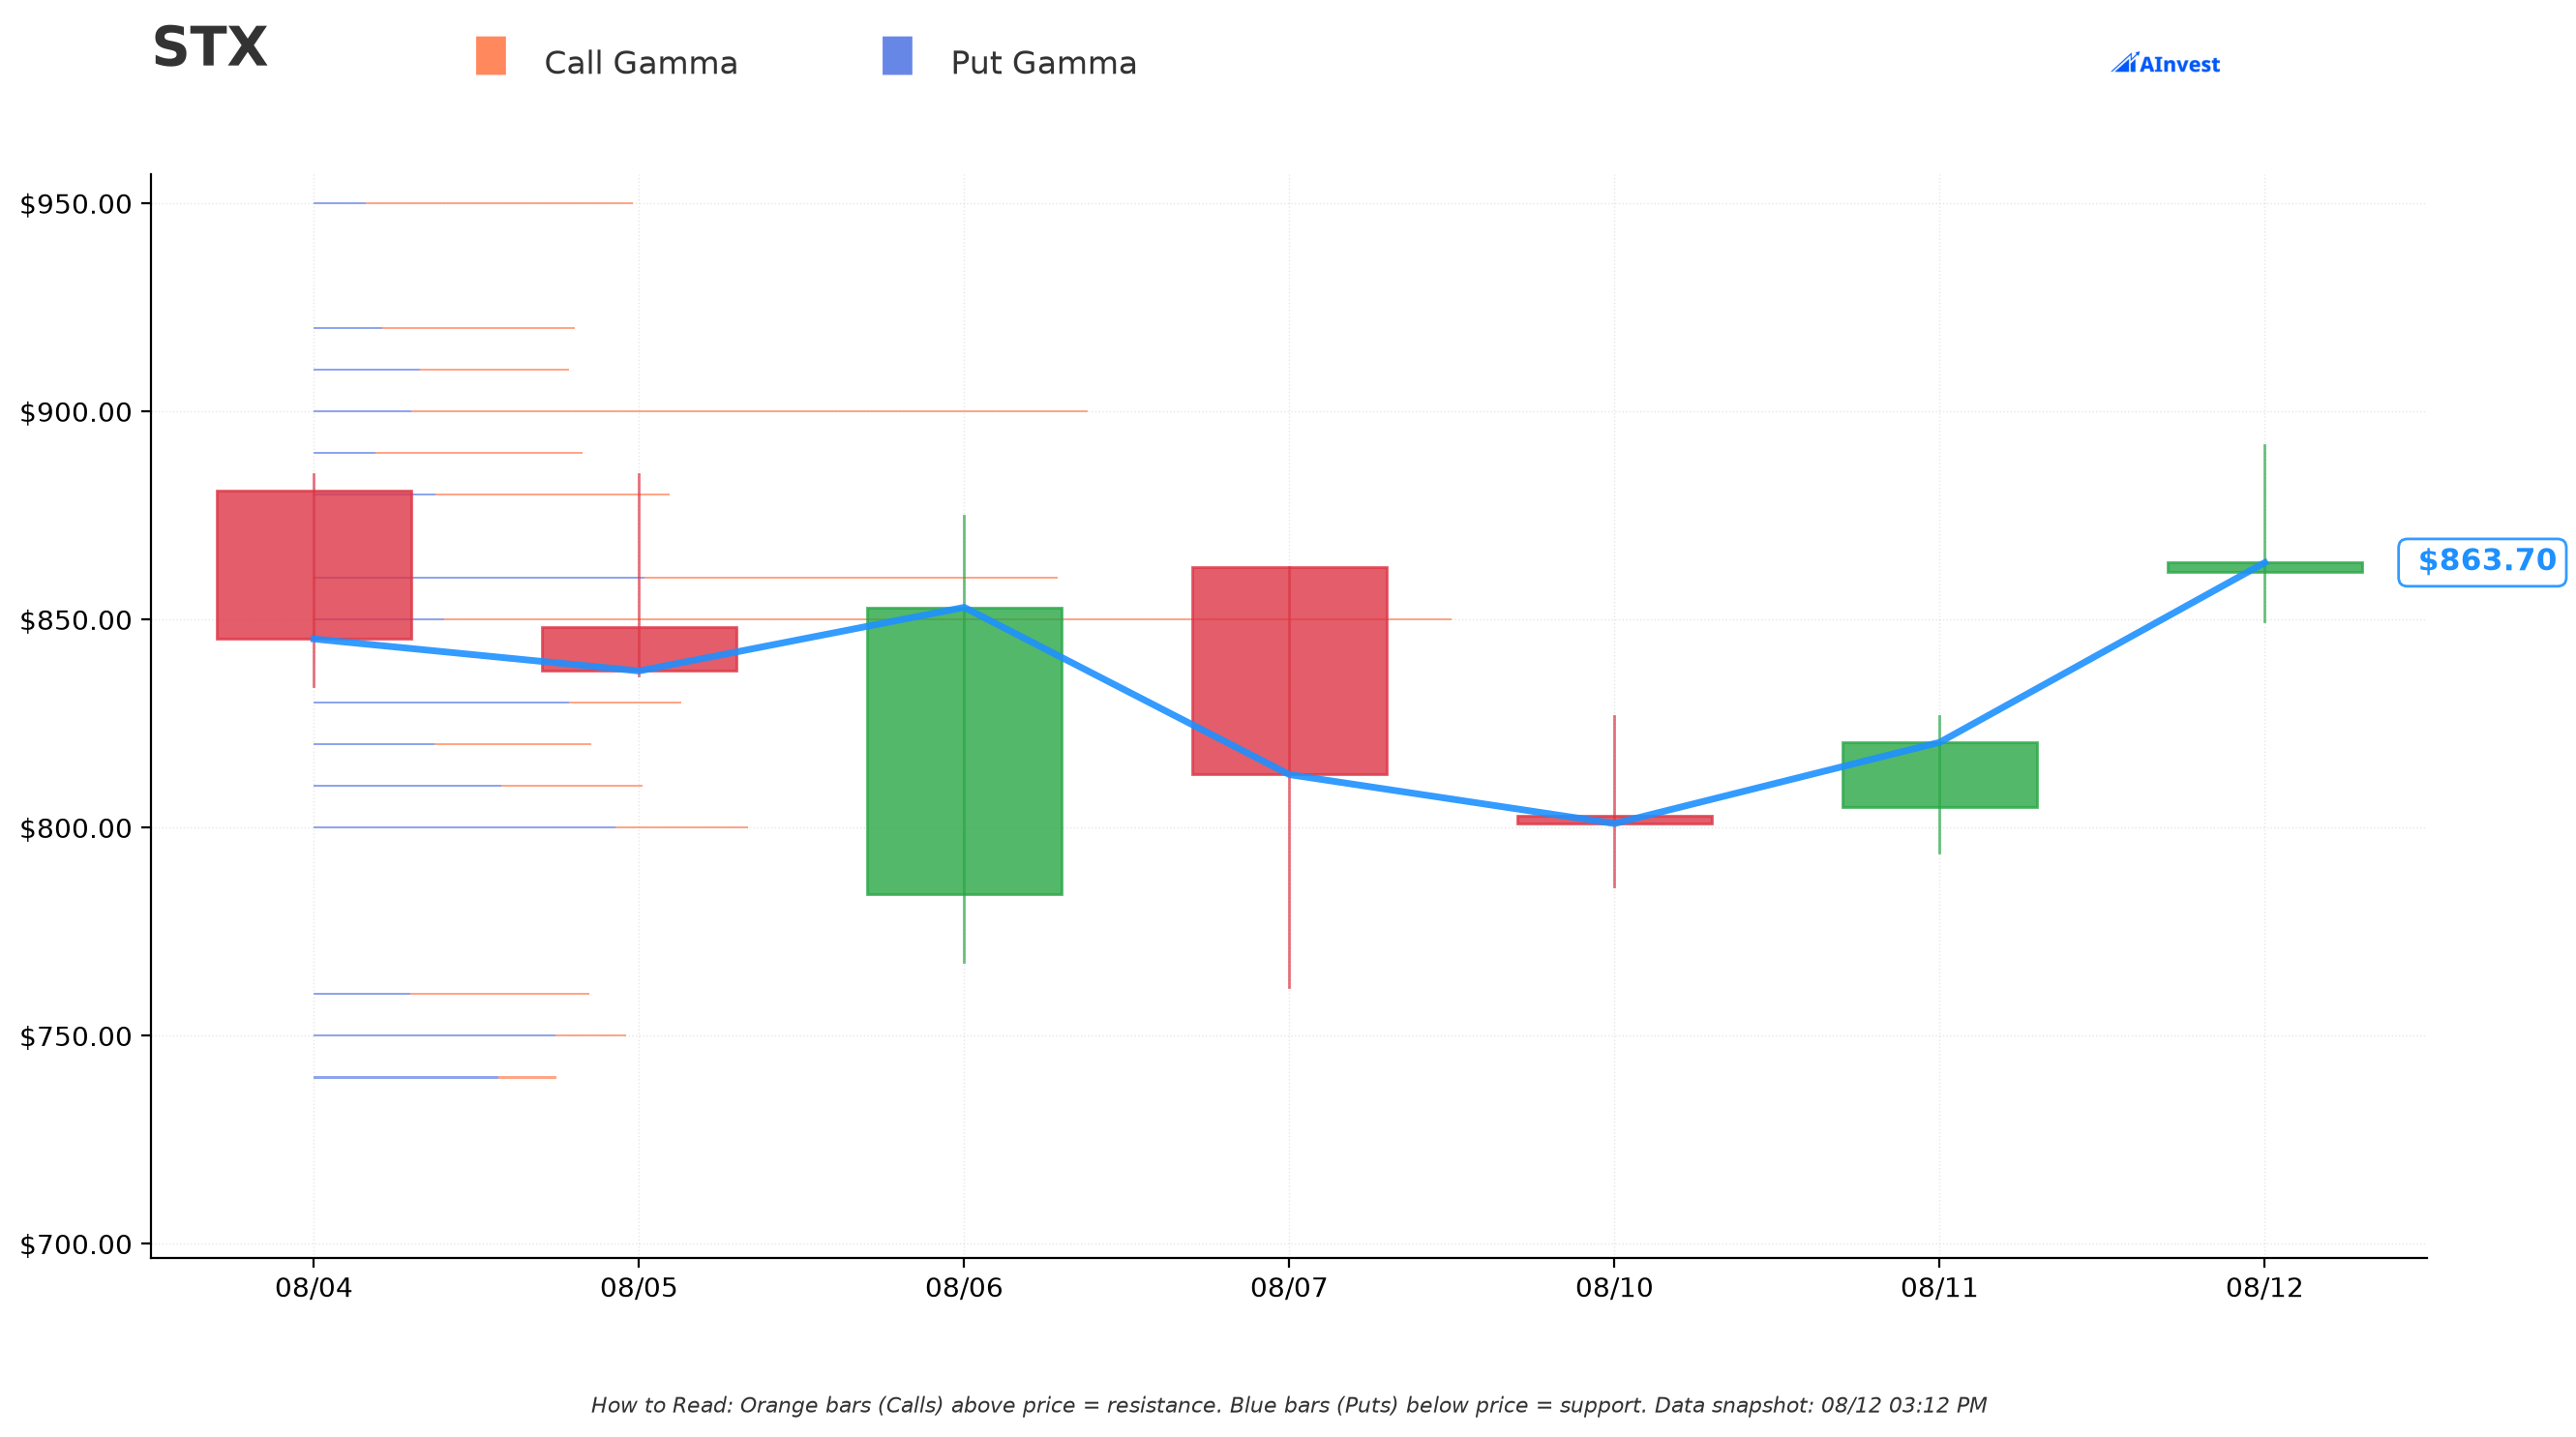
Spot at the time of this pull was $863.96. Being straightforward with readers here: the options chain did not return any material, well-defined gamma support or resistance levels for STX — no dominant call wall or put wall stood out against the broader distribution of open interest. Gamma exposure is spread thin across strikes from $500 to $1,200 without one strike concentrating enough contracts to act as a clear magnet or ceiling. Treat the gamma chart as informational context here, not as a source of hard price levels — the implied-move numbers below are the more useful guide for this trade.
Implied Move
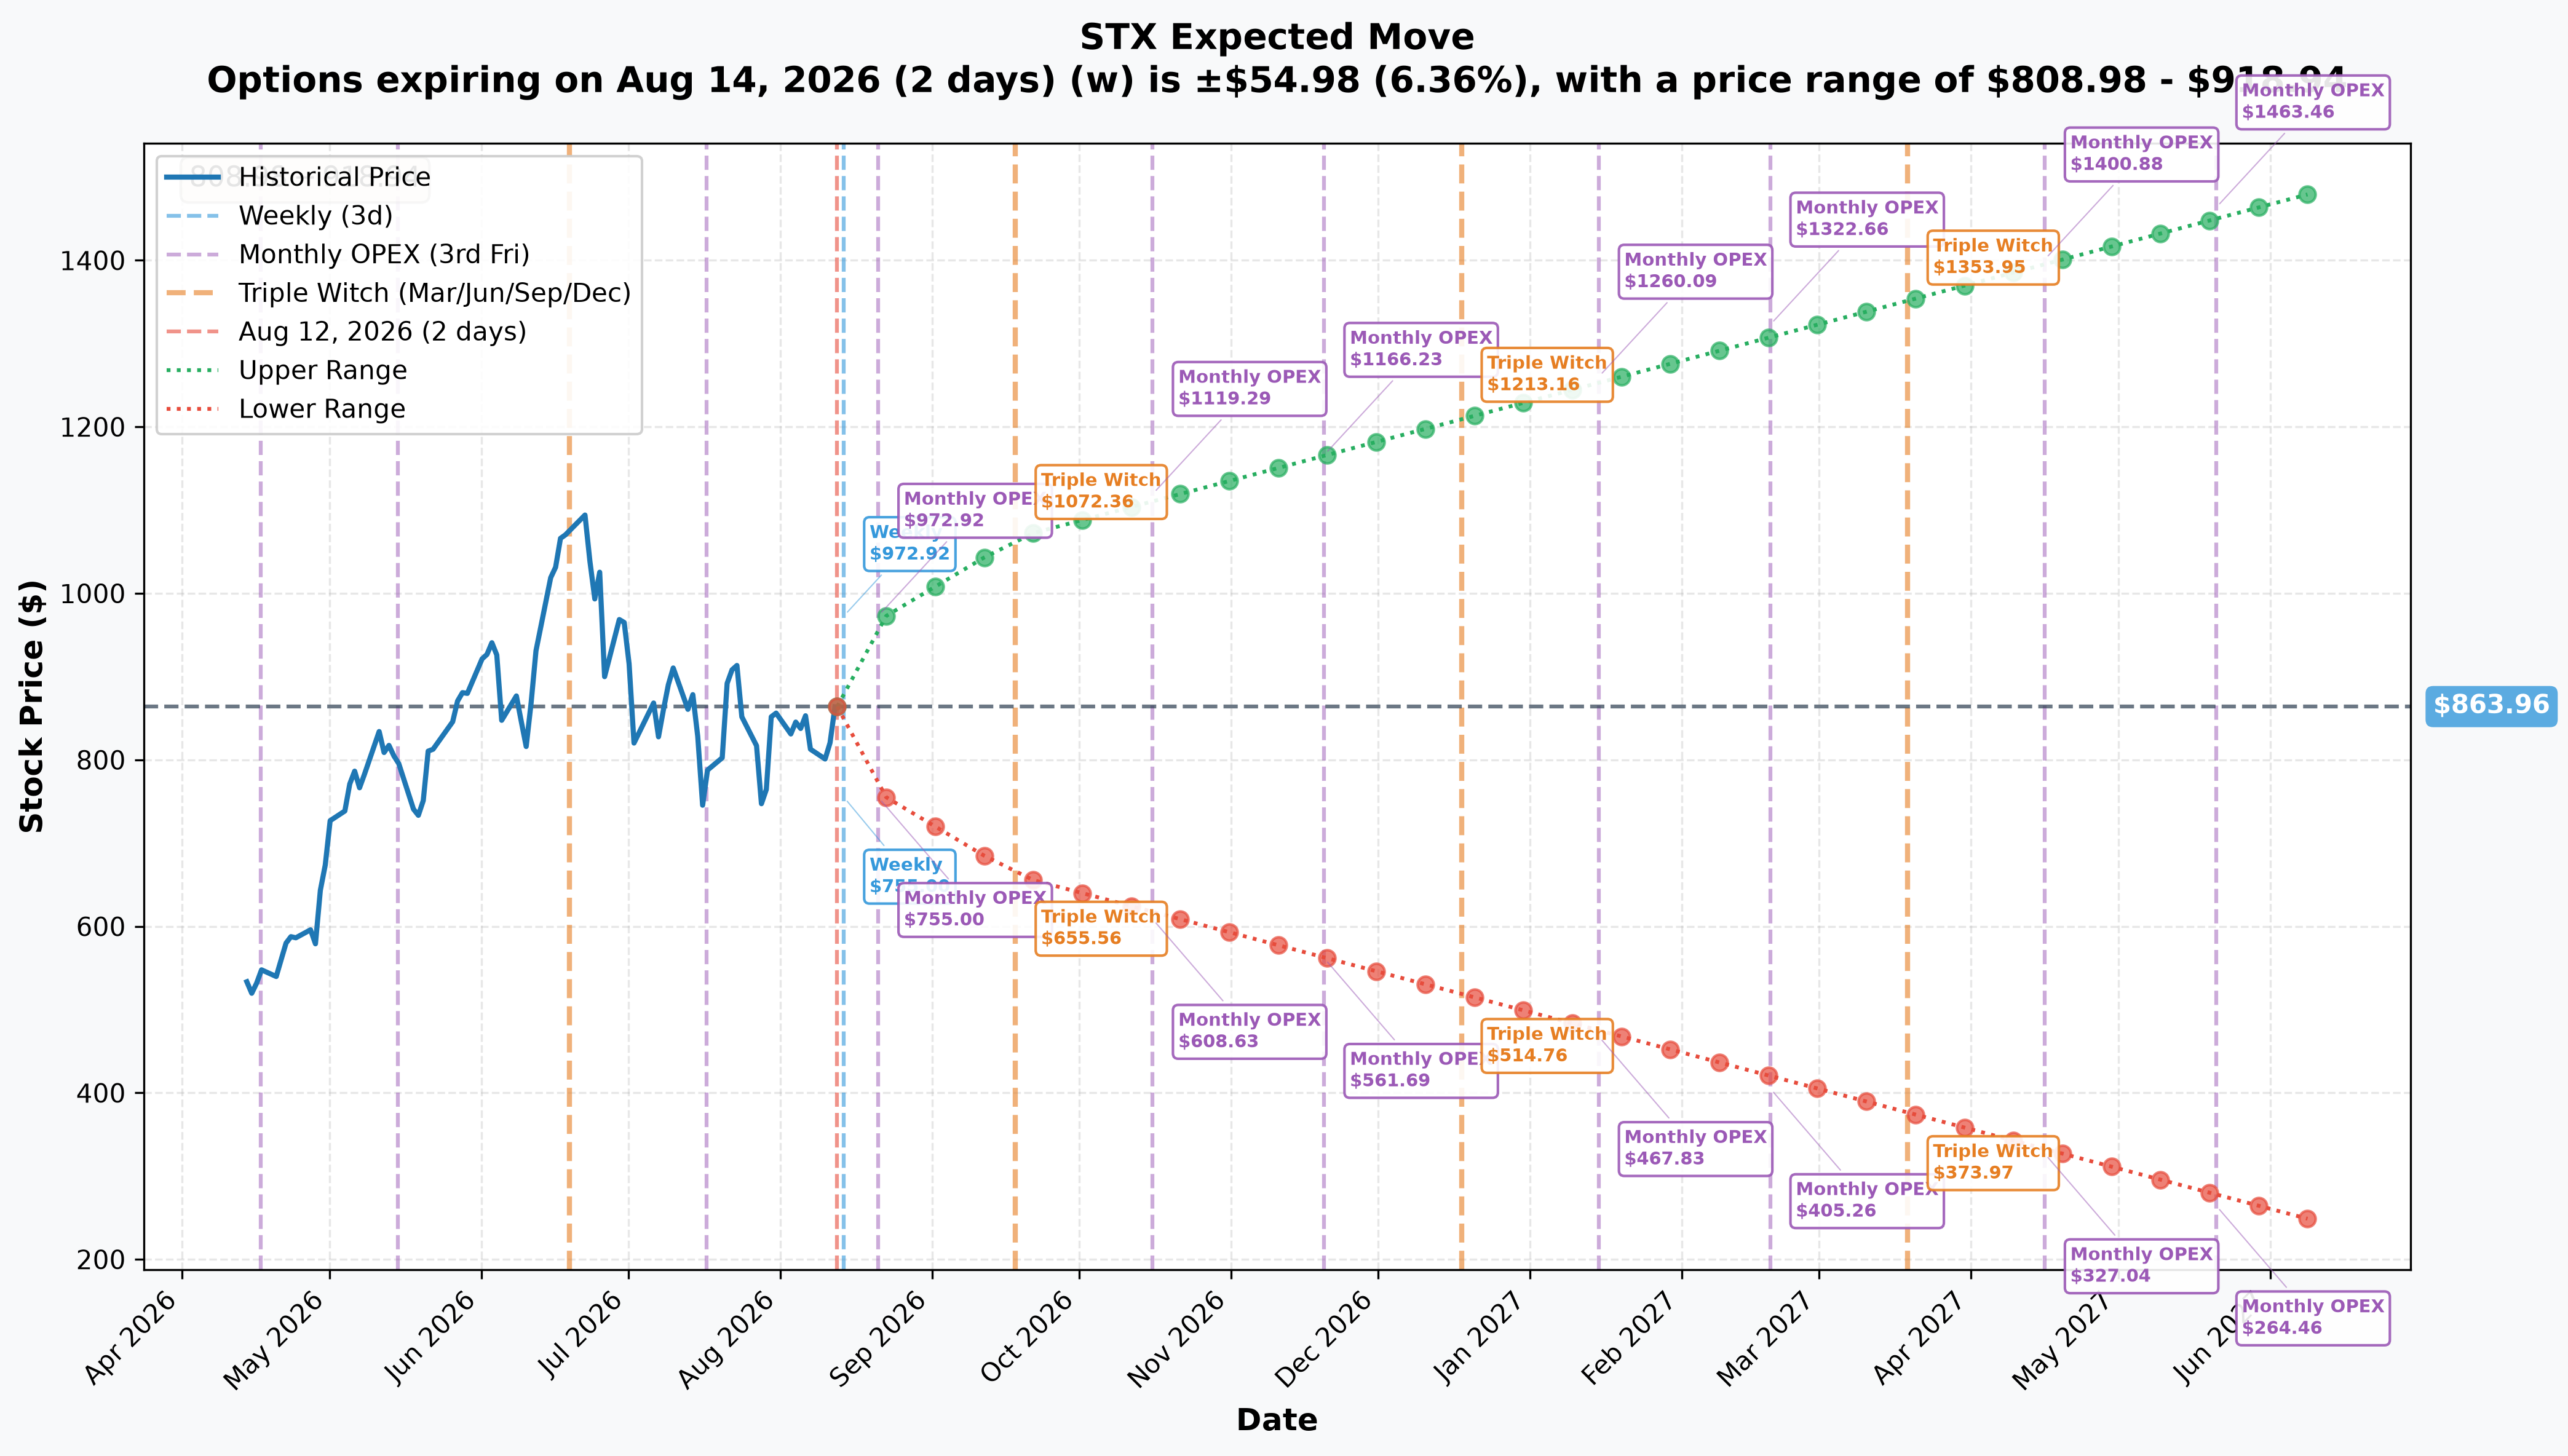
Pulled from the options market itself, not a guess:
- To August 14 (2 days): ±6.36% → range $808.98 – $918.94
- To August 21 (9 days): ±12.21% → range $758.51 – $969.41
- To September 18 (37 days, this trade's expiration): ±23.58% → range $660.25 – $1,067.67
This is the key inference: the September range straddles BOTH of the collar's strikes. The $780 put sits inside the implied-move range (not at the extreme edge), and so does the $1,050 call. In other words, the options market itself is pricing a real, non-trivial probability that STX touches either end — the market agrees this collar isn't hedging against some tail-risk fantasy, it's hedging against a plausible outcome on either side.
🎪 Catalysts
⚠️ The decisive finding: nothing scheduled falls inside this contract's life
Zero company-scheduled catalysts fall inside the September 18, 2026 expiration window. The next earnings report is estimated for ≈October 28, 2026 — and that date is explicitly NOT company-confirmed; MarketBeat's earnings page states Seagate "has not confirmed its next earnings publication date." That's roughly 40 days after this option dies.
The next ex-dividend date is September 24, 2026 ($0.740/share, per Seagate's own release and the dividend history page) — 6 days after expiry. So there's no dividend-driven early-assignment pressure on the short calls either.
Fiscal-calendar detail worth noting: Seagate runs a 52/53-week year ending the Friday nearest June 30. FY2026 ended July 3, 2026 and was reported July 28. Fiscal Q1 2027 doesn't even close until roughly October 2, 2026 — meaning this option expires ≈2 weeks before the quarter it's nominally exposed to has even finished. The contract cannot see the quarter, let alone the report.
That means this collar is a price/volatility hedge over an event-empty window — someone is protecting against unscheduled risk: broad AI-complex sentiment, a peer's stumble, or a macro shock. Not an earnings bet.
Why anyone would pay for that protection — the crowding evidence
Seagate is now a ≈$195.8–196.3B company trading at 59x trailing GAAP earnings and ≈23x forward (quote page, statistics page), with EV/EBITDA 46.2x, P/S 16.4x, P/B 85.9x, and a beta of 2.10. On the Street's FY2027 EPS estimate of $35.78 the stock is ≈24x — but that estimate already embeds +54% revenue growth and +130% EPS growth (forecast page). The entire valuation rests on that number holding up.
The sell-side is essentially unanimous: 18 Strong Buy, 4 Buy, 3 Hold, 0 Sell across 25 analysts (forecast page). Institutions own 92.87% of the float (MarketBeat). Short interest is only 3.34% — there's almost no short base left to squeeze, which also means there's very little contrarian buying pressure waiting in reserve if the stock does slip.
Most telling of all: insiders have sold ≈$144.5M over the past three months with zero purchases, including sales on August 4 and August 5, 2026 (MarketBeat). Management is doing, at the equity level, exactly what this collar does at the derivatives level — protecting gains rather than adding to them.
And the crack has already happened once, which is exactly why a floor makes sense here. STX sits ≈24.6% below its 52-week high of $1,145.00. Peer Western Digital is in worse shape — ≈43% below its own 52-week high of $799.87, despite being up 372% over the trailing year (WDC quote page). A quarter-to-half drawdown across this whole cohort happened without any earnings miss — pure multiple compression on sentiment. That's the risk this collar is priced against.
Two sharp arithmetic points worth sitting with:
- The $1,050 call cap sits ≈8.3% BELOW the 52-week high and below the $1,115.87 average Street target (forecast page) — the seller is capping upside below where the consensus thinks the stock is headed.
- The $780 put strike sits ABOVE the Street's lowest published target of $700 (forecast page) — meaning the floor doesn't even reach the most bearish view on the Street. If the bears are right, this protection runs out before the worst case does.
The bull case, for balance
This isn't a story of a business in trouble — the fundamentals are genuinely strong. Fiscal Q4 2026 beat hard: revenue of $3.63B against a $3.50B consensus, non-GAAP EPS of $5.71 against $5.10 consensus (Seagate's release). GAAP gross margin hit a record 52.3%, the fifth straight quarter of expansion — margins ran 37.4% → 39.4% → 41.6% → 46.5% → 52.3% over the past year.
Guidance for fiscal Q1 2027: $4.1B ±$100M revenue, $7.30 ±$0.20 non-GAAP EPS (Seagate) — roughly +13% sequential revenue growth on top of an already-strong quarter.
The HAMR ramp underneath all of it is real, per detailed post-earnings coverage (Blocks & Files, July 30, 2026): Mozaic 3+ is qualified and in production across all major cloud customers, Mozaic 4+ is ramping with the two largest global CSPs, and HAMR was ≈40% of the nearline exabyte shipment run-rate at fiscal year-end. Nearline exabytes shipped: 195, up 43% year over year, with price per exabyte up 10% YoY last quarter. Most strikingly: "the vast majority of our nearline exabytes are now allocated into calendar 2028," with customers pushing to extend planning horizons into 2029.
🎲 Four Ways Traders Might Read This
🎲 The YOLO trader
Betting outright on either strike alone is expensive and asymmetric — the $780 puts cost $38.69 ($3,869/contract), a real chunk of premium for 37 days. If you want cheap directional convexity here, look further OTM and smaller size; buying this exact structure outright would mean fighting an unanimous 18-Strong-Buy sell side and near-zero short interest working against you on the downside leg. This trade tells you protection is being bought, not that a crash is imminent — don't over-read conviction into it.
📈 The swing trader
The implied-move data is the useful signal here: ±12.21% to the August 21 monthly OPEX puts a realistic range of $758.51 – $969.41 on the table over the next nine trading days. That's a wide enough range to trade around without needing the September window at all — and it sidesteps the event-empty-catalyst problem this collar is built around. If you want to fade the recent +5–7% surge, the August 21 expiration lets you express that view without holding through the noisier 37-day window.
💰 The premium collector
Selling calls above $1,050 (where this desk sold theirs) or puts below $780 (where this desk bought protection) both look like reasonable premium-collection zones — you'd be selling into strikes the market itself is now treating as meaningful. But be honest about the risk: implied volatility of ±23.58% over 37 days is not cheap-vol territory, and a name with beta 2.10 that's already dropped 24.6% from its high can move fast in either direction. Any short premium here should be sized for that.
🌱 The beginner
This trade is actually a good real-world example of a collar — the exact structure worth learning first, because it's how professional and sophisticated retail investors protect gains rather than gamble on direction. The lesson: you don't need to predict the next move to manage risk on a big winner. If you're sitting on a stock that's run up hard, a collar (sell a call above the market, buy a put below it) locks in a range of outcomes instead of leaving you fully exposed. Don't try to build one this large — but understanding why someone would trade away unlimited upside for a hard floor is the important takeaway.
⚠️ Honest Limits — What We Don't Know
- We cannot prove this collar sits on top of an existing stock position. The tape shows two option legs, not shares. If there's no underlying stock, this is simply a downside-skewed bearish options position financed partly by selling calls — not portfolio insurance. Both readings are consistent with what printed.
- The BUY/SELL labels are reported from the print, not tape-proven by an aggressor read. This was a negotiated floor block that took no liquidity, so the usual %-across-the-spread and IV-change checks that confirm direction on lit trades don't apply here.
- Unresolved data conflict on the 52-week return: the catalyst research's sourced statistics page shows STX up +480.79% over 52 weeks, while our own one-year chart (built from daily bars) shows ≈+185% over the same period. These were not reconciled in this session and should not be treated as settled — flagging both rather than picking one. What both readings agree on without dispute: the stock has risen enormously and now sits ≈24.6% below its 52-week high of $1,145.00.
- The fiscal Q1 2027 consensus circulating on some data pages ($3.00 EPS / $3.7B revenue) is stale — it predates the company's own guidance of $7.30 / $4.1B and should not be used as the live bar for October.
- Gaps disclosed honestly: the exact GICS sector/industry classification string, the FY2026 10-K filing date, and any scheduled 2026 investor day or September conference appearance could not be verified — the relevant filing index and investor-relations pages returned errors during research. None of these affect the option-mechanics read above, but they're real gaps in the picture.
- The gamma chart returned no clear support/resistance levels for this name — don't lean on it for hard price targets; use the implied-move ranges instead.
This analysis is for informational purposes only and does not constitute financial advice. Options trading involves substantial risk of loss and is not suitable for all investors. Always do your own research and consider consulting a licensed financial advisor before trading.
Last updated: 2026-08-13 (pre-market) — the next-day OPRA open-interest snapshot confirmed both legs. Sep-18 $1,050C 54 → 1,150 (+1,096 against 706, 155% of size) and $780P 290 → 1,991 (+1,701 against 1,832, 93% of size): OPEN on both. Roughly 390 contracts of additional $1,050 call selling arrived beyond the captured block. The ⏳ callout was replaced with the ✅ RESOLVED box; no thesis or title change was required.