💵 Target's $146.5M Floor Package Left Zero New Open Interest — the Ex-Dividend Exercise Wave Took Every Leg
📅 2026-08-11 | 🤝 Floor Block Detected
🔄 Updated 2026-08-12 pre-market — the next-day OPRA open interest resolved all three legs, and not one of them opened. The two legs we called proven opens from size-versus-open-interest both went the other way: the January $75 call fell 183 → 18 where we predicted ≈5,183, and the December $80 call fell 186 → 3 where we predicted ≈5,186. The January $80 call was essentially flat, 10,708 → 10,375 (−333) against 10,000-plus contracts sold. Target's $1.16 ex-dividend date was August 12 (Target corporate), and the deep-in-the-money call book was swept by early exercise across both expirations. The article's own dividend caveat — that assignment could move open interest independent of any new trading — is exactly what happened. Net result: this $146.5M package created no surviving open interest at any strike. See the ✅ RESOLVED box.
🎯 The Quick Take
At 15:41:34 ET, a desk in Target printed a three-leg ≈$146.5 million gross package as a single negotiated floor block: sold 10,000 January-2027 $80 calls, sold 5,000 January-2027 $75 calls, and bought 5,000 December-2026 $80 calls — all at the same moment, all deep in the money, all priced at essentially pure intrinsic value.
Read the pricing before you read anything else into this trade. With spot at $151.91, every one of these strikes is roughly 50% in the money, and one leg — the January $75 call — printed eight cents below intrinsic. A call with no time value left in it is not a directional wager; it behaves like a share of stock. And this printed on the last session before Target's August 12, 2026 ex-dividend date, when exercise notices to capture that $1.16-a-share dividend were due. That combination — pure-intrinsic pricing plus the eve of an ex-date — is the textbook signature of a dividend-related financing or roll package, not a bullish or bearish view on Target. This package expresses no opinion on Target's direction.
🏢 Company Overview
Target Corporation (NYSE: TGT) is a US general-merchandise retailer operating ≈1,995 large- and small-format stores plus Target.com, selling apparel, beauty, food and beverage, electronics, home goods and household essentials. Headquarters is Minneapolis, Minnesota, with ≈415,000 employees.
- Market cap: ≈$69.23B
- Shares outstanding: 454.19M (float 440.04M)
- GICS sector / industry: Consumer Staples / Discount Stores (Consumer Staples Distribution & Retail)
- Fiscal calendar: Target runs a late-January fiscal year end — its fiscal Q4 (the actual holiday quarter) doesn't close until ≈January 30, 2027 and isn't reported until ≈early March 2027. That detail matters a great deal for this specific trade, and it's covered in the catalyst section below.
💰 What Just Happened
📊 The Trade, in Plain English
Three legs, one timestamp (15:41:34 ET), one package:
- 🔴 SOLD 10,000 January 15, 2027 $80 calls at $71.99 → ≈$71.99M collected
- 🔴 SOLD 5,000 January 15, 2027 $75 calls at $76.83 → ≈$38.42M collected
- 🟢 BOUGHT 5,000 December 18, 2026 $80 calls at $72.16 → ≈$36.08M paid
This printed as a 🤝 floor block — a manually worked, negotiated package with a known counterparty, not a lit-market sweep. No urgency language belongs anywhere near it.
Gross premium traded: ≈$146.5 million. Net credit: ≈$74.33 million. The net is the number that matters — gross double-counts the offsetting legs of a package like this one.
📋 Full Trade Details
| Time | Buy/Sell | Call/Put | Expiration | Premium | Strike | Volume | OI | Size | Spot | Option Price | Option Symbol |
|---|---|---|---|---|---|---|---|---|---|---|---|
| 15:41:34 ET | SELL | CALL | 2027-01-15 | ≈$71.99M | $80 | 17,413 | 10,708 | 10,000 | $151.91 | $71.99 | TGT20270115C80 |
| 15:41:34 ET | SELL | CALL | 2027-01-15 | ≈$38.42M | $75 | 6,815 | 183 | 5,000 | $151.91 | $76.83 | TGT20270115C75 |
| 15:41:34 ET | BUY | CALL | 2026-12-18 | ≈$36.08M | $80 | 6,040 | 186 | 5,000 | $151.91 | $72.16 | TGT20261218C80 |
A word on those BUY and SELL labels. This package printed at parity as a negotiated floor block, and a block struck at intrinsic value has no aggressor — nobody lifted an offer or hit a bid, because there was no meaningful spread to cross. The usual "which side was impatient" read simply does not apply here. The BUY/SELL labels above come from the captured flow, not from tape geometry, so treat the direction of each leg as reported rather than proven. What the tape does prove is the mechanism, the size, the price relative to intrinsic value, and the timing against tomorrow's ex-dividend date — and those four facts are what the analysis below rests on.
What the capture missed: the January $80 call actually traded seven prints of 500-plus contracts totalling 16,260 contracts on the tape, against the 10,000 shown in the table above — ≈6,260 contracts and ≈$45 million of additional floor flow beyond what we captured. The real footprint on that strike is larger than this table shows. Treat every dollar figure above as a floor, not a ceiling.
✅ RESOLVED — No Leg Opened, and the Two "Proven Opens" Were Both Wrong
Updated 2026-08-12 pre-market. Resolving OPRA snapshot timestamped August 12 (reflects the August 11 close, after this print); baseline is the August 11 snapshot (reflects the August 10 close, before this print).
| Leg | Baseline (Aug-11) | Resolving (Aug-12) | Δ | Print size | What we published | Verdict |
|---|---|---|---|---|---|---|
| Jan-15-2027 $80 call (sold) | 10,708 | 10,375 | −333 | 10,000 (16,260 on tape) | "watch whether OI falls or rises" | ⛔ NOT AN OPEN — flat; was STO ⏳ |
| Jan-15-2027 $75 call (sold) | 183 | 18 | −165 | 5,000 | "jump toward ≈5,183" | ⛔ NOT AN OPEN — prediction missed |
| Dec-18 $80 call (bought) | 186 | 3 | −183 | 5,000 | "jump toward ≈5,186" | ⛔ NOT AN OPEN — prediction missed |
Start with the misses, because they matter most. Two of these legs were labelled proven opens on the strength of the size-versus-open-interest test — 5,000 contracts against 183 and 186 outstanding is normally about as safe as that test gets. Both were wrong. Neither strike gained a single contract; both collapsed to near zero. A trade printing far above prior open interest does not guarantee surviving open interest when an ex-dividend exercise deadline sits the same night. That is the lesson from this one, and it is a genuine limitation of the size-vs-OI rule, not a data problem.
What actually happened: a market-wide deep-ITM exercise wave. Target's calls with negligible time value were exercised across both expirations ahead of the August 12 ex-date:
| Strike / expiry | Aug-11 | Aug-12 | Change |
|---|---|---|---|
| Dec-18 $70 call | 446 | 6 | −98.7% |
| Dec-18 $75 call | 341 | 13 | −96.2% |
| Dec-18 $80 call | 186 | 3 | −98.4% |
| Dec-18 $85 call | 658 | 434 | −34.0% |
| Dec-18 $90 call | 4,337 | 3,100 | −28.5% |
| Dec-18 $150 call (control) | 1,233 | 1,242 | +0.7% |
| Jan-15-2027 $70 call | 253 | 24 | −90.5% |
| Jan-15-2027 $75 call | 183 | 18 | −90.2% |
| Jan-15-2027 $80 call | 10,708 | 10,375 | −3.1% |
| Jan-15-2027 $85 call | 9,980 | 9,529 | −4.5% |
The pattern is unambiguous: deepest-in-the-money strikes wiped out, at-the-money and out-of-the-money strikes untouched. That is dividend-capture early exercise, not trading.
What this resolution can and cannot prove.
- ✅ Proven: the package left no new open interest at any of its three strikes. Every dollar of the ≈$146.5M headline changed hands without adding a surviving position to the market.
- ✅ Proven: the article's central thesis — that this was a dividend-structured package printed at pure intrinsic on the eve of the ex-date, not a directional bet on Target — is confirmed. The trade behaved exactly as a dividend-driven package should: it printed at parity and then evaporated at the exercise deadline.
- ⛔ Unprovable: open versus close on the desk's own side of any leg. Because the exercise wave hit every deep-in-the-money strike market-wide, strike-level open interest cannot separate "this desk closed" from "this desk opened and was immediately assigned." Those verdicts are retired as unresolvable, not resolved.
What changes below. The three legs' order-type labels are withdrawn. Any reading that treats the January $75 and December $80 legs as newly established positions should be dropped — those positions do not exist this morning. The analysis of the trade's purpose stands and is strengthened.
🤓 What This Actually Means — Plain English
Start with the extrinsic-value test, because it's the whole story. An option's price has two parts: intrinsic value (what you'd get if you exercised it right now) and time value (extra premium for the chance the option becomes worth even more before expiration). With TGT at $151.91:
- January $80 call: intrinsic value is $151.91 − $80 = $71.91. It printed at $71.99 — just $0.08 of time value.
- January $75 call: intrinsic value is $76.91. It printed at $76.83 — eight cents BELOW intrinsic.
- December $80 call: intrinsic value is $71.91. It printed at $72.16 — $0.25 of time value.
A call trading at, or even below, its intrinsic value has essentially given up any speculative premium. It behaves like a share substitute, not a lottery ticket. When you see "$146M of call selling" in a headline, the instinct is to assume someone is bearish on Target. That instinct is wrong here — a package built entirely from near-zero-extrinsic strikes isn't expressing a view on where the stock goes next; it's a financing or positioning maneuver.
Now the timing, which is the second half of the tell. Target's board confirmed an ex-dividend date of August 12, 2026 — tomorrow — at $1.16 a share. To capture a dividend, a call holder has to exercise the night before the ex-date; that deadline was tonight, August 11, the exact session this package printed. A deep-in-the-money call with almost no time value left is the single most common candidate for early exercise ahead of a dividend, because holding the option instead of the stock means forfeiting the cash payout. Whoever is long these calls has every incentive to exercise; whoever is short them should expect assignment.
Run the arithmetic: the desk is short 15,000 calls (10,000 Jan $80C + 5,000 Jan $75C) — that's 1,500,000 deliverable shares, or ≈$1.74 million of dividend exposure if all of it gets assigned and the short side ends up paying the dividend on stock it doesn't hold. The desk is also long 5,000 December $80 calls — 500,000 shares, or ≈$580,000 of dividend the other direction, cutting against the short side's exposure. Netting the two doesn't make the short side whole, but it shows both legs of the package are pointed at the same mechanic rather than at each other in some directional hedge.
We can prove the mechanism, the pricing, and the timing from the tape. We cannot prove the motive. This reads like a dividend-capture or financing package — someone rolling or restructuring an existing deep-ITM position around the ex-date rather than placing a new directional bet — but that is an inference, not a fact the tape can establish. There may be a share position, a customer facilitation, or a financing arrangement behind it that no public data source can see.
📈 Technical Setup — Where TGT Sits Right Now
YTD Chart
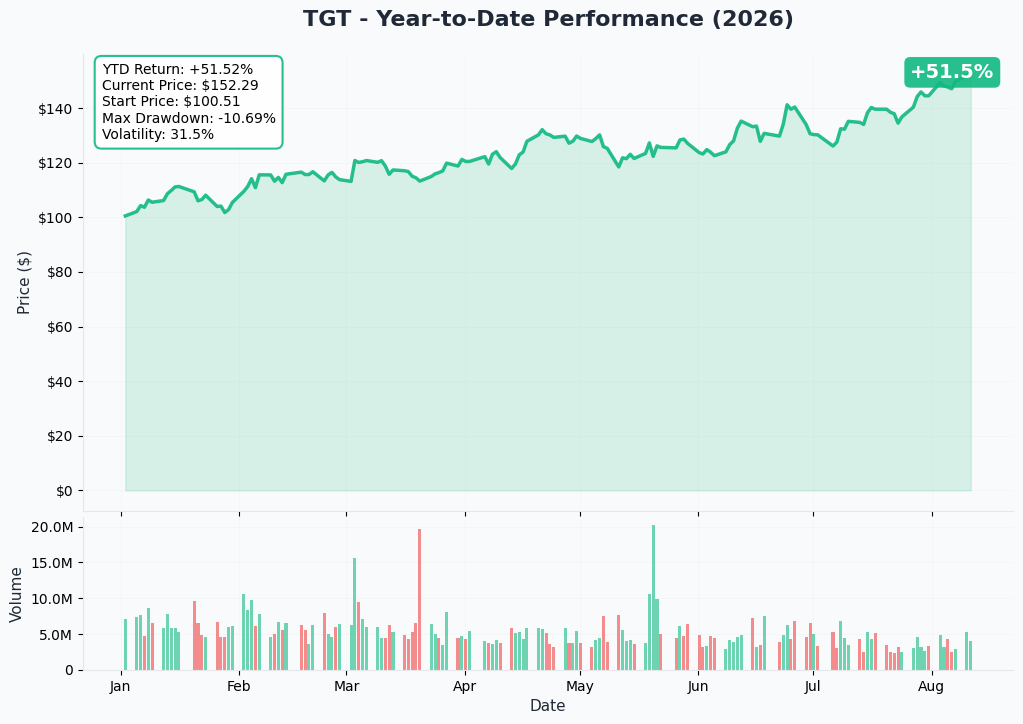
TGT is up ≈56.4% year-to-date, running from $97.77 to a $152.42 close on August 11, 2026, against a 52-week range of $83.44–$154.89. The stock sits well above both its 50-day (≈$135.86) and 200-day (≈$116.34) moving averages.
🔵🟠 Gamma-Based Support & Resistance
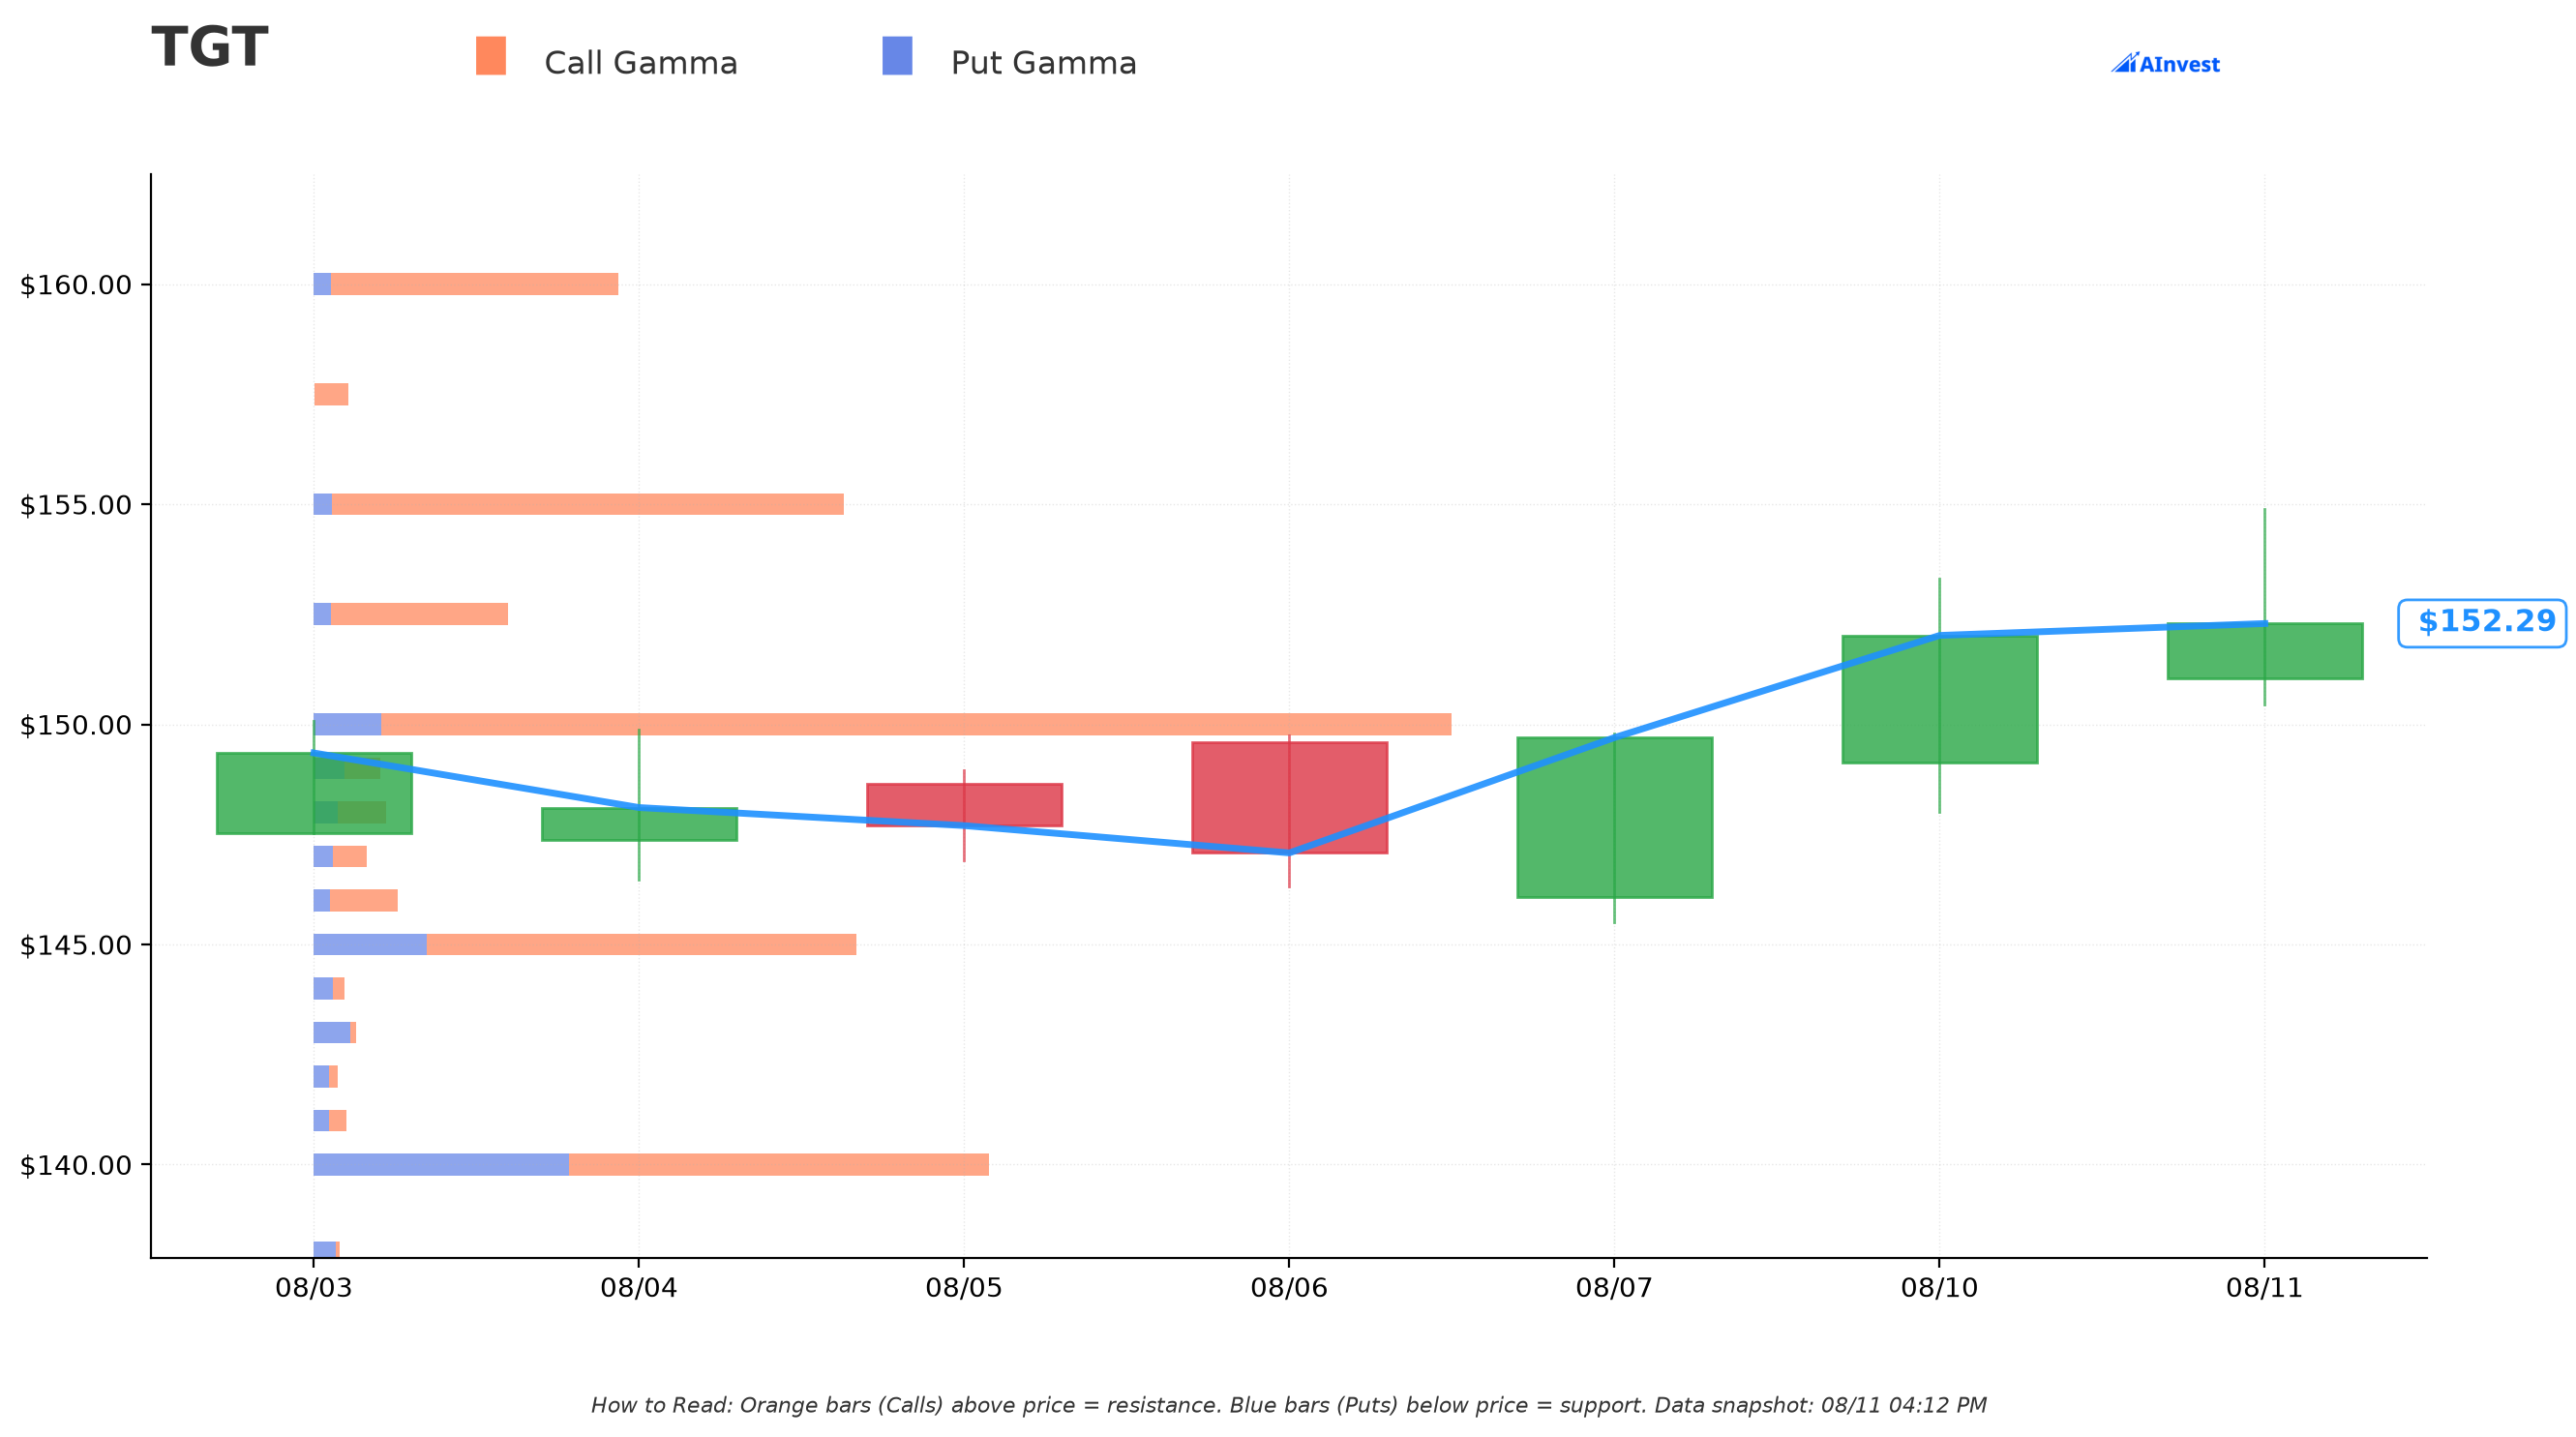
With spot at $152.29, the options market shows:
- 🔵 Support: $150 (Strong) — ≈1.5% below spot, net gamma 7.74, overwhelmingly call-side
- 🔵 Secondary support: $145 (Moderate), net gamma 2.34
- 🟠 Resistance: $155 (Moderate) — ≈1.8% above spot, net gamma 3.88
- 🟠 Secondary resistance: $160 (Moderate), net gamma 2.08
Read these with a grain of salt for this specific trade. These walls are built around strikes clustered near current spot; the calls in today's package sit ≈50% in the money at $75/$80, far outside this gamma structure. The near-the-money walls describe how TGT shares might behave day to day — they say almost nothing about how a deep-ITM, near-zero-delta-risk package like this one trades.
🎯 Implied Move
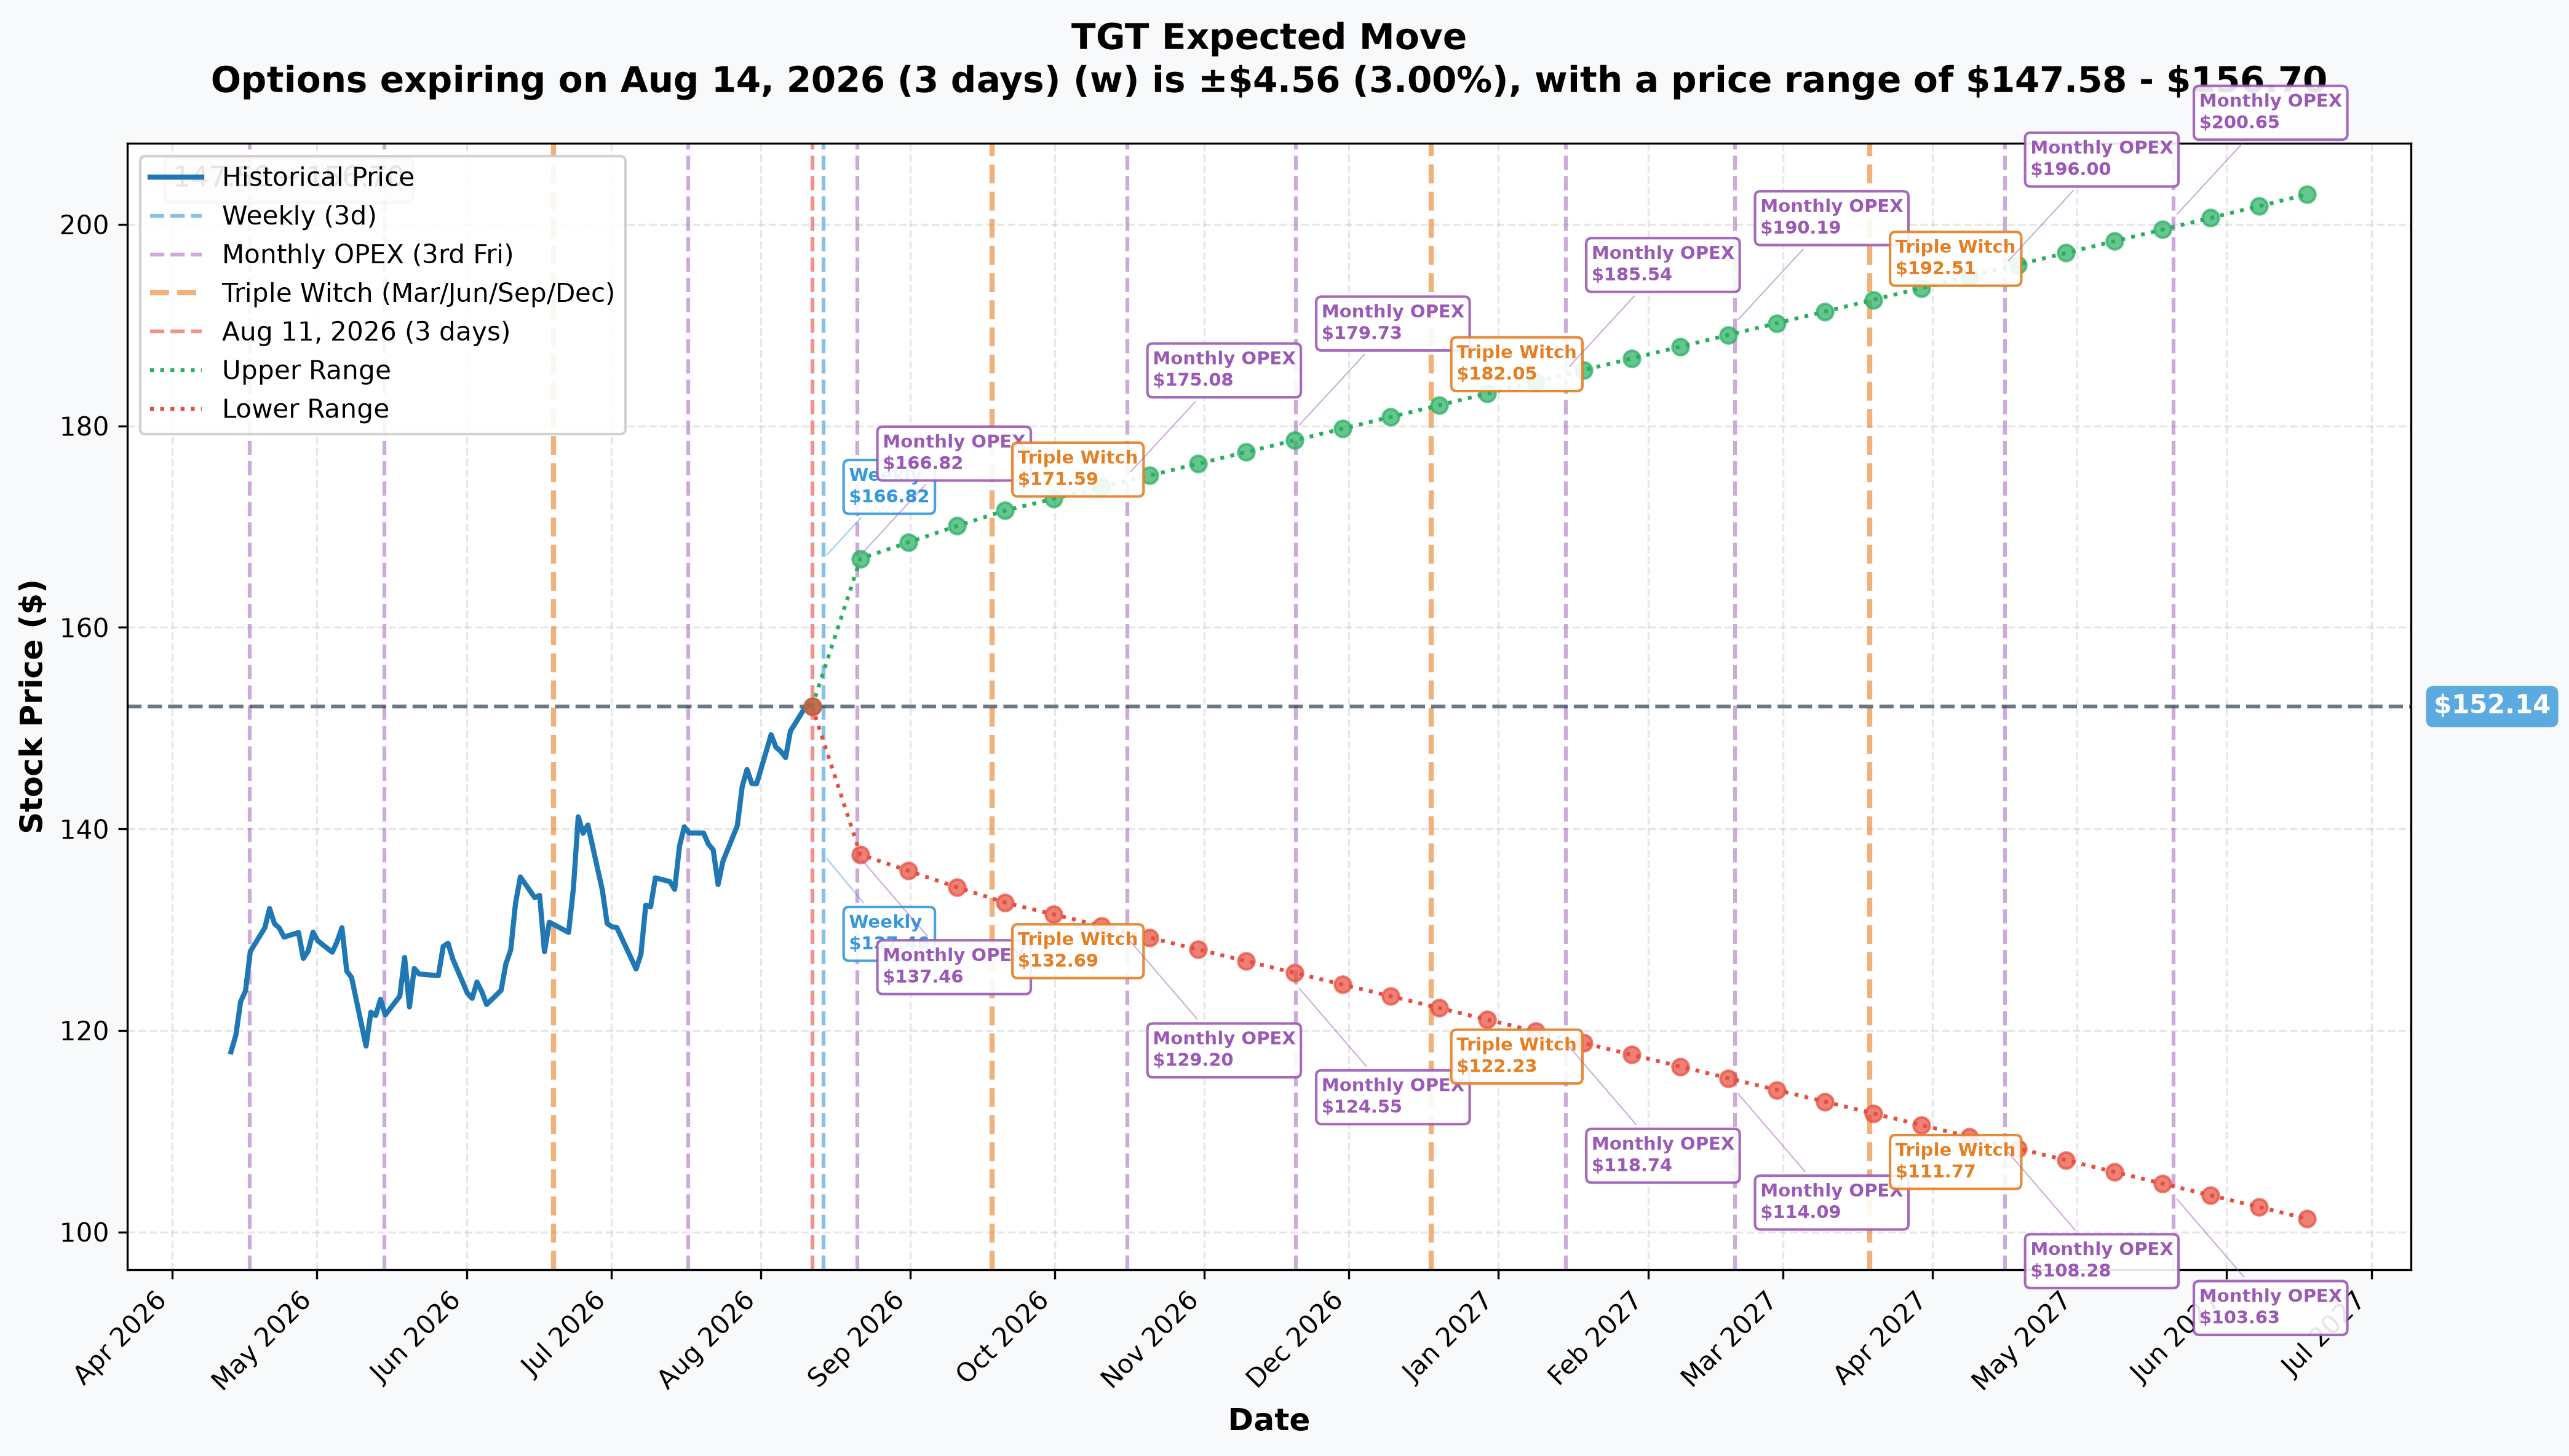
Standard-horizon implied moves off spot:
| Horizon | Expiry | Days | Implied Move | Range |
|---|---|---|---|---|
| Weekly | 2026-08-14 | 3 | ±3.00% ($4.56) | $147.58 – $156.70 |
| Monthly OPEX | 2026-08-21 | 10 | ±9.65% ($14.68) | $137.46 – $166.82 |
| Quarterly (Triple Witch) | 2026-09-18 | 38 | ±12.63% ($19.22) | $132.92 – $171.36 |
Every one of those ranges sits comfortably above the $75/$80 strikes used in today's package — this trade is not positioned anywhere near being at-the-money under any modeled scenario, which is exactly consistent with a share-substitute structure rather than a leveraged directional bet.
🎪 Catalysts — What's Actually Inside These Two Expirations
The package spans two expirations, December 18, 2026 and January 15, 2027. Keep those dates strictly separate from the catalyst dates below — mixing them up is the easiest way to misread this trade.
The one confirmed date that matters most
- August 12, 2026 — ex-dividend / record date, $1.16 per share, CONFIRMED. Board raised the dividend 1.8% from $1.14 on June 11, 2026, the 236th consecutive quarterly dividend since Target's 1967 IPO. Payable September 1, 2026. This is the date the entire structure of today's trade points at.
Recent fundamentals (already happened)
- Q1 fiscal 2026, reported May 20, 2026: comps +5.6% on traffic +4.4%, digital comps +8.9% (same-day delivery +27%), gross margin 29.0% (+80 bps) on lower markdown rates and retail-media mix (partially offset by "higher product costs" — Target has not quantified a tariff figure), adjusted EPS $1.71 vs $1.47 consensus (+32% YoY, beat by $0.24). Inventory $700M lighter year over year. Full-year sales-growth guide raised from ≈2% to ≈4%, with EPS guided to the high end of $7.50–$8.50.
- A dense analyst price-target chase — nine raises across Oppenheimer ($140→$170), JPMorgan ($129→$157), UBS ($144→$166), Citigroup ($133→$148), Wolfe Research (new $169), Bernstein ($124→$135), and Wells Fargo ($140→$165) — all in the twelve sessions before this flow. Yet consensus is still "Hold": 23 of 38 analysts, average target $140.11 (a second aggregator puts it at $138.74), roughly 8–9% below the $152.42 spot.
Inside the December 18, 2026 window (covers both expirations)
- ≈August 19, 2026 — Q2 fiscal 2026 earnings, ESTIMATED (not yet company-confirmed). Consensus EPS $2.28. Target typically confirms via a webcast notice ≈1 day prior.
- ≈September 9, 2026 — board likely declares the next quarterly dividend, ESTIMATED based on prior declaration cadence.
- ≈November 11, 2026 — a SECOND ex-dividend date, ESTIMATED at ≈$1.16. This is the same early-exercise mechanic repeating: if the short calls are still outstanding, they carry the same ≈$1.74M dividend exposure again.
- ≈November 18, 2026 — Q3 fiscal 2026 earnings, ESTIMATED. This is the pre-holiday quarter (August–October), not the holiday quarter itself — consensus EPS $1.81.
Inside the December 18 → January 15 stub — nothing at all
This four-week window contains zero scheduled Target catalysts. No earnings, no confirmed dividend event, no corporate action. A structure spanning exactly this stub is not expressing a view on any identifiable event.
What both expirations MISS entirely
A reader who assumes a December or January Target option is "about the holidays" is wrong. Target's holiday quarter is fiscal Q4, which doesn't even end until ≈January 30, 2027 — two weeks after the January 15 expiration — and isn't reported until ≈early March 2027, based on the March 3, 2026 report of the prior holiday quarter. Both legs of today's trade expire before a single holiday-season number is published. Neither expiration can be a bet on how Target's holiday season actually goes.
👀 Four Ways to Read This Trade
🎲 The YOLO trader
There's no leverage play here for you. These are ≈50%-in-the-money calls trading at pure intrinsic — as close to owning the stock outright as an option gets, with none of the convexity that makes options exciting. If you want a lottery ticket on TGT into the August 19 print, look at strikes closer to the money with real time value, not this.
📈 The swing trader
The informational content here is the calendar and the dividend mechanic, not a directional signal. If you already have a thesis on TGT into the August 19 earnings print or the November 18 pre-holiday update, this trade doesn't help or hurt it — it's a plumbing transaction, not a vote. What it does tell you: someone with a large existing deep-ITM position cared enough about capturing tomorrow's dividend, or about restructuring around it, to move $146.5M of gross premium the night before ex-date.
💰 The premium collector
There's essentially no time value left in any of these three strikes ($0.08, a negative eight cents, and $0.25) — nothing here to harvest by selling further premium at these strikes. The more useful lesson is the opposite: this shows you what a dividend-driven, near-zero-extrinsic package looks like on the tape, so you can recognize it next time and not mistake it for a directional short.
🌱 The beginner
This trade is a genuinely useful real-world lesson in three concepts: intrinsic value (what an option is worth if exercised right now), time value (the extra sliver you pay for optionality before expiration), and early exercise around dividends (a call holder who doesn't exercise a deep-ITM, low-time-value call before an ex-dividend date forfeits the cash dividend to the stockholder instead). A $146.5 million headline number sounds enormous, but the net cash that actually changed hands was ≈$74.33 million, and the entire structure is built around a single mechanical event — tomorrow's dividend — not a bet on where Target's stock goes next.
⚠️ Honest Limits — What We Actually Know vs. What We're Inferring
- Proven from the tape: the size, strike, price, and timestamp of all three legs; that this printed as a negotiated floor block, not a lit sweep; that the January $75 call and December $80 call are proven opens against prior open interest of 183 and 186; that all three legs are priced at or below intrinsic value; that August 12, 2026 is Target's confirmed ex-dividend date at $1.16.
- Not provable from today's tape: whether the January $80 call — 10,000 in the captured package, 16,260 across the full tape footprint we found — represents new short positions being opened, existing ones being closed, or some mix of both. Size sits below prior open interest of 10,708. Tomorrow's ≈06:30 ET open-interest snapshot is the definitive test, and assignment tied to tomorrow's ex-dividend date can move that number independent of new trading.
- Reported, not proven: which side of each leg was the buyer and which the seller. A negotiated block priced at intrinsic has no aggressor, so the BUY/SELL labels come from the captured flow rather than from anything the tape can independently confirm.
- Unknowable from any public source: who holds this position, their cost basis, whether there's an offsetting stock position or hedge behind it, whether the desk on either side is a market maker facilitating a customer order versus a proprietary position, and whether assignment on the short calls actually occurs tonight versus being managed some other way. The dividend-capture read is the most coherent explanation the tape and calendar support — it is an inference, not a proven fact.
- Not a directional signal. Nothing about the pricing, structure, or timing of this trade should be read as bullish or bearish conviction on Target. It is built around a specific, dated mechanical event — tomorrow's ex-dividend date — not a view on where the stock trades next.
Options trading involves substantial risk and may not be suitable for all investors. This analysis is for informational purposes and is not a recommendation to buy or sell any security.
Last updated: 2026-08-12 (pre-market) — the next-day OPRA open-interest snapshot resolved all three legs and none opened. Jan-15-2027 $80C 10,708 → 10,375 (−333), Jan-15-2027 $75C 183 → 18 (−165), Dec-18 $80C 186 → 3 (−183). The two legs published as proven opens from size-vs-OI (predicted ≈5,183 and ≈5,186) both missed — Target's $1.16 ex-dividend date was 2026-08-12 and a market-wide deep-ITM call exercise wave swept both expirations. The package left no surviving open interest at any strike; the dividend-structure thesis is confirmed, while open-versus-close on this desk's own side is retired as unresolvable. The title, the order-type verdicts and the proven-open claims were updated; the ⏳ callout was replaced with the ✅ RESOLVED box.