🔄 TTWO — CORRECTED: This Was Not a New Bear Spread. It Was an Existing Bull Call Spread CLOSED, One Day Before Earnings
🔄 INVERSION — updated 2026-08-07 pre-market. The original read was wrong, and the next-day open interest proves it. We published this as an $8.9M bear call spread being opened into earnings, and flagged both legs ⏳ provisional because each traded below its existing open interest. The resolving OPRA snapshot shows open interest collapsing on both strikes: the September $270 call fell 27,182 → 6,025 (−21,157) and the $310 call fell 28,250 → 6,603 (−21,647). Nothing was opened. A desk sold to close a long $270 call and bought to close a short $310 call — it was exiting an existing bull call spread the day before the print, not putting on a new bearish one. The $8.9M is exit proceeds, not premium collected for risk, and the "$70.7M maximum loss" in the original text does not exist. See the ✅ RESOLVED box below; the title, thesis and risk sections have been rewritten.
Take-Two Interactive Software publishes video games through Rockstar Games, 2K and Zynga. Sector: Communication Services / Electronic Gaming & Multimedia. Market cap $43.75B, stock at $234.00, down 0.39% (StockAnalysis). Follow it on the Take-Two ticker page.
The Trade in Plain English
Four minutes after the opening bell — 09:34:23, stock at $238.40 — one order crossed as a multi-leg auction:
Sell 19,905 September-18 $270 calls at $6.99, and buy 19,905 September-18 $310 calls at $2.52.
On the tape that geometry reads as a bear call spread — collect $13,913,595 on the $270 strike, pay $5,016,060 for the $310 wing, keep a net credit of $8,897,535. That is what we published, and it was wrong. The next-day open interest (✅ RESOLVED box below) shows both strikes shrinking by more than 21,000 contracts each. The identical geometry, run in reverse, is how you unwind a long $270/$310 bull call spread: you sell the long lower call and buy back the short upper one. The $8.9M credit is what the desk received for getting out, not what it was paid to take on new risk.
| Time | Buy/Sell | C/P | Expiration | Strike | Size | Volume | OI (prior) | Option Price | Premium | Spot | Option Symbol |
|---|---|---|---|---|---|---|---|---|---|---|---|
| 09:34:23 | SELL | CALL | 2026-09-18 | $270 | 19,905 | 25,277 | 27,182 | $6.99 | $13,913,595 | $238.40 | TTWO20260918C270 |
| 09:34:23 | BUY | CALL | 2026-09-18 | $310 | 19,905 | 25,049 | 28,250 | $2.52 | $5,016,060 | $238.40 | TTWO20260918C310 |
Net: an $8,897,535 CREDIT. Because the package was an exit (confirmed below), that credit is realised proceeds, and the delta it removed — ≈+330,423 shares of long call exposure taken off the book — is the number that matters, not a new short.
✅ RESOLVED — Both Legs CLOSED. The Read Inverted.
Updated 2026-08-07 pre-market. The ≈06:30 ET OPRA snapshot (which reflects the August 6 close) has published, and it landed on the branch we explicitly warned about.
| Leg | Baseline OI (Aug-6 snap) | If opened | If closed | Actual (Aug-7 snap) | Δ | Print size | Δ as % of print | Day vol | Verdict |
|---|---|---|---|---|---|---|---|---|---|
| Sep-18-2026 $270 C (sold 19,905) | 27,182 | ≈47,100 | ≈7,300 | 6,025 | −21,157 | 19,905 | ≈−106.3% | 26,044 | 🔄 CLOSE (STC) — was ⏳ provisional |
| Sep-18-2026 $310 C (bought 19,905) | 28,250 | ≈48,200 | ≈8,350 | 6,603 | −21,647 | 19,905 | ≈−108.8% | 25,100 | 🔄 CLOSE (BTC) — was ⏳ provisional |
Both strikes were gutted. Open interest fell by 21,157 and 21,647 contracts — more than the 19,905-lot print on each side, meaning some additional closing rode alongside the headline block. Open interest at the $270 strike had sat in a tight band near 27,200 for at least three weeks; in one session it dropped 78%.
Read the two legs together and the structure names itself. A sale that reduces open interest is a sell to close — the seller was long those $270 calls. A purchase that reduces open interest is a buy to close — the buyer was short those $310 calls. Long the lower strike, short the higher strike, same expiry: that is a bull call spread, and on August 6 it was taken off.
So the direction of the story flips completely. This was not a desk fading Take-Two into its print. It was a desk that had been bullish — positioned for a move toward $270–$310 by September — taking that position off the table one day before earnings, banking $8.9M of exit value rather than carrying the event risk. De-risking, not conviction.
And the scariest number in the original article evaporates. There is no "$70.7M maximum loss," because there is no open short spread. Nobody is exposed above $310. We published that figure on the assumption the spread was being opened; it was not, and we are retracting it explicitly.
What is still unknowable. Open interest proves the position was closed. It cannot tell you when the bull spread was originally put on, at what cost, or whether the desk exited at a profit or a loss — nor whether they replaced it with something we cannot see, such as stock or a position in another expiry.
⭐ The Timing Is Still the Story — but It Now Reads the Other Way
Take-Two reported on August 7, 2026 — confirmed (StockAnalysis). The package crossed the day before, and the September 18 expiry would have carried the print and its aftermath.
We originally read that timing as somebody selling elevated pre-earnings premium — being paid because the event was coming. With the close confirmed, the timing means something almost opposite: a desk holding a bullish September position looked at a confirmed catalyst one session away and decided not to hold it through the print. Elevated pre-earnings implied volatility was working in their favour on the exit — the long $270 call they sold was richer because the event was pending.
That is a recognisable institutional pattern, and it is a risk-management decision rather than a directional one. It says the desk did not want the gap risk. It does not say they turned bearish.
🤓 What This Actually Means — Plain English
A bull call spread is a bullish position: you buy a call at one strike and sell a higher one to cut the cost, and you profit if the stock climbs into that band. Somebody owned exactly that on Take-Two — long the September $270 call, short the September $310 call.
Closing it means doing both trades in reverse, on the same ticket: sell the $270 call you own, buy back the $310 call you owe. That is precisely the print we saw, and the open interest confirms both sides were exits.
Why the same tape can look like the opposite trade. A bear call spread being opened and a bull call spread being closed produce an identical row on any flow scanner — same strikes, same sizes, same direction on each leg, same net credit. The only thing that separates them is what happens to open interest the next morning. That is exactly why we mark these ⏳ provisional instead of asserting a direction, and it is why this article now says the opposite of what it said yesterday.
The reader takeaway: an $8.9M "credit" on a scanner is not automatically someone getting paid to take risk. Here it was someone getting paid to stop taking risk.
📊 The Charts
One-Year Price Action
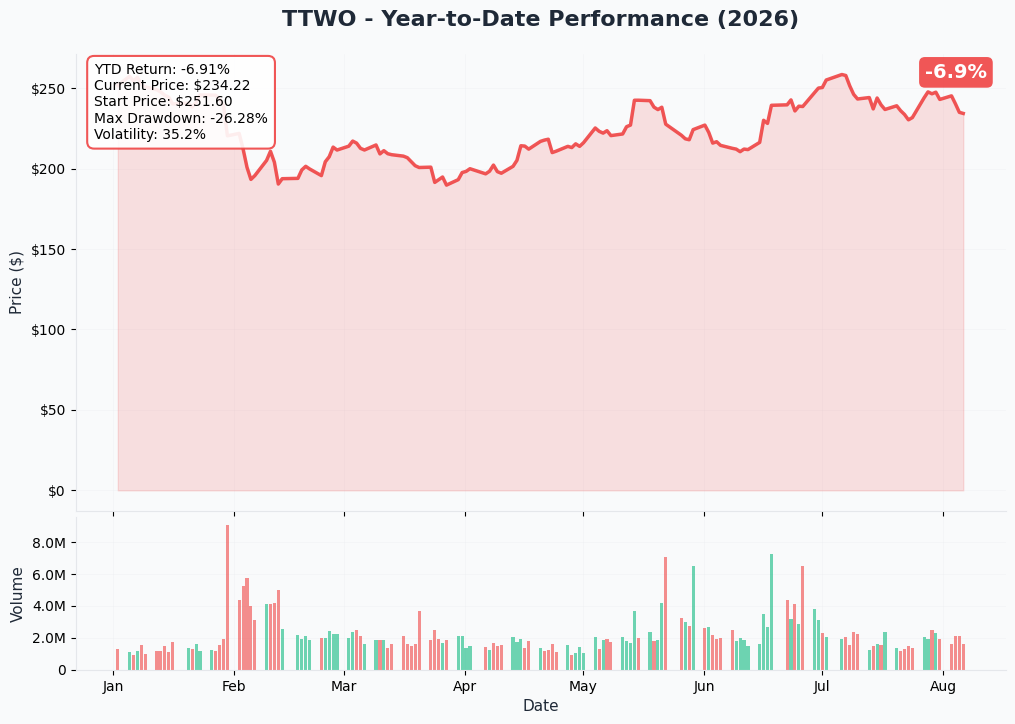
Take-Two is −6.9% over the past year and sits about 12% below its 52-week high of $265.94 (StockAnalysis).
Gamma Support and Resistance
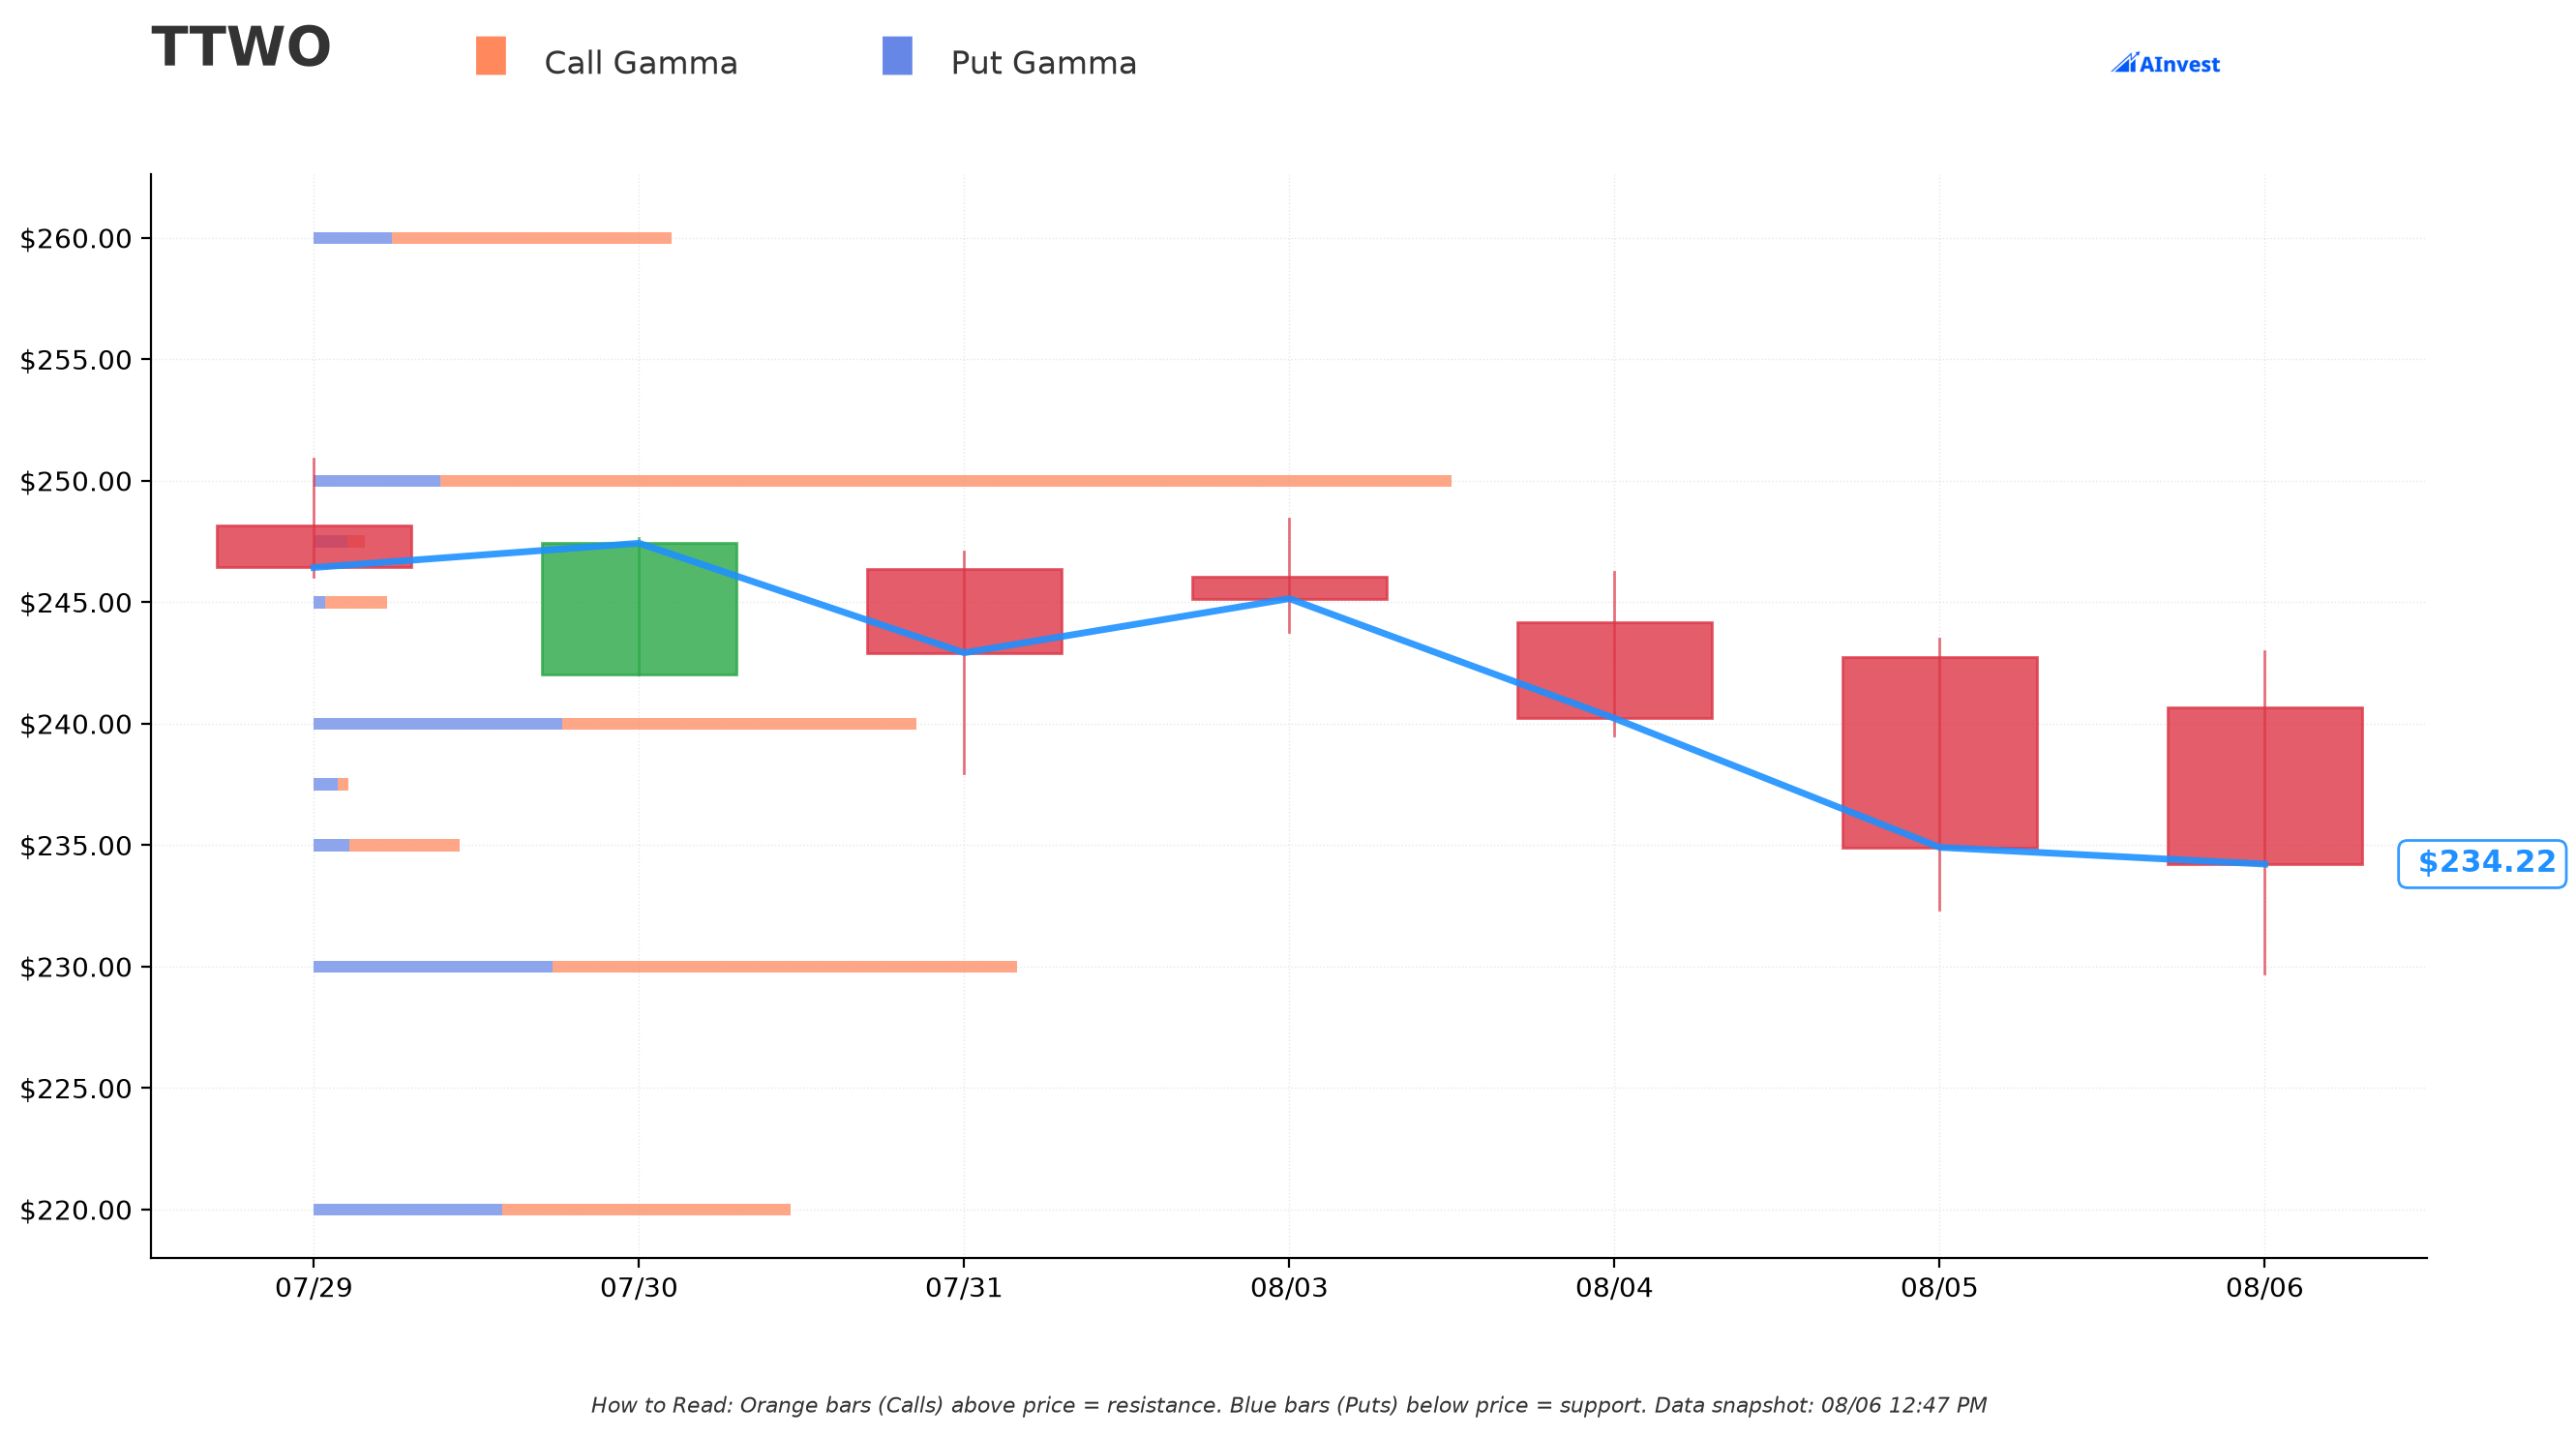
Dealer gamma is sparse in this name — the model finds moderate resistance at $250 and no meaningful support shelf below. Thin gamma means less hedging-flow friction to slow a move, which matters a great deal going into an earnings print: there is little structural resistance between here and the $270 short strike beyond that single $250 level.
Implied Move
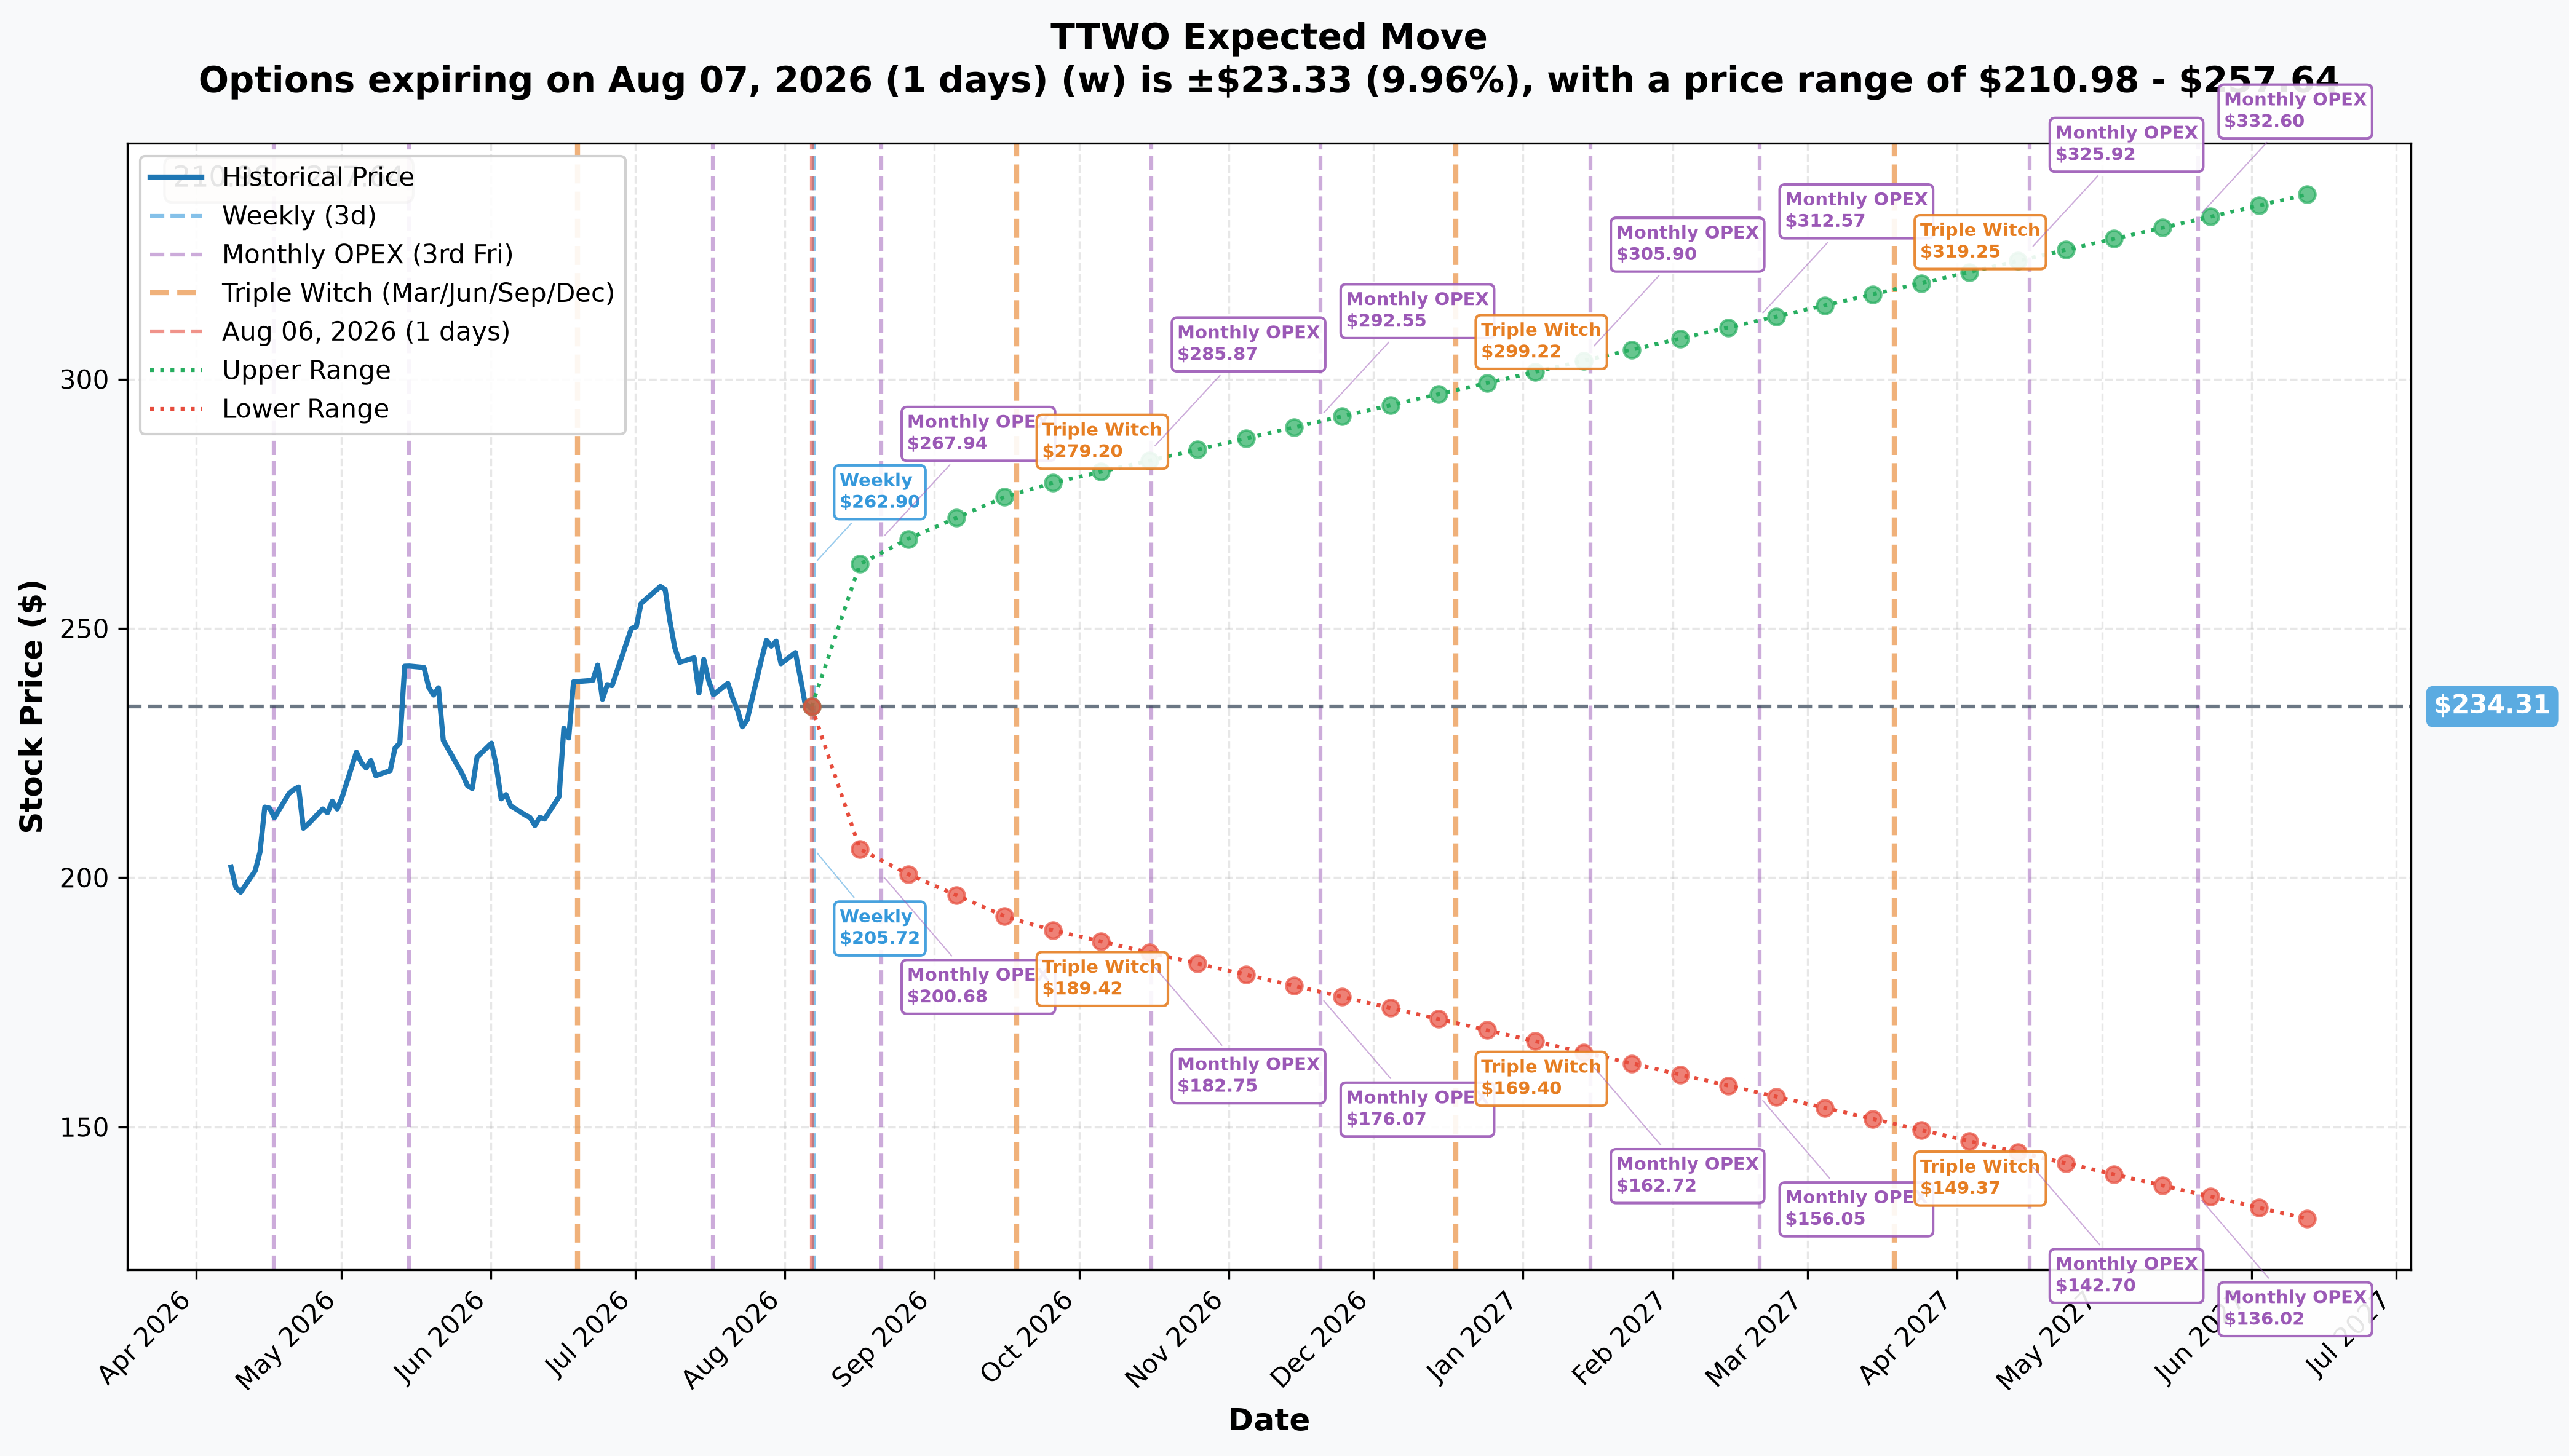
The chain is pricing the event loudly: ±9.96% by tomorrow ($210.98–$257.64) — nearly a 10% move priced for a single session — then ±13.45% by August 21 ($202.79–$265.83) and ±18.49% by September 18 ($190.98–$277.64).
Compare that with the position that was removed. The September range tops out at $277.64 — just above the $270 strike the desk was long, and far below the $310 strike it was short. In other words, the market's own pricing said the long leg was roughly at the edge of the plausible distribution and the short leg was well outside it. Exiting into that meant giving up a payoff the chain considered a coin flip at best, in exchange for not owning the gap risk overnight.
📅 Catalysts
- ⭐ Earnings: August 7, 2026 — confirmed (StockAnalysis). Tomorrow, and inside the September expiry.
- Most recent quarter: Q4 fiscal 2026, reported May 21, 2026 — "record fiscal 2026 results were driven by strong performance across core franchises and mobile" (StockAnalysis).
- Consensus is Strong Buy with an average target of $284.14, about 21.4% above spot (StockAnalysis). With the close confirmed, this reads differently than it did originally: the desk exited a bullish September position that the street's own average target would have paid off on. Either they disagreed with the consensus, or they simply did not want to own the outcome through the print.
👥 Four Ways to Read This
🎲 The YOLO trader — the chain priced ±9.96% for the print. That cuts both ways, and buying options into an event this richly priced means paying for the move before it happens. Note what the large account actually did here: it got out rather than pressing a bullish bet into that pricing.
📈 The swing trader — this is the case study for waiting on the open-interest check. Acting on the original scanner read would have had you shadowing a "bearish" position that did not exist. The confirmed signal is a bullish holder de-risking before a catalyst — informative about event risk, not about direction.
💰 The premium collector — the lesson is inverted from what we first published. There is no short spread here collecting decay into earnings. What there is: a reminder that elevated pre-event implied volatility helps whoever is selling an option, and that includes someone selling a long call to close.
🌱 The beginner — the durable lesson is that the same print can mean opposite things. Sell one call and buy a higher one, and you have either opened a bearish spread or closed a bullish one. Only the next morning's open-interest count tells you which. This article said the wrong one for a day, and the correction is why the check exists.
⚠️ Honest Risk and Limits — What the Tape Cannot Prove
- The original read was wrong and has been corrected. Both legs closed. There is no open bear call spread, no $70.7M exposure, and no new bearish position in this name from this print.
- We cannot see the original entry. Open interest proves the bull spread was taken off; it does not show when it was put on, at what price, or whether the desk booked a gain or a loss.
- We cannot see any stock or replacement position behind the exit. A desk that closes options risk may be re-expressing the same view in shares, another expiry, or not at all.
- We cannot see the other side. Roughly 21,000 contracts left each strike; some of that closing belonged to counterparties beyond the flagged block.
- Everything after the exit is unknowable from this tape. The earnings outcome is not evidence about the trade — a desk that de-risks and is then proven "wrong" by a rally made a risk decision, not a forecast.
Nothing here is investment advice. A large trade tells you what someone did, not that they were right.
Last updated: 2026-08-07 — 🔄 INVERSION. Next-day OPRA open interest resolved both provisional legs as CLOSES, not opens: September $270 call 27,182 → 6,025 (−21,157) and $310 call 28,250 → 6,603 (−21,647). The trade was an existing bull call spread being closed, not a new bear call spread being opened. Title, lead, thesis, plain-English, implied-move, catalyst, reader and risk sections were rewritten; the "$70.7M maximum loss" figure was retracted.