📡 VSAT: That $13.4M Bear Call Spread Was Being Retired, Not Opened — Both Legs' Open Interest Halved
📅 2026-08-11 | 🤝 Floor Block | ✅ Resolved 2026-08-12: BOTH LEGS CLOSED — no new short-vol position exists
🔄 Updated 2026-08-12 pre-market — the next-day OPRA open interest resolved both legs, and the read inverted exactly as we warned it might. Neither leg opened. The $80 call fell 12,721 → 6,369 (−6,352) and the $115 call fell 12,675 → 6,647 (−6,028) — each roughly half the strike — where a fresh open would have pushed both toward ≈25,300. We wrote that "if tomorrow's OI confirms a close, the 'someone is now betting Viasat's rally stalls' read inverts completely." It confirms a close. No new ≈$30.8M-risk short-vol position was created; an existing bear call spread was taken off. See the ✅ RESOLVED box.
🎯 The Quick Take
Most of today's late board was dividend and financing mechanics — deep-in-the-money calls sold at pure intrinsic, expressing no view on the stock. VSAT is different. At 15:19:08, a desk printed a genuine bear call spread as a negotiated floor block: sold 12,618 December 18 $80 calls and bought 12,618 December 18 $115 calls, collecting ≈$13.40 million net on a $35-wide spread with maximum risk ≈$30.8 million. The breakeven, ≈$90.62, sits only ≈6.0% above the $85.46 spot reference — and just ≈$2.40 below the stock's own 52-week high of $93.03. This is a real bet that a stock up ≈145.8% year-to-date has run far enough, at least through mid-December. It is also a bet the tape cannot yet confirm is new: both legs printed at sizes just under existing open interest, which means this could just as easily be an existing bearish position being closed out — a possibility that would flip the entire read. More on that below.
🏢 Company Overview
VSAT — Viasat, Inc. — is a ≈$11.64 billion market-cap satellite-communications company on 137.76 million shares outstanding, sector Technology / Communication Equipment. It reports in two segments: Communication Services (satellite broadband, narrowband/IoT, in-flight connectivity, maritime and government mobility — the Inmarsat-heavy side of the business) and Defense and Advanced Technologies (government/tactical SATCOM, cyber, space and mission systems, antenna/terminal technology, and patent licensing — currently the growth and backlog engine, with DAT backlog up 23% year over year in fiscal 2026).
Viasat completed its acquisition of Inmarsat in May 2023, roughly doubling the company and bringing the global L-band mobile-satellite franchise along with the leverage that has defined the equity story since. Its fiscal year ends March 31 — a detail that matters directly for this trade's calendar, addressed below.
💰 The Trade — A Bear Call Spread, Printed as a Floor Block
| Time | Buy/Sell | Call/Put | Expiration | Premium | Strike | Volume | Prior OI | Size | Spot | Option Price | Symbol |
|---|---|---|---|---|---|---|---|---|---|---|---|
| 15:19:08 | SELL | CALL | 2026-12-18 | $25.87M | $80 | 12,620 | 12,721 | 12,618 | $85.46 | $20.50 | VSAT20261218C80 |
| 15:19:08 | BUY | CALL | 2026-12-18 | $12.47M | $115 | 12,627 | 12,675 | 12,618 | $85.46 | $9.88 | VSAT20261218C115 |
🤝 Floor block — both legs printed together as a negotiated package on the floor, not a lit sweep. There is a known counterparty on the other side; no urgency or aggression should be read into the mechanism itself.
Net credit ≈$13.40 million ($25.87M collected − $12.47M paid). Gross premium crossing the tape is $38.34M, but that double-counts the spread — $13.40M is the actual capital collected, and ≈$30.8 million is the actual capital at risk if VSAT settles at or above $115 on December 18.
The economics:
- Credit per spread ≈$10.62 ($20.50 collected − $9.88 paid)
- Breakeven ≈$90.62, ≈+6.0% above the $85.46 spot reference
- Maximum profit if VSAT is at or below $80 at expiry (≈−6.4% from spot) — keep the full $13.40M
- Maximum loss if VSAT is at or above $115 at expiry (≈+34.6% from spot) — lose ≈$30.8M net of the credit already collected
- The $80 short strike is in the money by ≈$5.46 and carries ≈$15.04 of time value on top of that intrinsic — a very fat extrinsic premium for a call that's already ITM, and it's the clearest sign the implied-volatility surface on VSAT is running extremely hot right now. That's exactly what this seller is monetizing.
✅ RESOLVED — Both Legs Closed: An Existing Spread Came Off, No New One Went On
Updated 2026-08-12 pre-market. Resolving OPRA snapshot timestamped August 12 (reflects the August 11 close, after this print); baseline is the August 11 snapshot (reflects the August 10 close, before this print).
| Leg | Baseline (Aug-11) | Resolving (Aug-12) | Δ | Print size | What we published | Verdict |
|---|---|---|---|---|---|---|
| Dec-18 $80 call (sold) | 12,721 | 6,369 | −6,352 (−49.9%) | 12,618 | "climb toward ≈25,339 if a fresh open; fall if a close" | 🔄 CLOSE — was STO ⏳ |
| Dec-18 $115 call (bought) | 12,675 | 6,647 | −6,028 (−47.6%) | 12,618 | "climb toward ≈25,293 if a fresh open; fall if a close" | 🔄 CLOSE — was BTO ⏳ |
We named this exact outcome and its exact consequence. The article said the near-perfect match between print size and prior open interest "is itself a hint this could be an existing position being closed rather than a fresh one being put on," and that a confirmed close would invert the read completely. Both legs lost close to half their open interest in one session, in near-lockstep (−49.9% and −47.6%) — the signature of a two-leg package being unwound as a unit.
Control check. The neighbouring December $90 call was untouched over the same window (91 → 109), so this is specific to the spread's two strikes rather than a chain-wide event in Viasat options.
What is withdrawn. Everything in the analysis below that reads this as a new bearish or short-volatility position does not survive:
- There is no new ≈$30.8M of capital at risk. That figure describes the spread's economics, but the spread was being retired, not established.
- The ≈$13.40M "net credit" was not collected for taking on risk — it is the proceeds of closing out a position, which is a different economic event with a different sign on the desk's book.
- "Someone is now betting Viasat's rally stalls below its 52-week high" is withdrawn in full. A closing trade says a desk is finished with a view, not that it holds one. If anything, a bear call spread being taken off after a 145% run is the opposite signal — a short-vol position being retired while the stock is still elevated.
What survives and is still worth reading. The strike geometry, the volatility observation (an in-the-money $80 call carrying ≈$15.04 of time value is a genuinely rich extrinsic, and that is why this position was profitable enough to close), and the catalyst calendar are all unaffected — they describe the strikes and the stock, not the direction of this print. Roughly 6,400 short $80 calls and 6,600 long $115 calls remain outstanding at these strikes and belong to whoever is still there.
The honest caveat. Open interest is a market-wide total. We can prove both legs of this spread shrank by roughly half on the day the package printed; we cannot prove a single account held both sides.
🤓 What This Actually Means — Plain English
A bear call spread (also called a call credit spread) is built from two legs at the same expiration: sell a call at a lower strike, buy a call at a higher strike. Here that's short the $80 call, long the $115 call, both December 18.
- What you collect: the $80 call is worth more than the $115 call (it's closer to the money), so selling it and buying the cheaper $115 call nets a credit up front — here, ≈$10.62 per spread, ≈$13.40M across 12,618 spreads. That premium is yours to keep the moment the trade prints.
- What you risk: the strikes are $35 apart. If VSAT finishes above $115, both calls are in the money and the spread is worth its full $35 width — you owe $35, offset by the $10.62 you already collected, for a net loss of ≈$24.38 per spread (≈$30.8M on the package). The long $115 call is what caps the loss; without it, this would be a naked short call with theoretically unlimited risk.
- Why the risk is capped but still ≈2.3× the credit: $30.8M of maximum risk against $13.40M of maximum reward is roughly a 2.3-to-1 risk/reward ratio. That's the honest way to read a "$13.4M credit collected" headline — it is not $13.4M of safe income, it's $13.4M compensation for taking on ≈$30.8M of downside if the stock keeps running.
- Order type, per the tape's inference: the $80 leg reads STO (sold to open) and the $115 leg reads BTO (bought to open) — both currently flagged ⏳ because size sits at or below prior open interest, so neither can be asserted as fact yet.
- The fat-extrinsic tell: normally, a call that's $5.46 in the money would trade close to intrinsic value the closer it gets to expiration or the lower implied volatility runs. Here it's carrying ≈$15.04 of extra value beyond intrinsic with over four months left to December 18. That's the market pricing in a wide range of outcomes for VSAT between now and then — consistent with a stock that swung from $72.86 to $89.81 and back to $76.93 across June and July alone. Selling that rich a call is a bet that realized volatility calms down and the stock doesn't keep making moves of that size.
Bottom line: this collects a large credit for betting VSAT's re-rating has largely run its course by December — but it caps its own upside at $80 and leaves real money on the table if the stock is instead just consolidating before its next leg higher.
📈 Charts
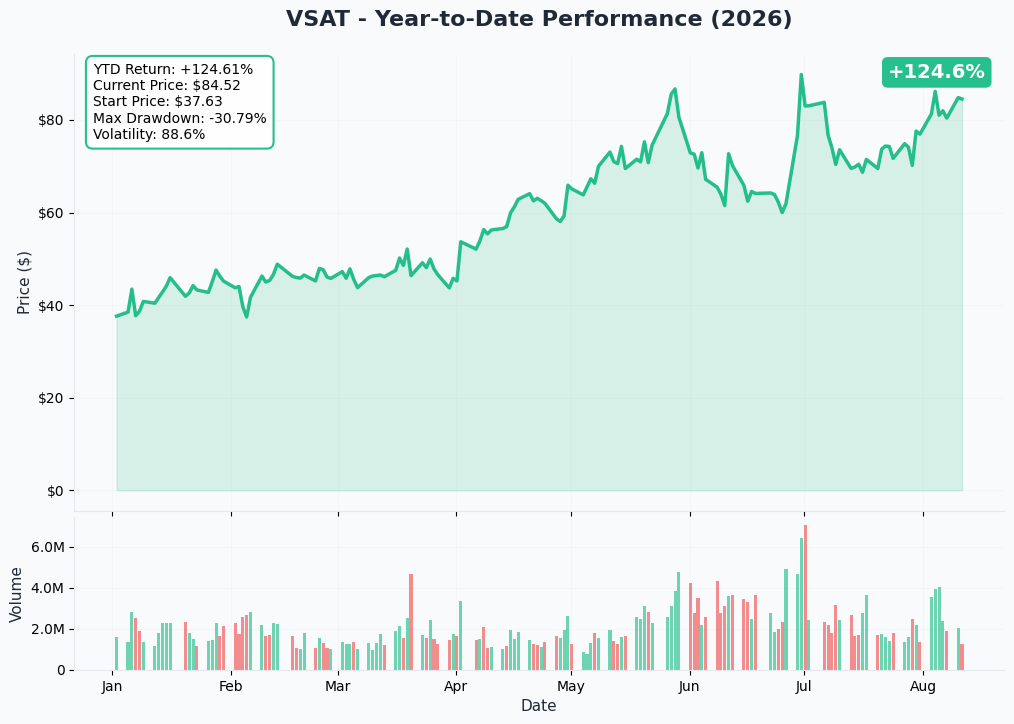
VSAT started 2026 at $34.46 and is now ≈$85 — up ≈145.8% year-to-date and ≈233% over 52 weeks, against a 52-week range of $25.17–$93.03. The 50-day moving average is $72.75 and the 200-day is just $53.86, meaning spot sits ≈57% above the longer-term trend line. Recent monthly closes tell the volatility story directly: $72.86 (June 1) → $89.81 (June 30) → $76.93 (July 31) → ≈$85 today — a ≈14% drawdown followed by an ≈11% recovery inside eight sessions. That whipsaw is exactly the kind of realized volatility a short-call seller is being paid to underwrite.
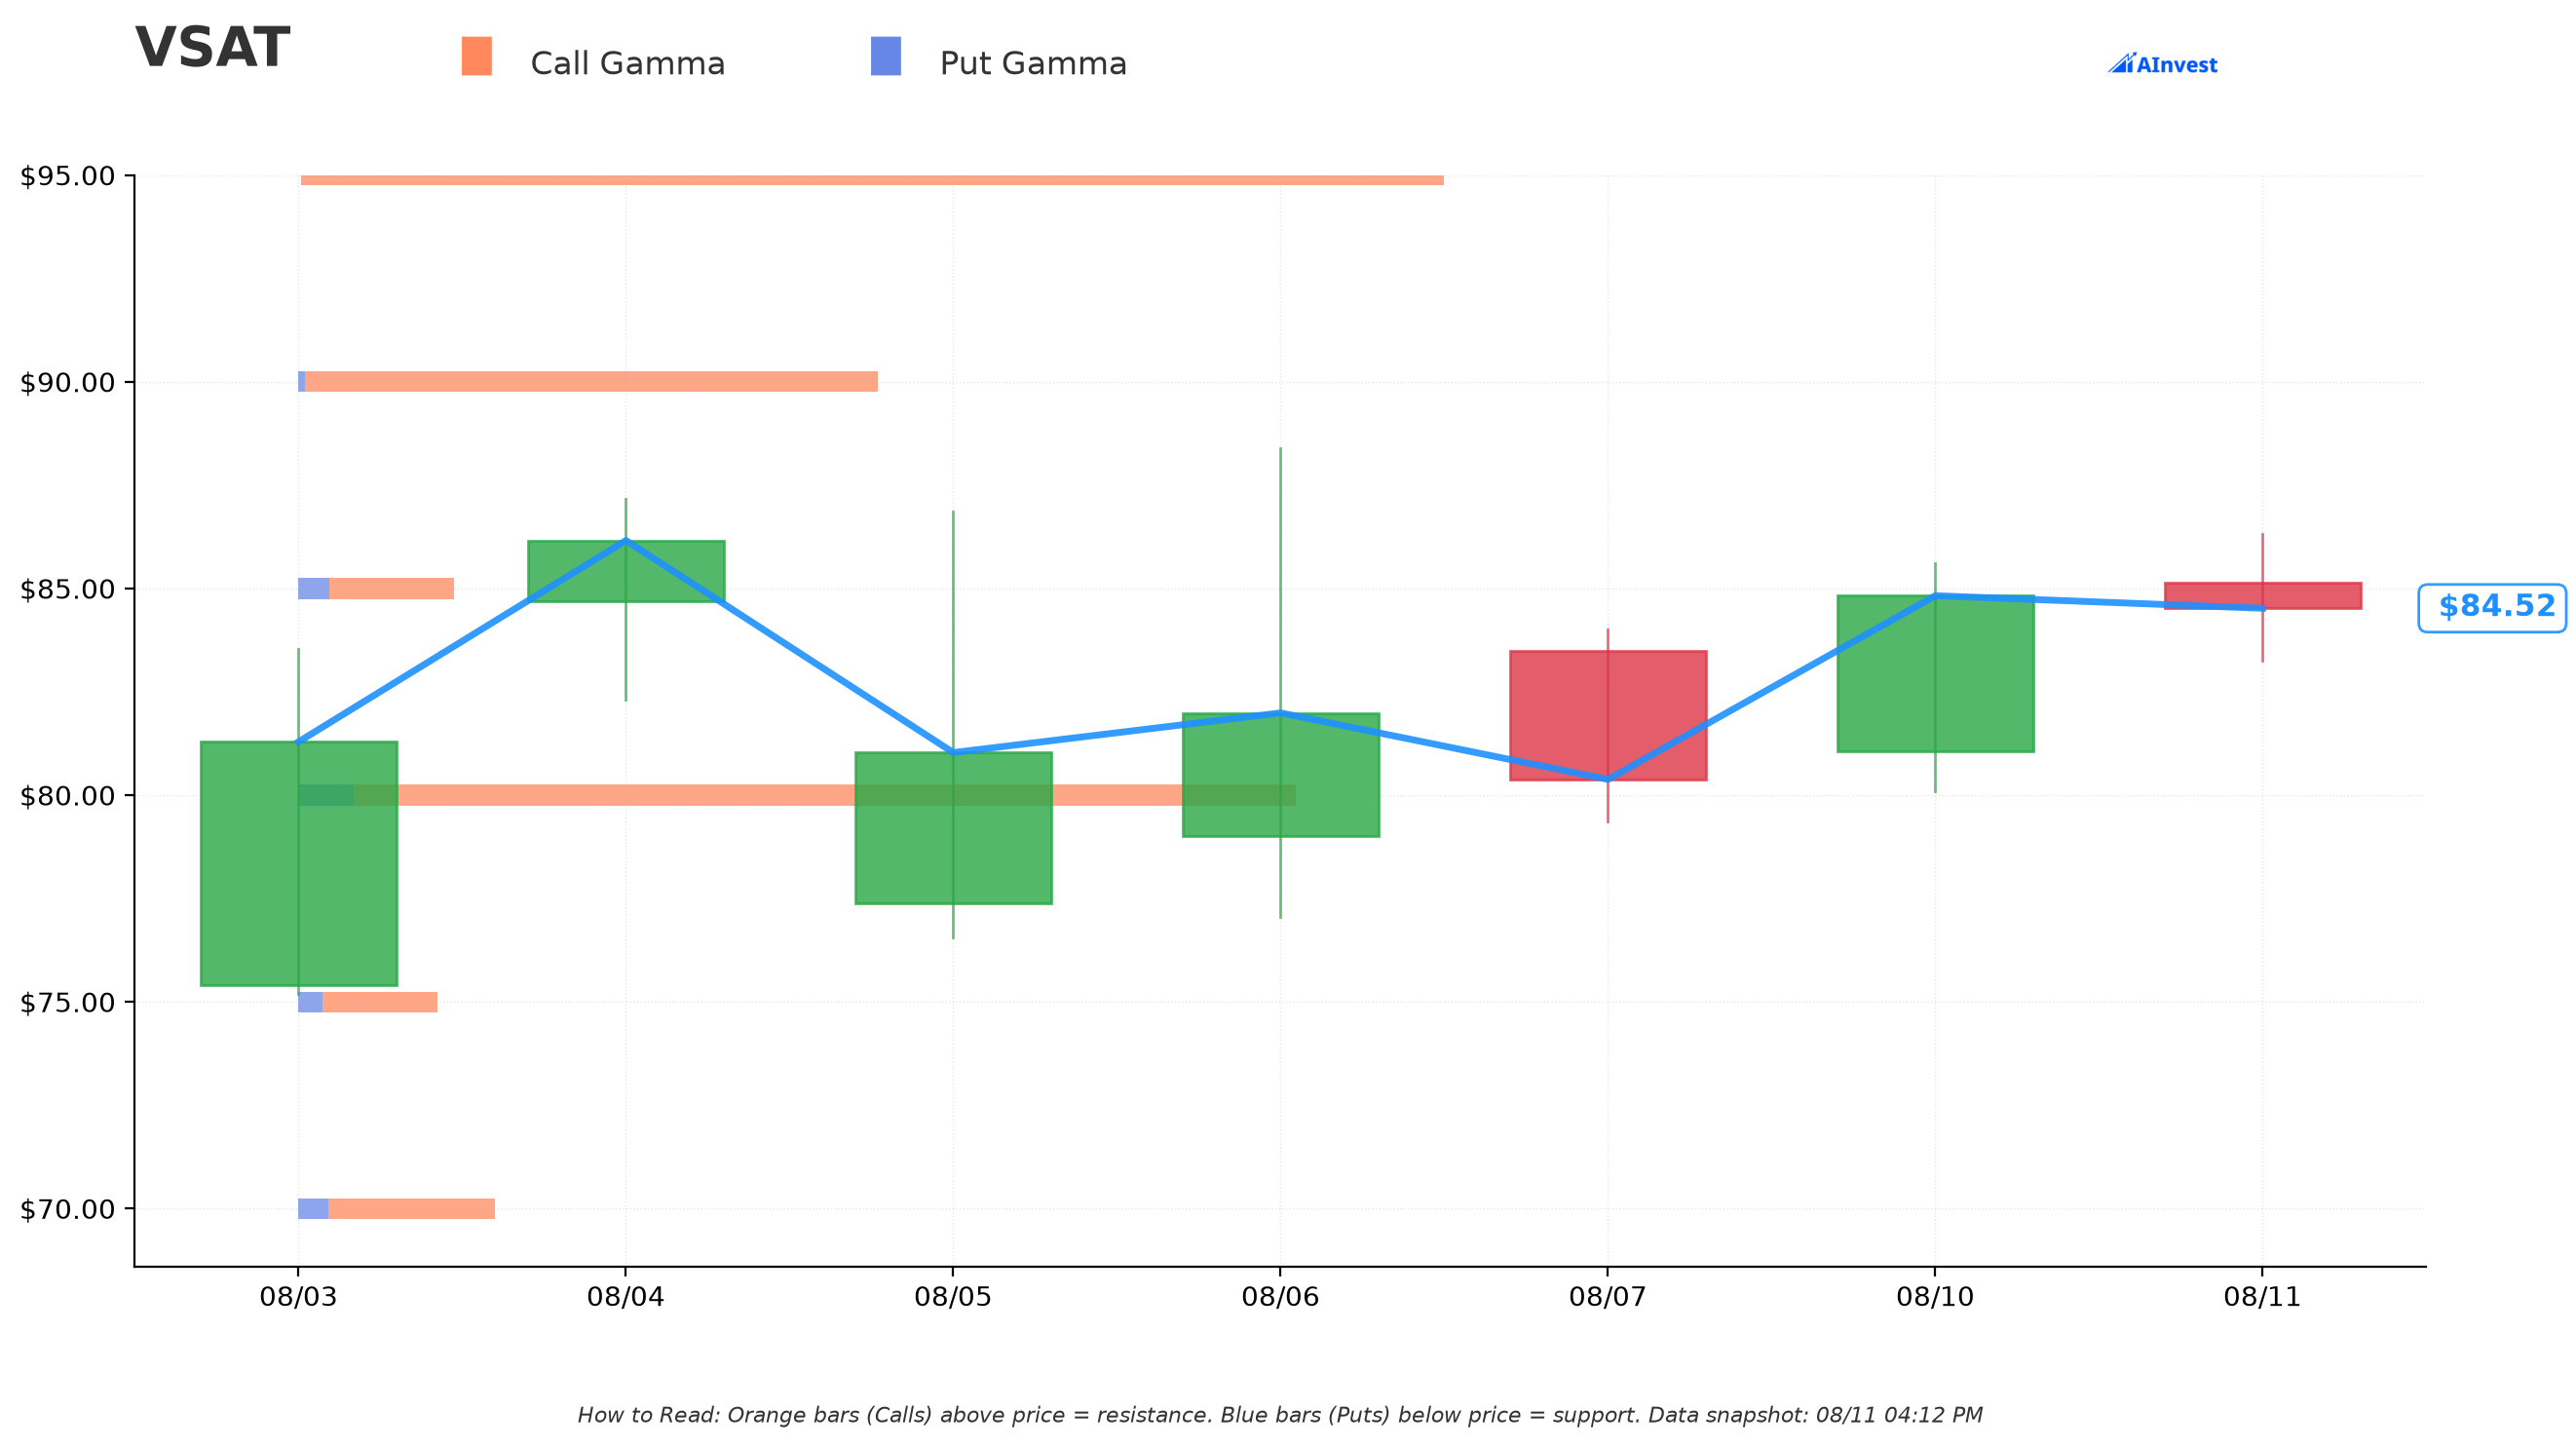
Per gex.json (spot $84.00): support at $80 (net gamma 3.34, Moderate) and resistance at $90 (net gamma 2.13, Moderate). The short $80 strike of this spread sits directly on top of the gamma support level — dealer hedging flows are concentrated exactly where the seller needs the stock to stay below. If VSAT tests $80 from above, gamma-driven dealer buying could help cushion it there, which is favorable to the short side of this spread; if it breaks decisively through, that cushion disappears.
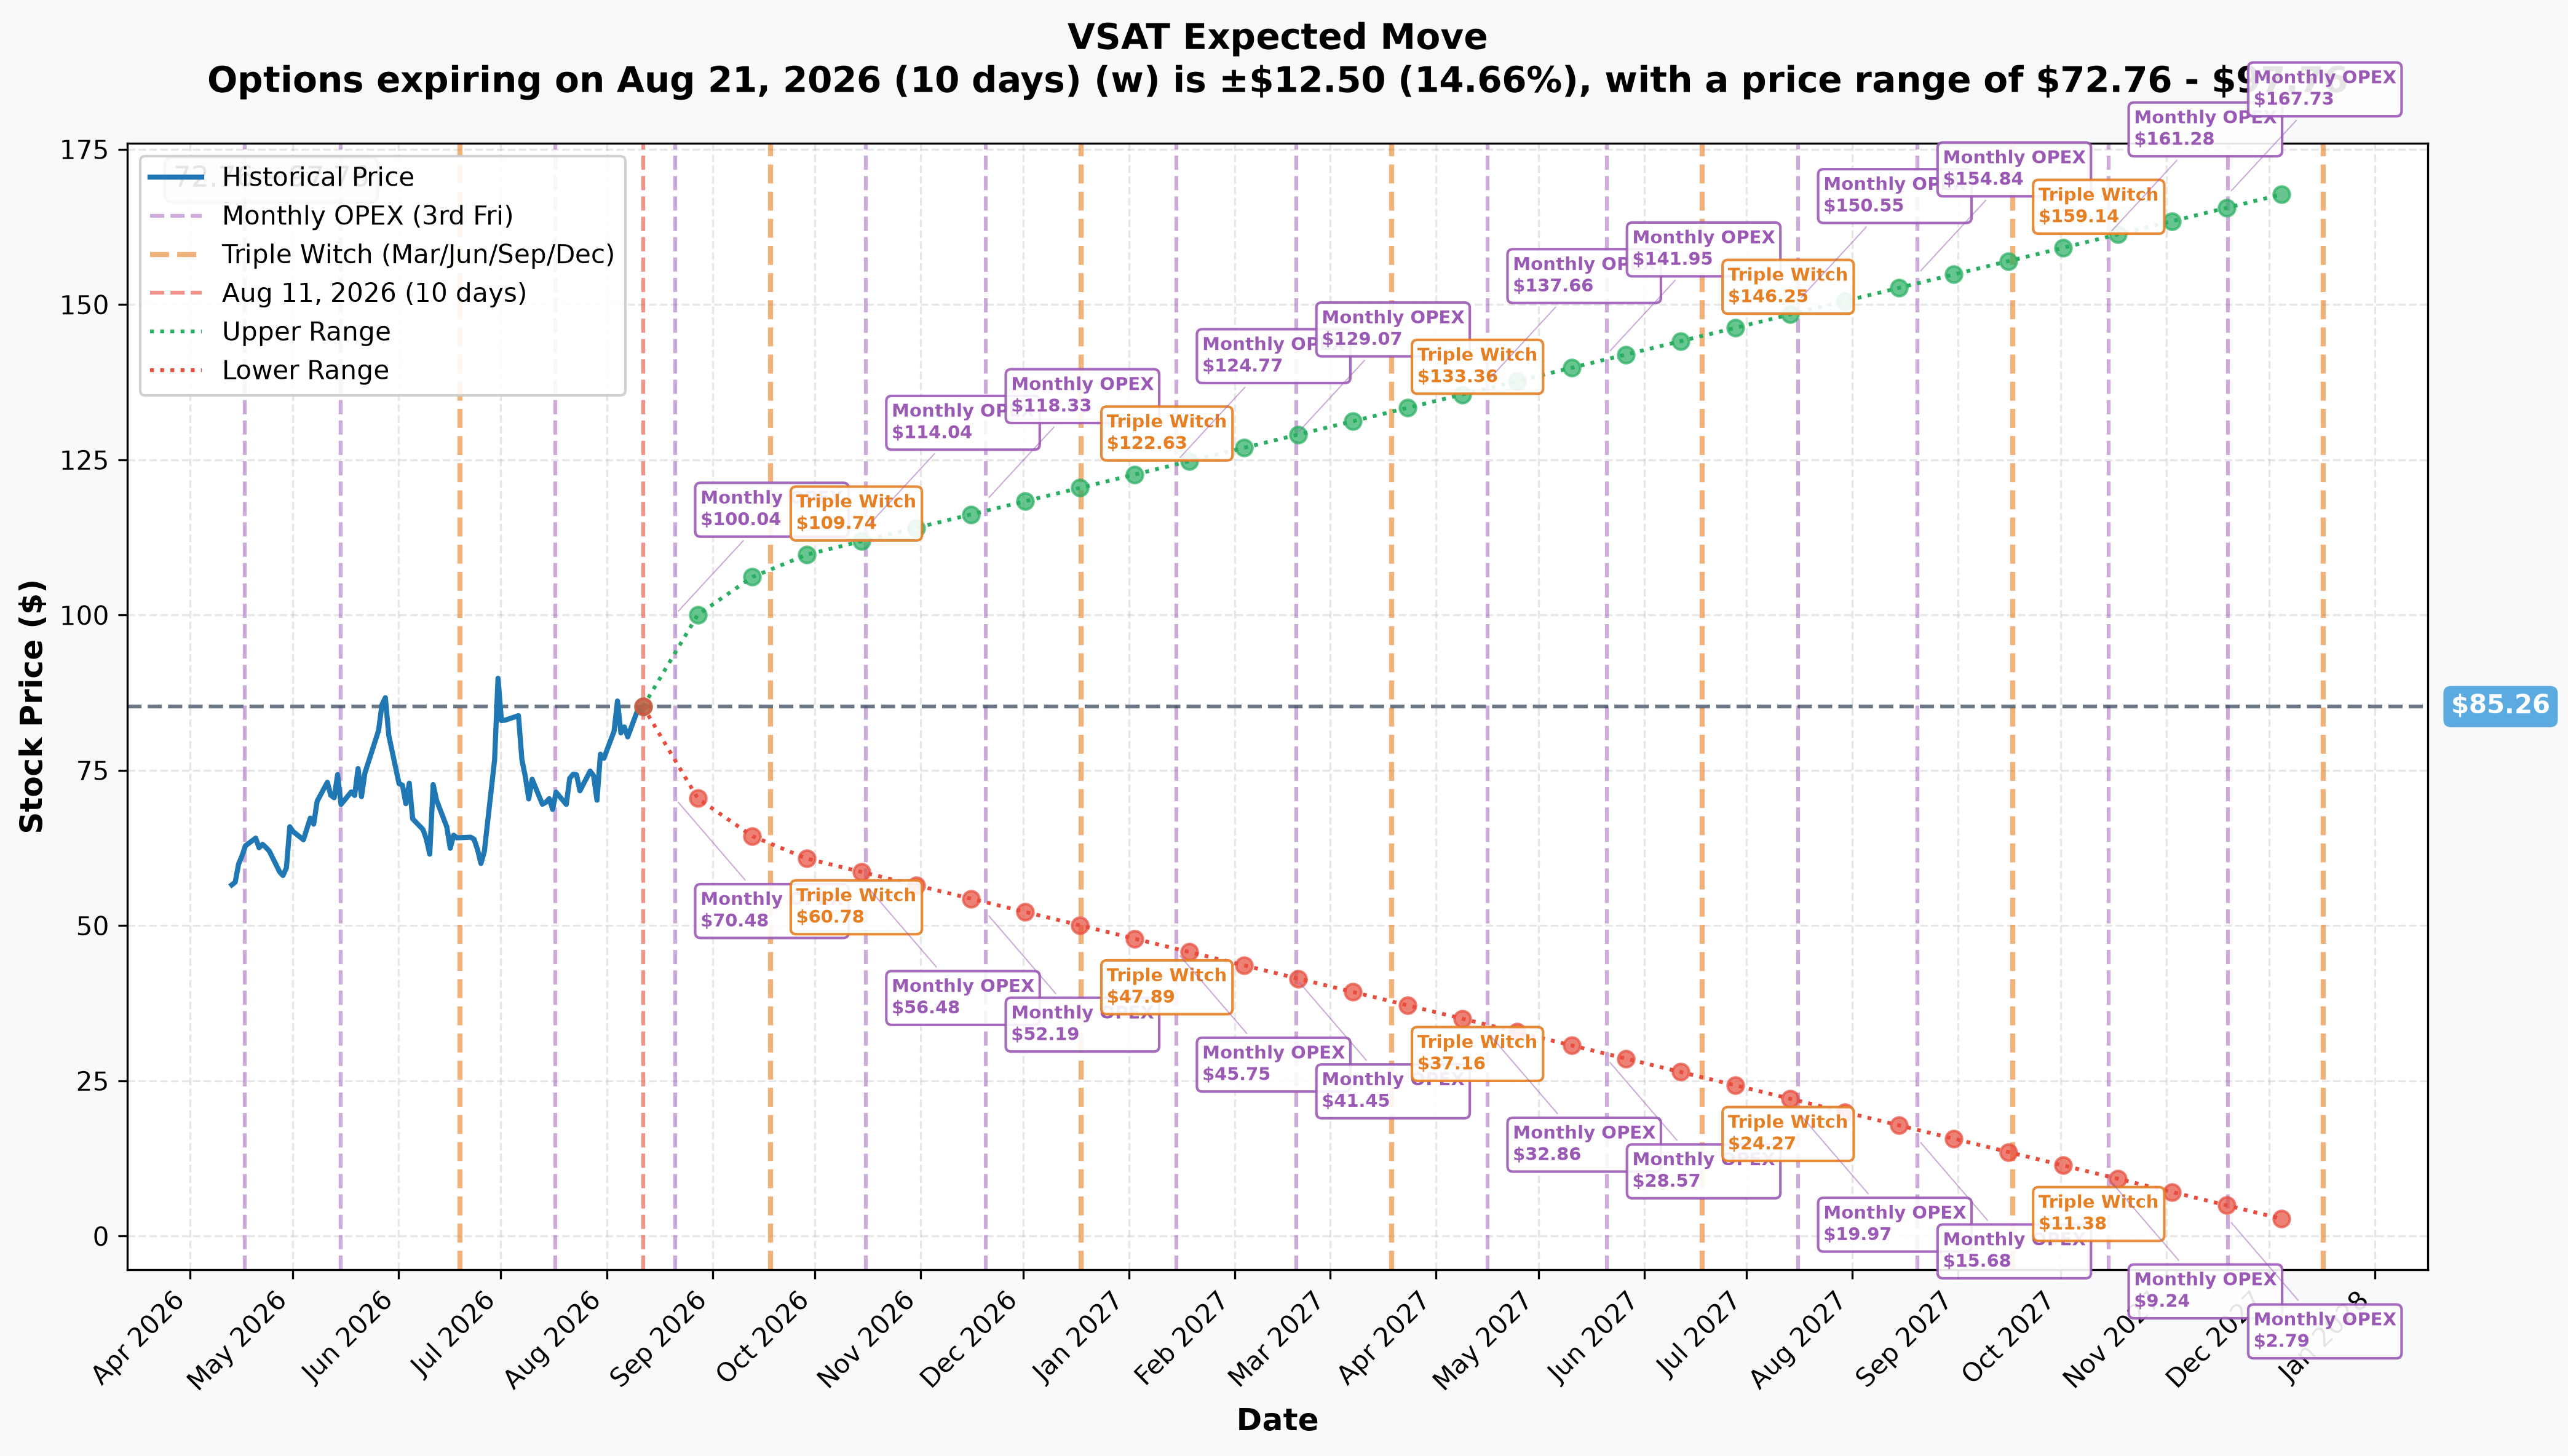
The options market currently prices a ±14.66% move to the August 21 monthly expiration ($72.76–$97.76) and a wider ±27.14% move to the September 18 quarterly expiration ($62.12–$108.40). Both of those windows are shorter than the December 18 expiration this spread uses. Draw the honest inference: if the market already prices a ±27% range just five weeks out, the implied distribution for a ≈129-day expiration in December is wider still. A +34.6% move to the $115 max-loss strike sounds large in isolation, but against a stock that's already priced for ±27% moves inside five weeks and that jumped 17.1% in a single session in June, it is not nearly as remote as the headline percentage suggests. That is the real risk in this position, and it's the same volatility the fat extrinsic on the $80 strike is pricing in.
🎪 Catalysts — And Why the Calendar Only Has One Real Report in It
Viasat's fiscal year ends March 31, so its December-calendar-quarter results are a February event — not a report that falls inside this expiration. Only one of the next two quarterly prints lands inside December 18:
| Report | Calendar quarter | Estimated date | Confirmed? | Inside 2026-12-18 window? |
|---|---|---|---|---|
| Fiscal Q2 FY2027 | 2026-07-01 → 2026-09-30 | ≈2026-11-03 to 2026-11-06 | ❌ Estimated, anchored on last year's Nov 7 print | ✅ Yes |
| Fiscal Q3 FY2027 | 2026-10-01 → 2026-12-31 | ≈2027-02-04 | ❌ Estimated, anchored on last year's Feb 5 print | ❌ No — ≈48 days after expiry |
A calendar-year reporter would have fit two earnings prints into this window. Viasat does not. Keep that separate from the expiration date itself, which is a market-structure date (it also happens to be an S&P quarterly rebalance effective date), not a company event.
Catalysts that ARE inside the December 18 window:
- ViaSat-3 F3 commercial service entry — guided August–September 2026, though the language has softened to "later this year" after the July 22 reflector deployment confirmed formal in-orbit testing had begun (Advanced Television, 2026-07-22). This completes the three-satellite ViaSat-3 constellation and is expected to roughly triple Viasat's bandwidth inventory (Advanced Television, 2026-05-29). High probability it occurs before expiry; exact date is company-controlled.
- Fiscal Q2 FY2027 earnings, ≈November 3–6 (estimated, not confirmed). The last two reports produced −7.0% (May 28) and −4.5% (August 4) day-after moves (The Motley Fool, 2026-05-29 · The Motley Fool, 2026-08-05) — both moves went in the spread's favor. One more report sits inside this window.
- The Equatys constellation funding announcement — undated, and the single largest risk to this position. CEO Mark Dankberg said on August 6 that Equatys is "moving ahead" and that "the next major announcement would be the funding of the initial satellite constellation" — and explicitly declined to give timing: "I'm not going to talk about the timing of that announcement" (Advanced Television, 2026-08-06). An undated, potentially large bullish disclosure is precisely the kind of exposure a short call spread cannot model or hedge against in advance.
Why the stock is at $85 at all. This is a narrative re-rating, not an earnings one — revenue actually fell 1.2% year over year last quarter ($1.16B vs $1.171B) even as the stock has nearly tripled off its 52-week low. Four drivers built the move: the ViaSat-3 F3 launch on April 29, 2026; record fiscal-2026 orders and backlog ($4.9B awards, +8% YoY; $4.1B backlog, +15% YoY) (Advanced Television, 2026-05-29); the Rocket Lab–Iridium ≈$8 billion deal on June 29, 2026, which sent VSAT +17.1% in a single session purely on spectrum-scarcity read-across to Viasat's own L-band holdings (The Motley Fool, 2026-06-29); and the U.S. Space Force PTS-G win on June 11. On that last one: press coverage compressed it to a "$4 billion Space Force win," but the $4 billion is the program's IDIQ ceiling shared across all awardees, not Viasat's specific contract value, which was not disclosed (Viasat release, 2026-06-11) — exactly the kind of figure that gets misreported as company revenue.
The bear case, and it's well-documented. Viasat carries $6.86 billion of total debt against $1.74 billion of cash — $5.13 billion net debt. Gross debt has not fallen in three quarters ($6.71B → $6.88B → $6.86B); the improvement in net debt has come almost entirely from cash build, not principal repayment. The current portion of debt jumped from ≈$488M to ≈$1,083M quarter over quarter — meaning roughly $1.1 billion of principal now sits inside the next twelve months (this is a derived figure from total minus long-term debt, not a reported line item). Leverage runs ≈3.2–3.6× against management's stated sub-3× goal. Interest expense is why fiscal Q1 2027 showed operating income of $47.3 million but a GAAP net loss of $51.7 million.
The 52-week high of $93.03 sits only ≈$2.40 above this spread's $90.62 breakeven — this position needs the stock to stay below a level it has already touched within the past year. MarketBeat's more conservative consensus target of $90.67 sits almost exactly at the breakeven; the more bullish stockanalysis.com consensus reads $101.44 (range $49–$140, 9 of 11 analysts at Buy or better). The $115 upper strike sits above every published price target except Oppenheimer's $140 initiation from June 29.
👥 Four Ways to Read This
🎲 The YOLO trader
Copying the sold side of this outright — a naked short $80 call — is not something to replicate. The desk here bought the $115 call specifically to cap the loss at ≈$30.8M instead of leaving it open-ended; a retail account selling the $80 call alone on margin would be exposed to unlimited loss on a stock that already moved 17% in a single session once this year and is guided toward more binary news (F3 service entry, Equatys funding) before December. If you want to fade the rally with defined risk, replicate the whole spread, not half of it — and size for the fact that $30.8M of max loss on a $13.40M credit is real money changing hands if this goes wrong.
📈 The swing trader
The $80 gamma support level lines up with the short strike — watch that zone into November earnings and any F3 service-entry headline. A grind back toward $80 would be constructive for the position and could offer an entry for a shorter-dated version of the same thesis; a decisive break above $90 (the gamma resistance level) into the ≈$93 prior high would be the signal this trade is under real pressure well before December 18.
💰 The premium collector
This is the one name on today's board where the premium-collector lens is the whole story, not a side note. Someone (pending tomorrow's OI resolution — possibly closing an existing position, not opening a new one) collected ≈$10.62 per spread on a stock that just ran 145.8% year-to-date and still has an undated, potentially large bullish catalyst (Equatys funding) sitting inside the window. Selling calls on a stock up this much this fast is not a low-risk income trade — the fat $15.04 of extrinsic value on the $80 strike is compensation for genuinely elevated implied volatility, not free money. If you're inclined to sell premium on VSAT yourself, this spread's own economics — ≈2.3× risk versus reward, breakeven within 6% of spot — are the honest starting math, not the ≈$13.4M headline credit in isolation.
🌱 The beginner
This is a useful, contained example of what a bear call spread actually is: sell a call you think won't finish deep in the money, buy a further-out call purely as insurance against being wrong, and keep the difference in premium as your maximum possible profit. The number that matters most for understanding risk here is not the $13.4M credit — it's the $30.8M maximum loss and the $35 width between strikes that produces it. Spreads like this cap the worst case, but "capped" does not mean "small": here the cap is still more than twice the size of the credit collected.
⚠️ Honest Limits — What the Tape Cannot Prove
- The tape proves the mechanism (floor block), the exact prices and sizes, and the prior open interest on both legs. It cannot prove who initiated the trade, their identity, or their motive.
- Open versus close is genuinely unresolved on both legs. Size on the $80 call (12,618) sits just under its prior OI (12,721); size on the $115 call (12,618) sits just under its prior OI (12,675). Tomorrow's ≈06:30 ET open-interest snapshot is the only real test — and if it shows a close rather than an open, the entire "fresh bearish position" framing above inverts to "an existing bearish position being unwound."
- The tape cannot confirm whether this desk holds an offsetting stock position, other options, or any other hedge. A short call spread paired with a long stock position, for instance, would tell a very different story than a standalone directional bet.
- Dealer gamma levels from
gex.jsonare inferred from open interest and a sign convention, not observed market-maker positioning — treat $80 and $90 as probabilistic pressure zones, not hard floors or ceilings. - The Equatys funding announcement, the Strategic Review Committee outcome, and any refinancing of the ≈$1.08B current debt portion are all undated. None of them can be priced into this analysis beyond noting they exist as live risk to the short side.
- This is not a recommendation to open, close, or replicate this position. Options trading carries substantial risk of loss; a capped-risk spread still risks real capital, and selling calls into a stock up 145% year-to-date on a still-unresolved rally is not a low-risk strategy. Size and risk-manage accordingly.
Last updated: 2026-08-12 (pre-market) — the next-day OPRA open-interest snapshot resolved both legs and the read inverted. Dec-18 $80C 12,721 → 6,369 (−6,352, −49.9%) and Dec-18 $115C 12,675 → 6,647 (−6,028, −47.6%) against 12,618-lot prints: CLOSE on both. The provisional STO/BTO labels are retired. No new short-volatility position was created — an existing bear call spread was taken off, so the ≈$30.8M max-risk framing, the ≈$13.40M "credit collected for taking on risk" framing and the "someone is now betting Viasat's rally stalls" thesis are all withdrawn. The title, subtitle and directional framing were updated; the ⏳ callout was replaced with the ✅ RESOLVED box.