🔄 VST $3.3M Net Credit: Not a Roll — a Desk Opened a Fresh Deep-ITM $195 Put Time Spread
📅 2026-08-03 | 🔥 Unusual Activity Detected
🔄 CORRECTION — August 4, 2026 pre-market: this was NOT a roll. Both legs opened. Open interest on the Jan-2027 $195 put rose 7,298 → 12,698 (+5,400) — exactly the ≈12,698 we said would prove a new long put (BTO), not the ≈1,898 that would have proven a close. The Jun-2027 leg also opened (5 → 5,405). Nothing was closed: this is a fresh two-leg deep-ITM put time spread, opened for a $3.32M credit. See the ✅ RESOLVED box.
🎯 The Quick Take
At 15:08:43 ET, a desk printed two Vistra put legs in the same millisecond — sold 5,400 June-2027 $195 puts for $29.21M while buying 5,400 January-2027 $195 puts for $25.89M, a $3.3 million net credit. Don't let the $55M of gross premium fool you into thinking this is a giant directional bet — the package's real directional exposure is only ≈53,000 shares, next to nothing on a stock trading at $155.87.
We originally read this as a roll of an existing short put. The next-day open-interest snapshot proved it wasn't: open interest rose by exactly 5,400 contracts on both legs, so nothing was closed. Translation: this is a brand-new deep-in-the-money $195 put time spread — long the January 2027 leg, short the June 2027 leg — opened for a $3.32M credit. The desk is capturing the $6.15/share of time-value difference between the two expirations, and the live risk is the short June 2027 put, which runs five months past the January leg it is paired with.
📊 Company Overview
Vistra Corp. (VST) trades on the NYSE and is classified under Electric Services:
- Market Cap: ≈$52.8 billion
- What it does: Vistra is one of the largest power producers and retail electricity providers in the US, with 44 gigawatts of generation capacity spanning natural gas (27 GW), nuclear (6.5 GW), coal (8.7 GW), and solar/battery storage (1.3 GW).
- Who it serves: ≈5 million retail customers across 20 states, plus wholesale power sales.
- Why it's an "AI power" name: its nuclear and gas fleet sits at the center of the hyperscaler data-center power story — more on that below.
- Current Price: $155.87 at the time of this trade — down ≈24.9% over the past 52 weeks, off a 52-week high of $219.82.
💰 The Option Flow Breakdown
📊 What Just Happened — The Tape
Both legs printed at the same millisecond as one package, and a full scan of the chain at that moment found no other legs — this is exactly a two-leg structure, nothing more.
| Time | Buy/Sell | Call/Put | Expiration | Premium | Strike | Volume | OI (prior) | Size | Spot | Option Price | Option Symbol |
|---|---|---|---|---|---|---|---|---|---|---|---|
| 15:08:43 | SELL | PUT | 2027-06-17 | $29,208,600 | $195 | 5,400 | 5 | 5,400 | $155.87 | $54.09 | VST20270617P195 |
| 15:08:43 | BUY | PUT | 2027-01-15 | $25,887,600 | $195 | 5,400 | 7,298 | 5,400 | $155.87 | $47.94 | VST20270115P195 |
🤝 MULTI-LEG BLOCK CROSS — confirmed as a multi-leg cross on 100% of the prints on both legs, off the real OPRA tape. A broker matched a known counterparty on both sides at once and printed the whole package off the open book. There's no sweep, no urgency signature, and no NBBO-aggressor read to lean on here — a desk rolled this position; nobody "slammed the ask."
- Net premium: a $3,321,000 CREDIT ($54.09 collected − $47.94 paid = $6.15/share × 5,400 contracts × 100). Never read the $55.1M of gross premium as the size of a new bet — that number double-counts two legs of the same position moving in opposite directions.
- Package delta: only ≈−53,244 shares of net exposure on a $155.87 stock. That is the single most important number in this trade — for ≈$55M of gross premium changing hands, the directional footprint is tiny. This is capital being repositioned in time, not a new wager on VST's price.
✅ RESOLVED — Next-Day OI Is In (August 4, 2026 pre-market)
The OPRA open-interest snapshot timestamped August 4, 2026 ≈06:30 ET reflects the close of business August 3 — the definitive open-vs-close test we flagged when this published. Here is what it says.
| Leg | Baseline OI (Aug-3 snap) | Resolving OI (Aug-4 snap) | Δ | Print size | Predicted | Verdict |
|---|---|---|---|---|---|---|
| Jun-17-2027 $195 put (sold) | 5 | 5,405 | +5,400 | 5,400 | ≈5,405 | ✅ OPEN (STO) — exact |
| Jan-15-2027 $195 put (bought) | 7,298 | 12,698 | +5,400 | 5,400 | ≈12,698 open / ≈1,898 close | 🔄 OPEN (BTO) — INVERSION |
Both predictions were on the board, and the opening one hit to the contract. We wrote that a close would take January open interest down toward ≈1,898 and an open would take it up toward ≈12,698. It printed 12,698 — exactly. Open interest rose by precisely 5,400 on both legs. Nothing was closed. No pre-existing position was rolled.
🔄 What this actually is: a new position, not an administrative roll
Our working read — flagged as inferred, not proven — was that a desk was pushing an existing deep-in-the-money short put five months further out. That read is now disproven. The correct description:
A desk opened a brand-new deep-in-the-money $195 put time spread — long the January 2027 leg, short the June 2027 leg — and was paid $3,321,000 to do it.
- It is a new risk, not a moved one. A roll changes when an existing obligation comes due; this desk had no meaningful position at either strike before August 3 (June open interest was literally 5 contracts) and now holds both legs. The $3.32M credit is compensation for taking on something new.
- The economics are a term-structure trade, not a directional one. They bought the nearer January put for $47.94 and sold the further June put for $54.09, capturing the $6.15/share difference in time value between the two expirations. Package delta is still only ≈−53,244 shares on a $155.87 stock, so the directional footprint remains tiny — that part of the original analysis holds.
- The risk profile is the opposite way round from a roll. In the roll reading, the desk was reducing near-term obligation and pushing it out. In reality it is short the long-dated leg — the June 2027 put, the one with far more time value left to lose if Vistra falls — while owning the shorter-dated January put that decays away first. The short June put is the live exposure to watch, and it runs five months past the January leg's expiry.
Honest limits: OPRA proves contracts opened at both strikes; it cannot show whether this desk holds Vistra stock, or another position that makes this package a hedge rather than a standalone carry trade. What is now proven is that the "roll" framing in the original headline and quick take was wrong.
🤓 What This Actually Means — Plain English
Let's slow down, because "sold puts" and "bought puts" in the same trade confuses people.
Start with the strike. $195 against a $155.87 stock is $39.13 of pure intrinsic value — these are deep in-the-money puts, practically stock-substitutes, not lottery tickets on a big move. Strip out the intrinsic value and here's what's left as pure time value:
- June-2027 leg (sold): $54.09 − $39.13 = $14.96 of time value
- January-2027 leg (bought back): $47.94 − $39.13 = $8.81 of time value
The $6.15 difference between those two numbers is the entire trade. By giving up $8.81 of remaining time value on the near leg and collecting $14.96 on the far leg, this package harvested a $6.15/share ($3.32M total) credit for pushing the same $195 obligation five months further into the future — from January 15, 2027 out to June 17, 2027.
What a deep-ITM short put actually is: an obligation to buy the stock at $195, no matter where it trades, in exchange for premium collected today. Sold at $54.09, the effective purchase price is $195 − $54.09 = $140.91 — about 9.6% below today's $155.87. That's a structurally bullish-leaning position (a short put behaves like a synthetic long), which is exactly why retail readers see "SELL PUT" in a headline and instinctively read it as bearish. It isn't.
But here's the part that matters most: the package's net delta is only ≈−53,244 shares, a rounding error relative to the ≈540,000-share notional each leg represents on its own. That tells us this roll did not meaningfully change the desk's directional exposure to Vistra — whatever bullish (or hedging) view justified the original short-put position stays roughly intact. What changed is the calendar: the obligation just moved five months further out, and the desk got paid $3.32M to make that move.
Context that supports the roll read: the January-2027 $195 put had 7,298 contracts of open interest before this trade — a large, pre-existing short-put position. If this is indeed a roll, it means roughly 74% of that position (5,400 of 7,298 contracts) just got pushed out to June 2027, leaving an estimated ≈1,898 contracts still on the books at the January expiration. We flag this as the strong inference, not a proven fact — tomorrow's OI print is the actual test.
Motive, if the roll read holds: this looks like routine position management on an existing short-put book — either continuing to collect premium on a stock-substitute position the desk is comfortable owning at ≈$141, or deferring assignment risk past Vistra's August 7 earnings date and deeper into 2027 while banking extra premium for doing so. It is not a signal that new bullish conviction just arrived.
📈 Technical Setup / Chart Check-Up
YTD Performance
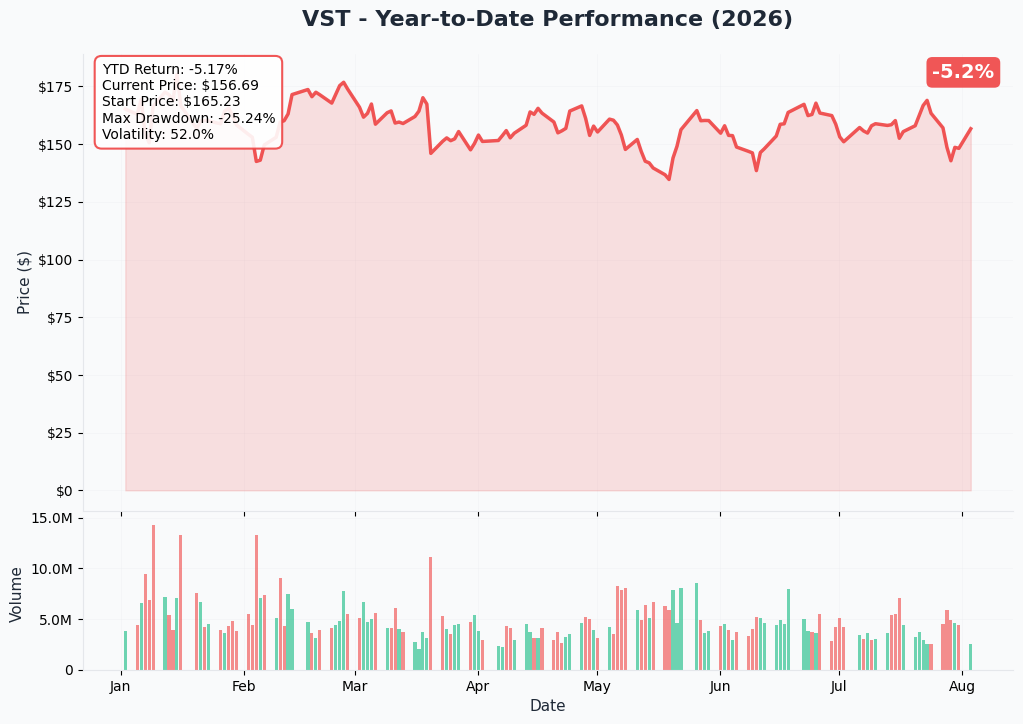
Vistra is down ≈5.2% over the trailing year on this chart, a far calmer picture than the raw 52-week range implies — shares have traded as low as $132.66 and as high as $219.82 in that window (a −24.87% peak-to-current move from the high), meaning most of the damage happened earlier in the period with a partial recovery since. This trade lands roughly in the middle of that year's range, not at either extreme.
Gamma-Based Support & Resistance
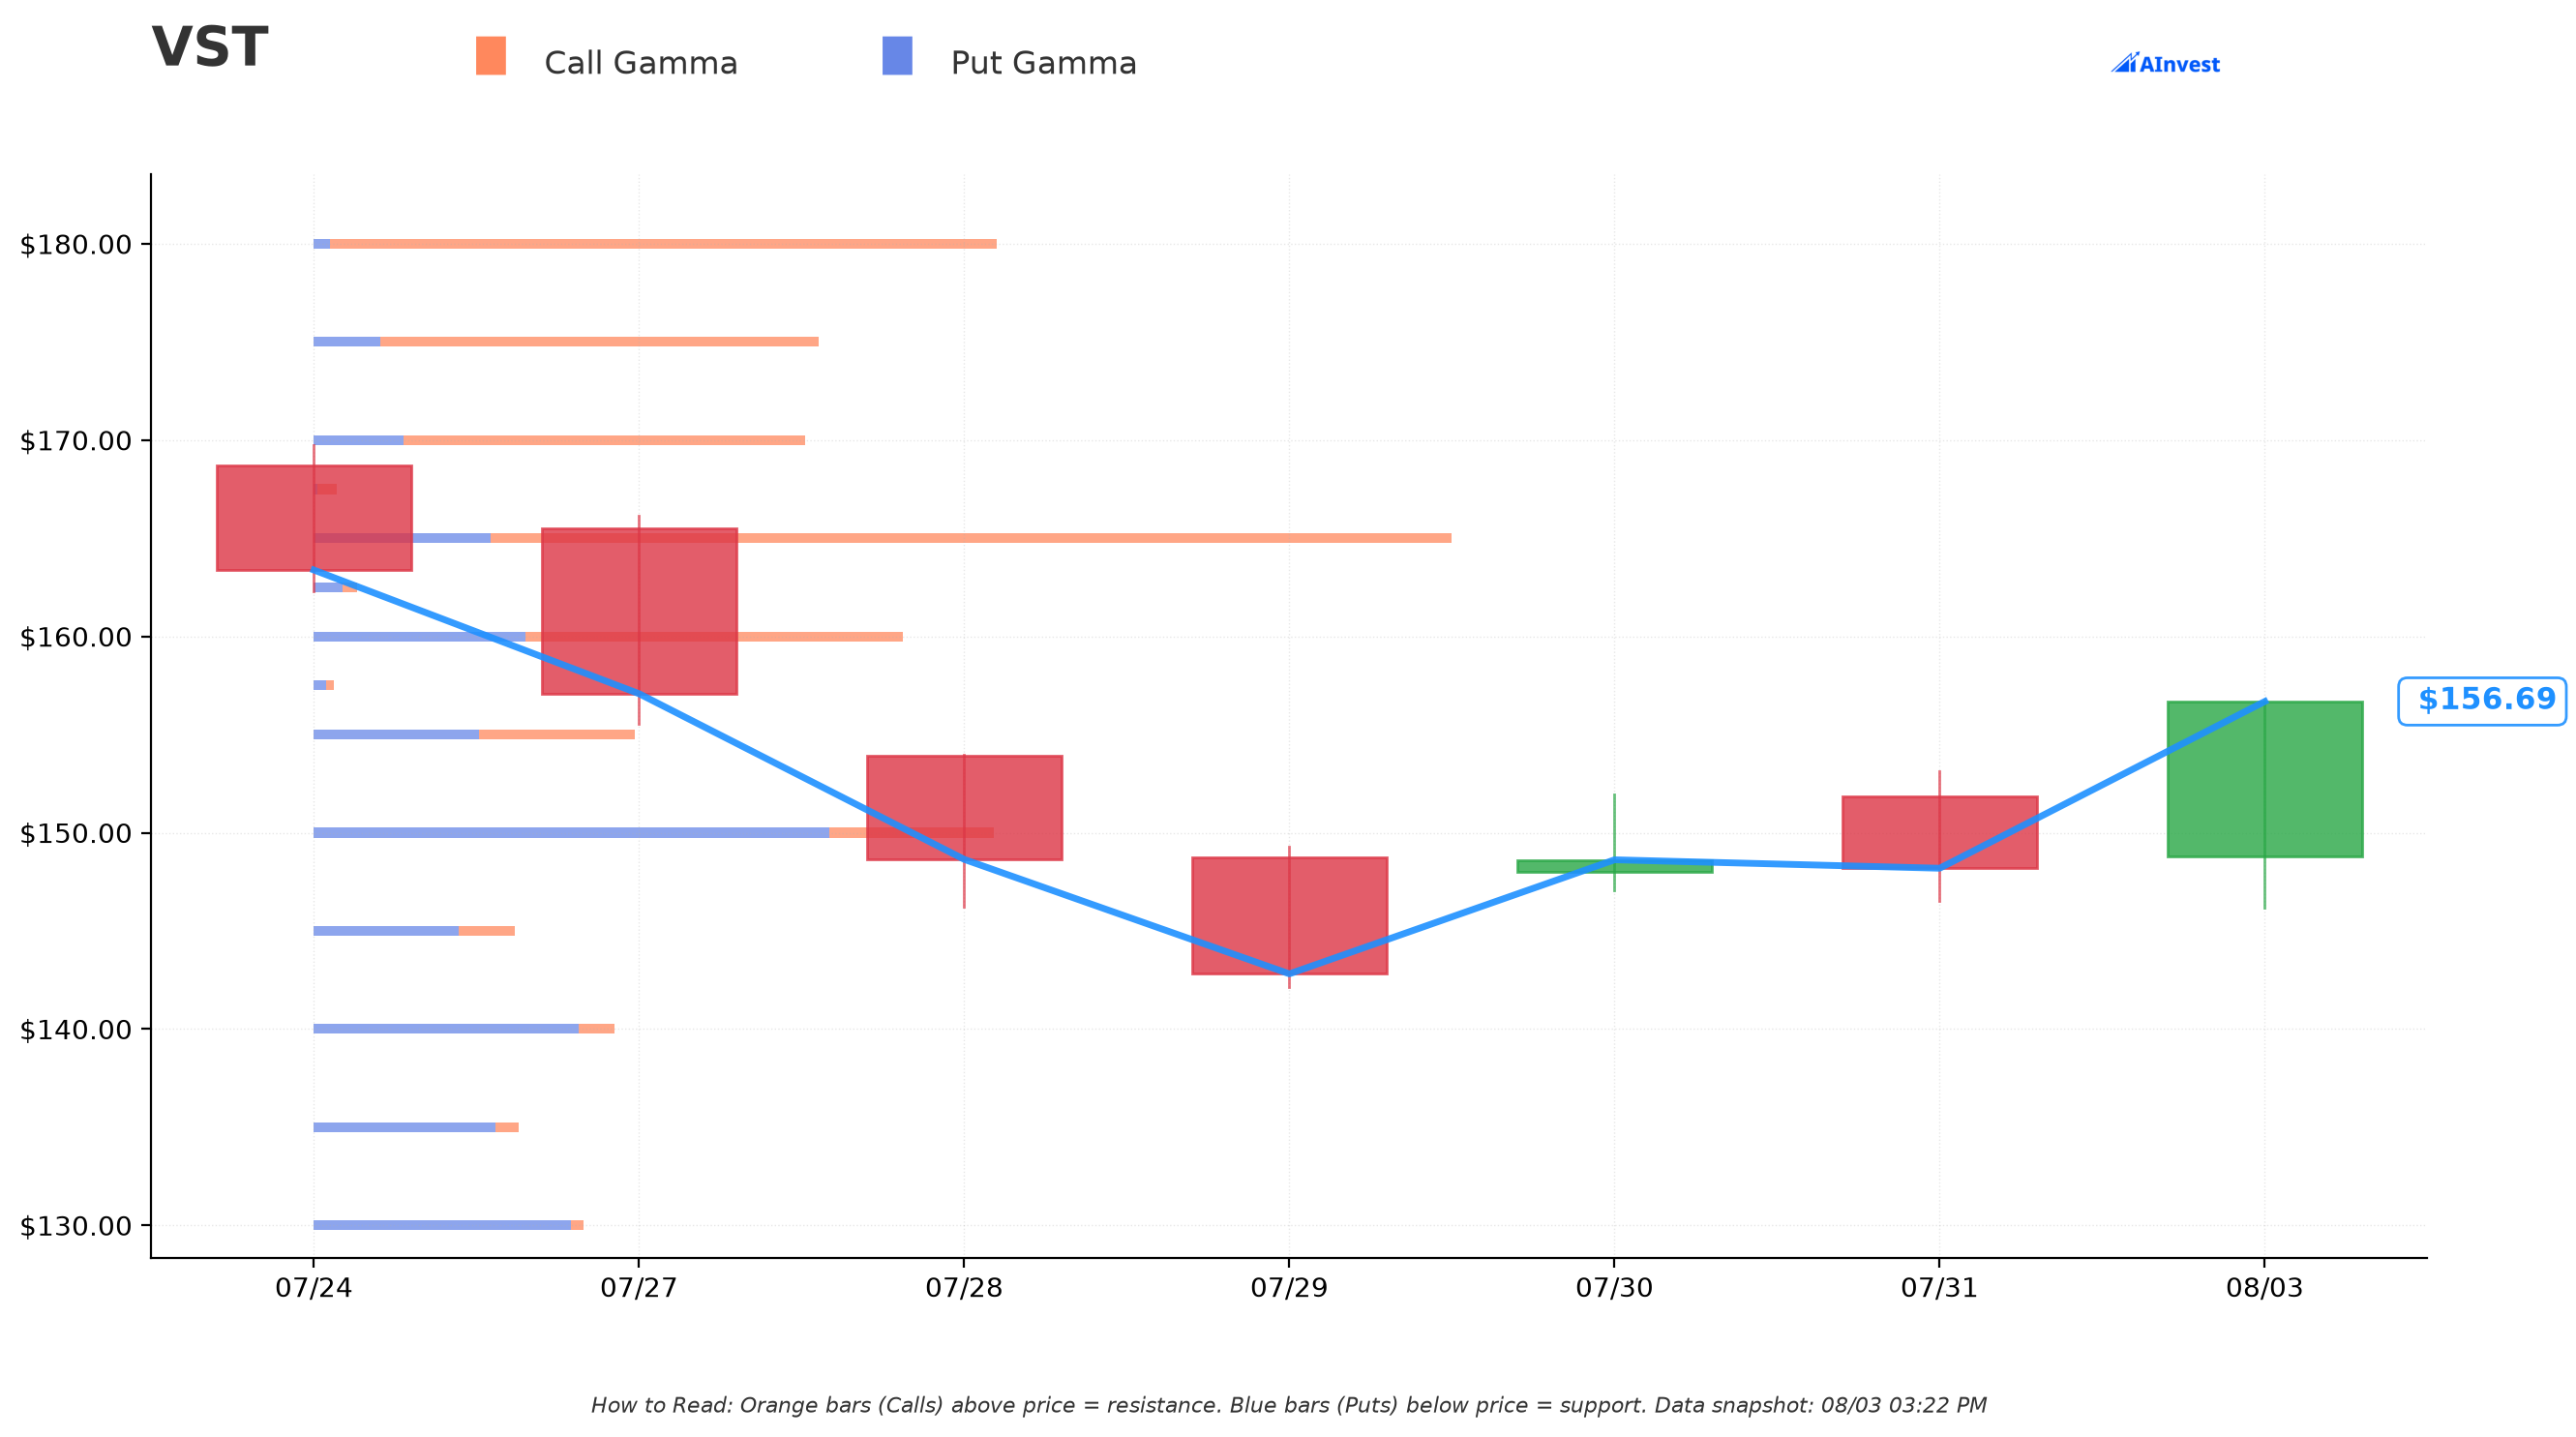
Current price: $156.69. Dealer gamma positioning shows:
- 🔵 $150 support — total gamma exposure ≈3.76 (put gamma ≈2.85, call gamma ≈0.91), rated Moderate, ≈4.3% below spot. This is the nearest meaningful floor from dealer hedging.
- 🟠 $160 resistance — total gamma ≈3.25 (call gamma ≈2.08, put gamma ≈1.17), Moderate, ≈2.1% above spot.
- 🟠 $165 resistance — total gamma ≈6.29 (call gamma ≈5.31, put gamma ≈0.97), rated Strong — the single biggest gamma wall on the board, ≈5.3% above spot, and the level flagged as today's primary resistance wall.
Worth noting: the $195 strike used in this trade shows meaningfully built-up gamma too (total ≈1.93, mostly put gamma ≈1.53) — it sits ≈24.4% above spot, in the same neighborhood as the $190 ($2.54 total) and $200 ($1.84 total) strikes where real options positioning has accumulated. That's consistent with $195 being a strike where large institutional put positions — including whatever originally opened the 7,298-contract Jan-2027 open interest — have concentrated.
Implied Move Analysis
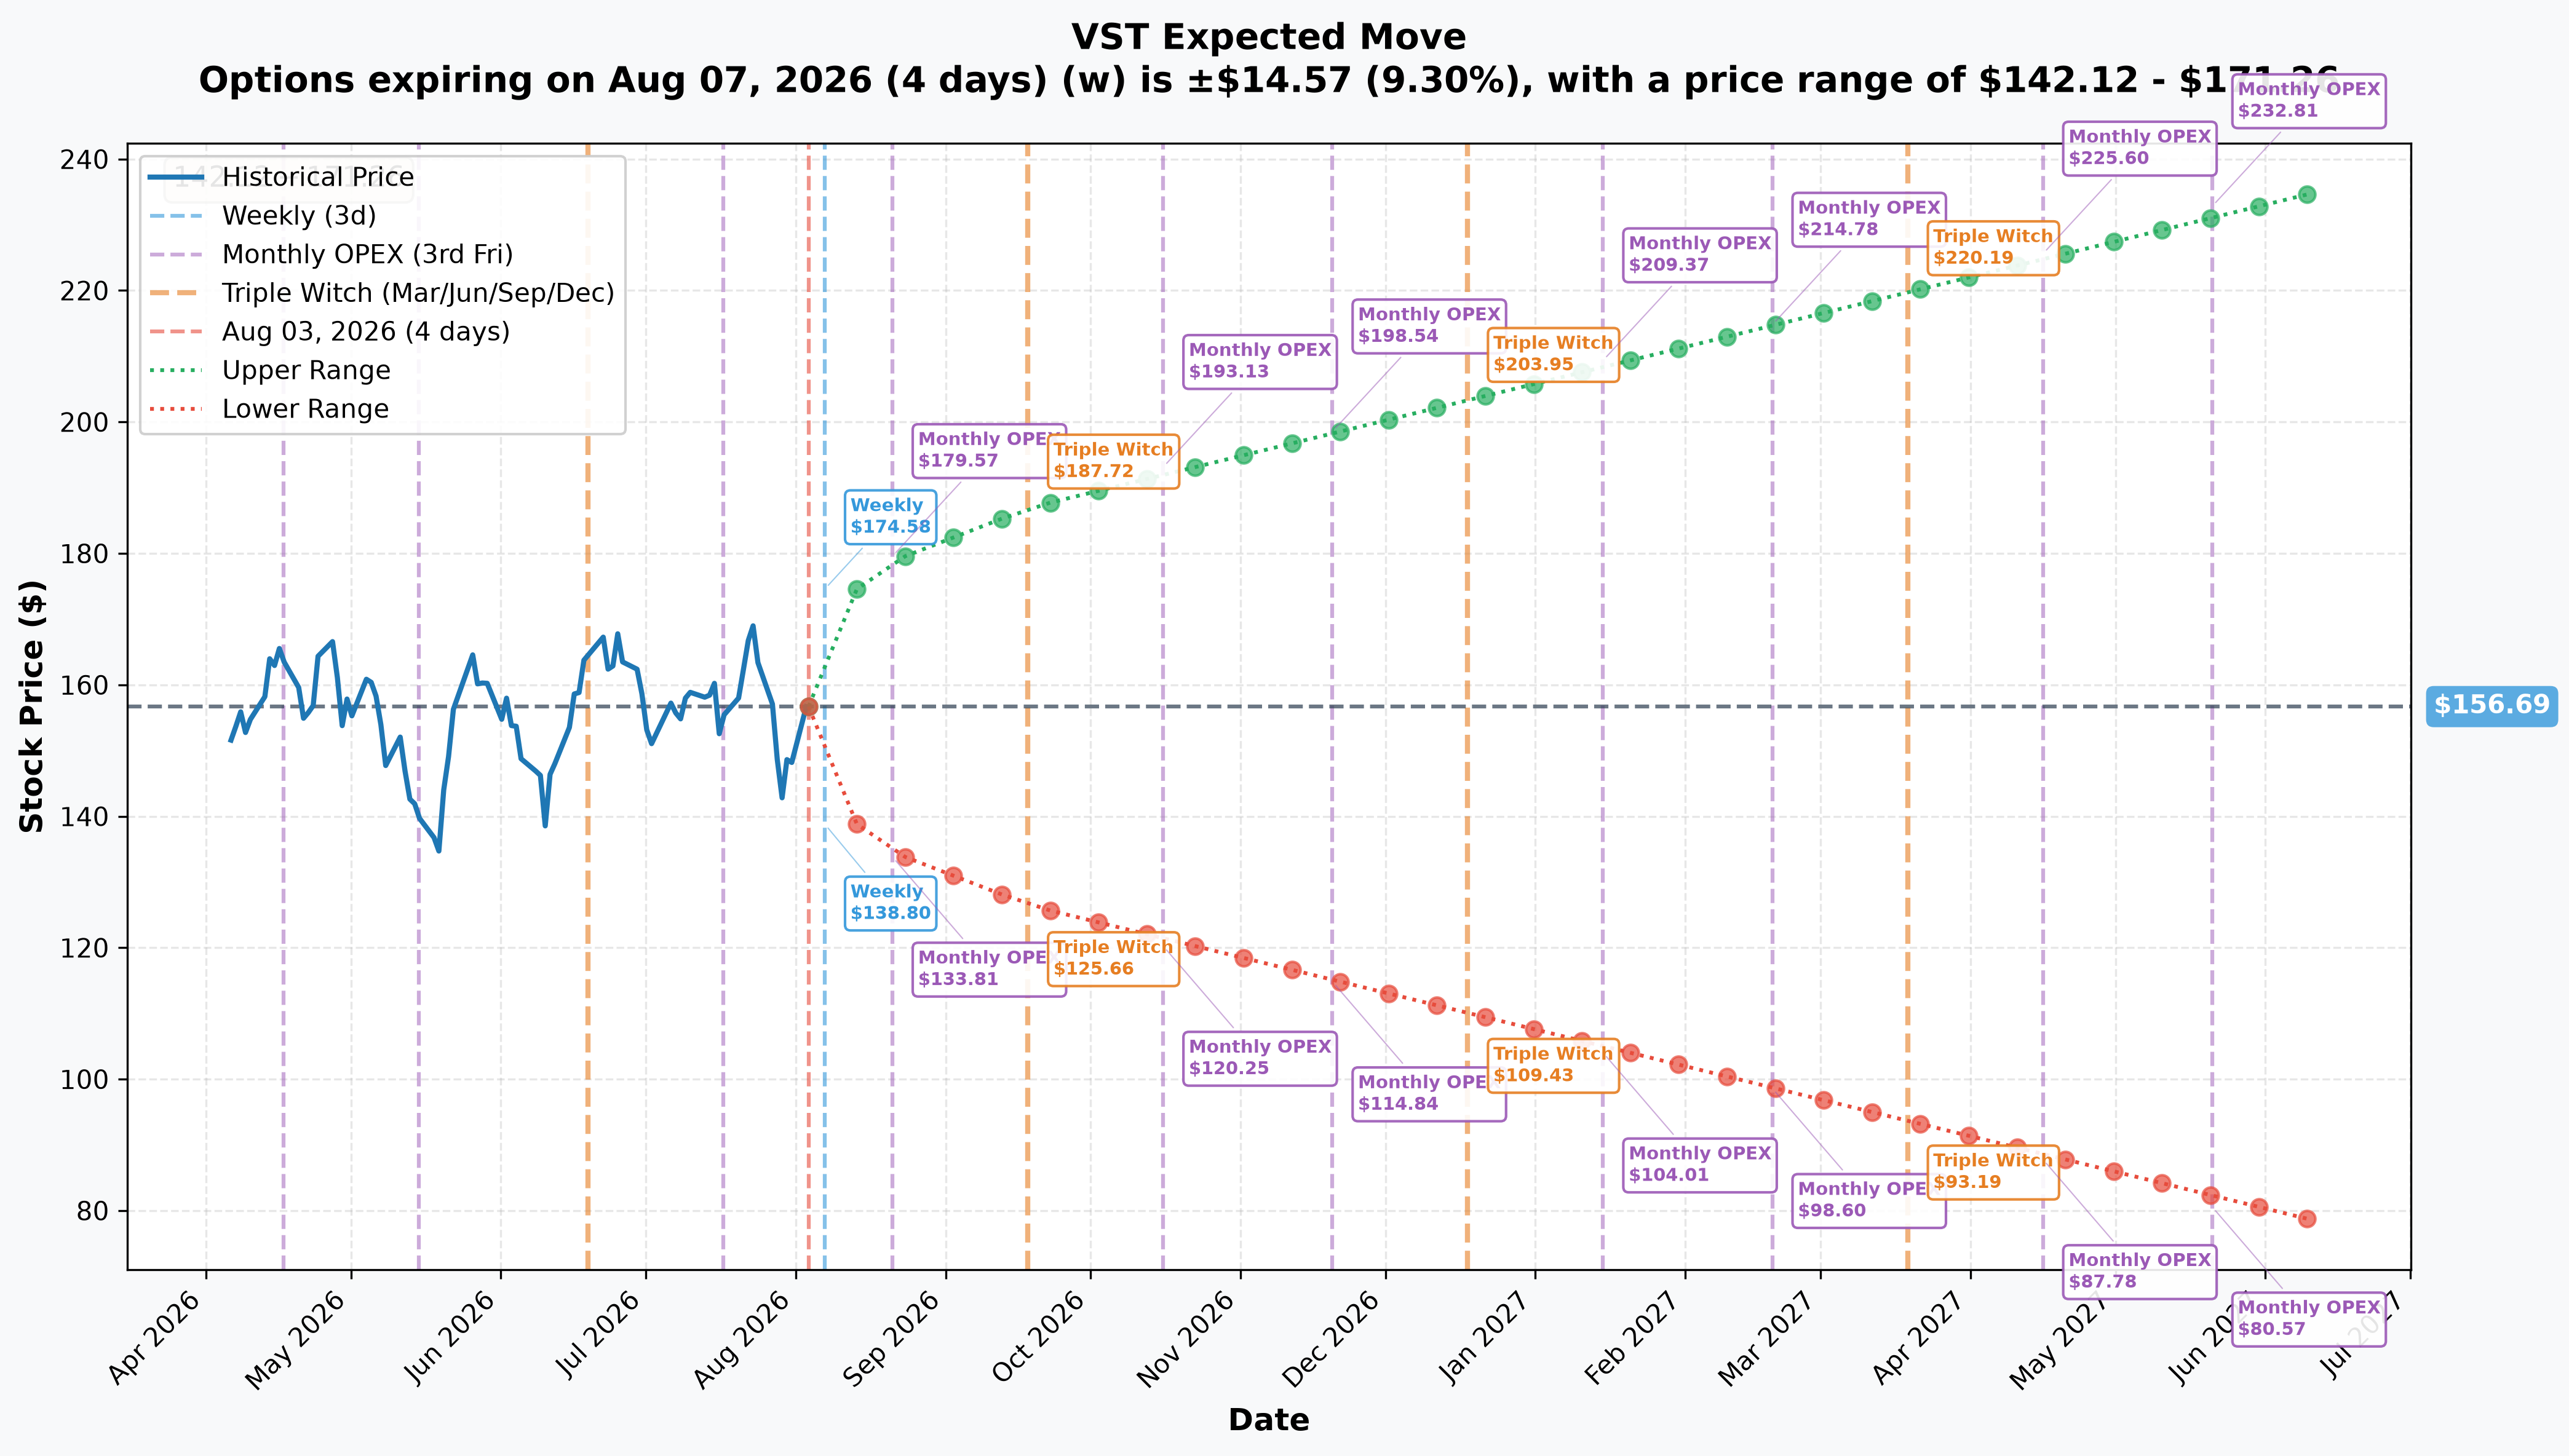
Options are pricing real movement into and beyond Vistra's confirmed August 7 earnings date:
- 📅 Weekly (Aug 7 — 4 days): ±9.3% (±$14.57) → range $142.12 – $171.26
- 📅 Monthly OPEX (Aug 21 — 18 days): ±14.24% (±$22.31) → range $134.38 – $179.00
- 📅 Quarterly Triple Witch (Sep 18 — 46 days): ±19.34% (±$30.31) → range $126.38 – $187.00
- 📅 Yearly LEAPS (Jun 17, 2027 — 318 days, this trade's new far expiration): ±50.66% (±$79.37) → range $77.32 – $236.06
For context on the near leg's original January 15, 2027 expiration, the options-derived cone for that date runs roughly $104 – $209. In both cases, the $195 strike sits comfortably inside the market's own implied-move band rather than out at some extreme tail — one more reason this reads as position management on an already-established strike rather than a fresh, aggressive directional bet.
🎪 Catalysts
✅ Already Happened
Q1 2026 earnings beat — reported May 7, 2026. Vistra posted GAAP net income of $1,029M and Adjusted EBITDA of $1,494M, smashing the $1.32 EPS consensus with $2.87 actual — a +$1.55 beat — and reaffirmed full-year Adjusted EBITDA guidance of $6.8B–$7.6B. That said, the three quarters before it (Q4 2025, Q3 2025, Q2 2025) all missed headline EPS consensus, so the base rate on the print itself is mixed even though Adjusted EBITDA is what the market actually trades on for this name.
KKR's Helix Digital Infrastructure launch — June 11, 2026. KKR launched Helix Digital Infrastructure with over $10 billion of capital commitments, naming Vistra as a founding investor alongside NVIDIA and the Kuwait Investment Authority. This gives Vistra direct equity exposure to AI data-center capacity buildout, not just a power-supply contract.
Two investment-grade credit upgrades — December 2025 and March 17, 2026. S&P upgraded Vistra to investment grade in December 2025; Fitch followed with a BBB− upgrade on March 17, 2026, explicitly citing Vistra's hyperscaler partnerships with Amazon and Meta as supporting the improved credit profile.
Dividend raised — declared July 29, 2026. The quarterly dividend moved from $0.2290/share to $0.23/share (payable September 30, 2026) — a small, buyback-led capital-return story rather than an income one, with the annualized $0.92 rate yielding under 1%.
Fresh analyst target trims — July 27–28, 2026, days before this trade. UBS cut its target from $233 to $227 and TD Cowen cut from $230 to $222 — both remain Buy-rated, so these are estimate-deck trims inside a bullish rating, not thesis reversals. In the same week, Morgan Stanley raised its target from $208 to $212. Overall analyst sentiment stays firmly bullish: 17 analysts, average target $229.88, range $187–$298, zero Sell ratings — though that $187-to-$298 spread (a 59% dispersion) shows genuine disagreement on how much AI-power optionality to price in.
PJM's 2028/2029 capacity auction results published — July 14, 2026. PJM confirmed publication of the Base Residual Auction results for the 2028/2029 delivery year — a first-order input to forward EBITDA for Vistra's PJM nuclear and fossil fleet (Perry, Beaver Valley). The specific clearing price was not independently verifiable for this piece and is not asserted here.
🔮 Still Ahead — Inside Both Expirations
Q2 2026 earnings — Tuesday, August 7, 2026, before the open, company-confirmed. Vistra issued a scheduling release on July 6, 2026 confirming the date and a 10:00 a.m. ET call — this is company-confirmed, not a third-party estimate. It lands just two trading days after this options trade and sits inside the life of both the January-2027 and June-2027 expirations. Consensus is $2.12 EPS, with full-year EPS growth expected at 16.72%, from $9.39 to $10.96. Given the mixed recent beat/miss record on the headline number, the market is more likely to react to the Adjusted EBITDA guidance and any 2027 commentary than to the EPS line itself.
Nuclear and hyperscaler PPA news — unscheduled, ongoing. Vistra's credit upgrades already confirm live Amazon and Meta power partnerships tied to its nuclear fleet (Comanche Peak, Perry, Beaver Valley); specific plant-level contract terms have not been independently verified for this piece. Any expansion or new announcement here is a live catalyst for the rest of 2026.
Ongoing Helix Digital Infrastructure buildout. First site announcements or capital-call sizing from the KKR/NVIDIA/Vistra joint venture would be a discrete, tradeable headline sometime before the June 2027 expiration this roll extended into.
🎲 Four-Reader Take
🎰 YOLO Trader
There's not much here for you. The whole point of this trade is that it carries almost no net directional exposure — ≈53,000 shares of delta on a $52.8B company is nothing to chase. If you want a real directional swing into the August 7 print, a defined-risk call or put debit spread expressed with normal position sizing is a cleaner way to do it than trying to mimic a $55M roll.
📈 Swing Trader
Watch the $150 gamma support and $165 gamma resistance heading into earnings — that's the range dealer hedging is most likely to defend in the next two weeks. The weekly implied move (±9.3%, or $142–$171) already prices a real post-earnings swing regardless of what this options trade tells you.
💰 Premium Collector
This is your playbook, scaled up enormously. Selling deep-ITM puts and rolling them forward for extra premium when they're near expiration is a real, repeatable income strategy — just at retail size and with strikes closer to the money, where assignment risk is a choice rather than a near-certainty like it is here.
🌱 Beginner
The big lesson: a "SELL PUT" headline and a "BUY PUT" headline printed together in the same trade are not a bullish/bearish argument with itself — they can just be the same position moving through time. When you see paired legs at the same strike with different expirations, check which one has more open interest before assuming anything about direction. Here, that check is exactly what makes the roll story the likely one.
⚠️ Risk Factors & Honest Limits
- We cannot prove this is a roll. The strongest evidence — identical strike, identical size, near-zero package delta — supports it, but Leg 2's close-vs-open status is genuinely unresolved until tomorrow's OI snapshot. If it turns out to be a fresh long-put open instead of a close, the "just moving the clock" read would need to be revisited.
- No stock leg is visible on this tape. We cannot see whether this desk holds an offsetting long-stock, long-call, or other hedge that changes the true net exposure of their overall book. The ≈−53,244 share package delta describes these two option legs only.
- The tape cannot show broker identity, customer identity, or order ID. We know two counterparties transacted a pre-arranged cross; we do not know who they are or why beyond what the structure itself implies.
- Deep-ITM short puts carry real assignment risk regardless of intent. If Vistra is anywhere below $195 at either expiration, assignment near $140.91 effective is the likely outcome, not a tail case — whoever holds this short book at expiration should be prepared to actually own the stock.
- Confidence: HIGH on mechanism (multi-leg block cross, confirmed on 100% of prints) and on Leg 1's open (5,400 vs. prior OI of 5). PROVISIONAL on Leg 2's close-vs-open status — treat the "roll" framing as our best inference, not a proven fact, until the next-day OI check.
Disclaimer: Options trading involves substantial risk of loss and is not suitable for all investors. This analysis is for educational purposes only and is not financial advice. Deep-in-the-money put positions carry real, likely-not-remote assignment risk. Always do your own research and consider consulting a licensed financial advisor before trading.
About Vistra Corp.: Vistra is an independent power producer and retail electricity provider with 44 gigawatts of generation capacity across natural gas, nuclear, coal, and solar/battery storage, serving ≈5 million retail customers in 20 states, with a market cap of ≈$52.8 billion in the Electric Services industry, listed on the NYSE.
Last updated: August 4, 2026 — next-day OPRA open-interest resolution added (✅ RESOLVED box above). Original analysis published August 3, 2026.