🛡️ XLP's $78 Put Protection Was Rolled September → December — Resolved as a ≈$6.6M Roll, Not a $10.1M New Bet
📅 August 5, 2026 | 🔥 Unusual Activity Detected
✅ Updated 2026-08-06 pre-market — the ambiguity we flagged is now settled, and it went the way the article's own test predicted. We wrote that if September open interest fell to roughly ≈5,526, the near leg had closed and this was a calendar rather than a double-long. It fell to 5,522. The September $78 line was wiped out (−80,107) and the December $78 line grew by +85,032. This is a put roll-out — the same $78 protection, pushed three months further out — with a real net cost of ≈$6.57M, not the $10.1M headline. Full OI table below.
🎯 The Quick Take
At 09:51:46 ET on August 5, with XLP trading at $84.89, a trader put on a two-legged package at the $78 strike — 80,103 contracts in September and 80,103 in December, printed the same second as one multi-leg auction package, for a reported $10.1M combined outlay. We flagged on the day that we could not tell a double-long from a calendar, because the September leg's size sat below its prior open interest.
The next-day open interest resolved it: it was a roll. The September $78 puts were closed out almost to the contract, and December $78 puts were opened in their place. So this is not someone initiating $10.1M of fresh downside protection on consumer staples — it is someone who already owned that protection choosing to extend it, at a true net cost of ≈$6.57M ($0.82 per share). The distinction matters: the position is a continuation, not a new alarm bell. What has not changed is the strike — the trader kept protection at $78, about 8.1% below spot, on the sector people usually run to, not away from.
🏢 What Is XLP?
XLP is the Consumer Staples Select Sector SPDR Fund, the largest and most liquid listed vehicle for the consumer staples sector, with $14.70B in assets and a rock-bottom 0.08% expense ratio (StockAnalysis). It holds 38 companies selling "essential consumer goods" — food, beverages, and household products — the kind of stuff people keep buying in a recession. The fund is heavily concentrated: the top 10 holdings are 62.18% of assets, led by Walmart (10.39%), Costco (8.97%), and Coca-Cola (7.16%) (StockAnalysis). Walmart and Costco alone are 19.36% of the fund — meaning XLP is really more of a retailer-and-beverage bet than a diversified basket, and it's more concentrated than SPY (top 10 = 37.06% of 505 holdings, per StockAnalysis SPY).
XLP has badly lagged the broader market: +8.81% one-year total return versus SPY's +23.58%, a gap of roughly 14.8 percentage points (StockAnalysis XLP · StockAnalysis SPY). It trades at 22.57x earnings versus SPY's 26.82x, and pays a 2.58% dividend yield versus SPY's 0.98% (StockAnalysis) — the classic defensive, bond-proxy profile. Today's price sat at $85.28, about 5.4% below its 52-week high of $90.14 (StockAnalysis).
💰 The Trade — Full Details
Both legs printed as multi-leg auction trades — a facilitated, exchange-run price-improvement mechanism, not a cross with a pre-negotiated counterparty and not a sweep taking out the lit order book. That's an important distinction: it means the order was worked and matched through the exchange's auction process rather than crossed off-book or fired aggressively into displayed liquidity.
| Time | Buy/Sell | Call/Put | Expiration | Premium | Strike | Volume | OI | Size | Spot | Option Price | Option Symbol |
|---|---|---|---|---|---|---|---|---|---|---|---|
| 09:51:46 | BUY | PUT | 2026-09-18 | $1,762,266 | $78 | 85,025 | 85,629 | 80,103 | $84.89 | $0.22 | XLP20260918P78 |
| 09:51:46 | BUY | PUT | 2026-12-18 | $8,330,712 | $78 | 85,082 | 25,080 | 80,103 | $84.89 | $1.04 | XLP20261218P78 |
🤝 Multi-Leg Auction — as reported: $10,092,978 combined premium across both legs. That headline number is now known to overstate the trade. The resolving open interest (below) proves the September leg was a close, so the real economics are a net debit of ≈$0.82 per share, or ≈$6.57M ($8,330,712 paid on December minus $1,762,266 recovered on September).
The ambiguity we flagged, and how it resolved. Both legs were reported as BUYS, at the same $78 strike, in two different expirations. Taken literally that would be a double-long — two stacked outright long-put positions for a combined $10.1M. We said at the time that this is an economically unusual shape, and that the per-leg buy/sell tags on a multi-leg auction package are not reliable read-outs of each leg's true side. They were not: September open interest collapsed from 85,629 to 5,522, which can only happen when contracts are being extinguished, never when they are being created. The September leg was closed; the December leg was opened. That is a roll.
✅ RESOLVED — next-day open interest settled it, and our published test called it almost to the contract
Updated 2026-08-06 pre-market. The ≈06:30 ET OPRA open-interest snapshot (reflecting the August 5 close) has published.
| Leg | Baseline OI (Aug-5 snap) | Resolving OI (Aug-6 snap) | Δ | Print size | Δ as % of print | Day vol | Verdict |
|---|---|---|---|---|---|---|---|
| Sep-18-2026 $78 P | 85,629 | 5,522 | −80,107 | 80,103 | ≈−100.0% | 85,025 | ✅ CLOSE — the near leg was retired |
| Dec-18-2026 $78 P | 25,080 | 110,112 | +85,032 | 80,103 | ≈+106.2% | 85,084 | ✅ OPEN (BTO) |
We published two branches and the market took one of them cleanly. The article said: if September OI rises toward ≈165,732 it is a double-long; if it falls toward ≈5,526 the near leg closed. It printed 5,522 — four contracts off the predicted number. There is no residual ambiguity here.
So the structure is a put roll-out, not a calendar spread and not a double-long. The September $78 line had been sitting essentially untouched at ≈85,600 contracts for weeks — a held position, not churn. On August 5 that position was closed and an equivalent-size December $78 position was opened in its place. The trader kept the same strike and simply bought three more months of time.
One honest limit. Open interest proves contracts were extinguished in September and created in December. It cannot prove which side of the September leg this desk was on — selling a long it owned (the classic long-put roll-out, and by far the more common shape given the net-debit pricing) versus buying back a short it had written. The roll-out reading is our inference from the geometry and the $0.82 net debit, not something the tape establishes. Either way, the December protection is new and the September protection is gone.
What this changes in the numbers: net cost ≈$6.57M, not $10.1M. The package's true incremental downside exposure is the December leg alone, not the sum of both legs.
🤓 What This Actually Means — Plain English
This is a roll, and a roll is a very different message than a new position. Somebody owns the right to sell XLP at $78 — about 8.1% below where it was trading — and on August 5 they decided that right should last until December 18 instead of September 18. They did not add to it. They did not change the strike. They bought time, and only time, for ≈$0.82 per share.
Here's the plain-English version of a roll. Imagine you bought insurance on your house that expires in September. September is getting close, nothing bad has happened, and the policy is about to lapse — so you cancel it, recover whatever it's still worth, and buy a fresh policy at the same coverage level that runs through December. You are not doubling your insurance. You are not panicking. You are declaring that the risk you were worried about hasn't shown up yet, and you still want to be covered for it.
Why it matters that the strike stayed at $78. A trader who had grown more worried would roll down to a higher strike (more expensive, pays off sooner). A trader who had grown less worried would roll down in size or let it lapse. Keeping $78 and keeping the size at ≈80,000 contracts is a statement of unchanged conviction — same level of concern, longer runway. The new December window covers the September FOMC meeting, quarter-end, the midterms and year-end, rather than just the first of those.
Two things this is not. It is not $10.1M of fresh bearish money hitting consumer staples — the true incremental spend is ≈$6.57M, and even that mostly replaces protection that already existed. And it is not a sweep-style panic trade: the multi-leg auction mechanism tells us this was a worked, negotiated-style print, not someone hitting offers in a hurry. That still argues for "someone with a view and a plan" over "someone reacting to breaking news in real time" — but the view is now demonstrably an old view being maintained, not a new one being placed.
📈 Technical Setup / Chart Check-Up
YTD Chart
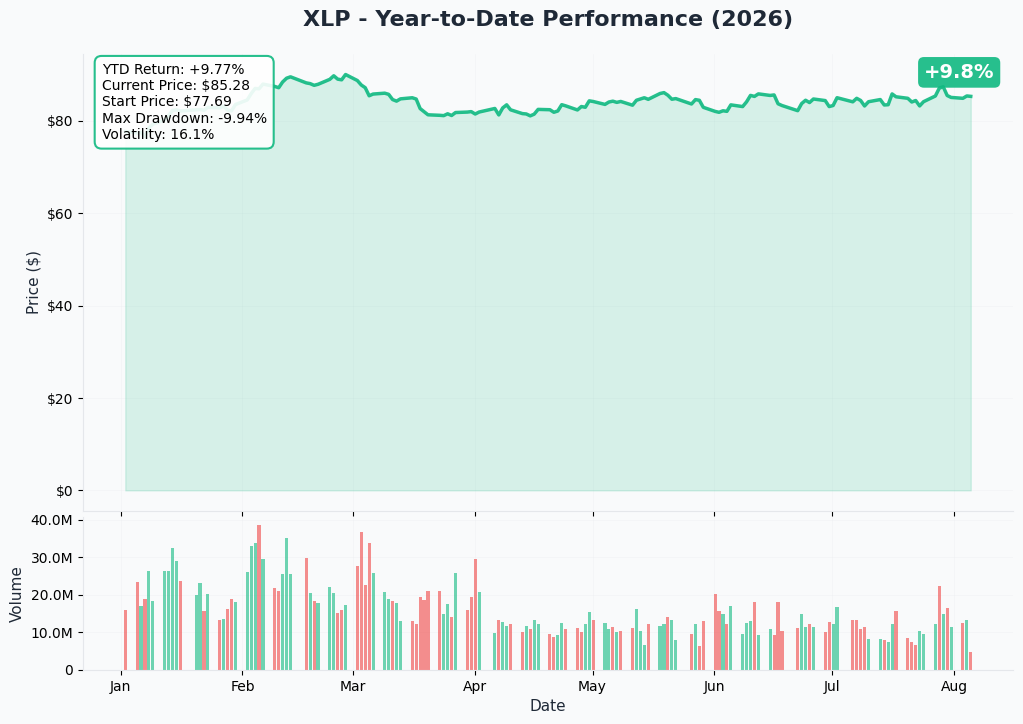
XLP has spent the year grinding well below its 52-week high of $90.14, currently sitting around $85.28–$85.30 — roughly 5.4% off that high and about 13.5% above its 52-week low of $75.16 (StockAnalysis). The one-year total return of +8.81% against SPY's +23.58% shows a sector that's been in a persistent relative downtrend, with no confirmed evidence yet of a turn.
Gamma-Based Support & Resistance Analysis
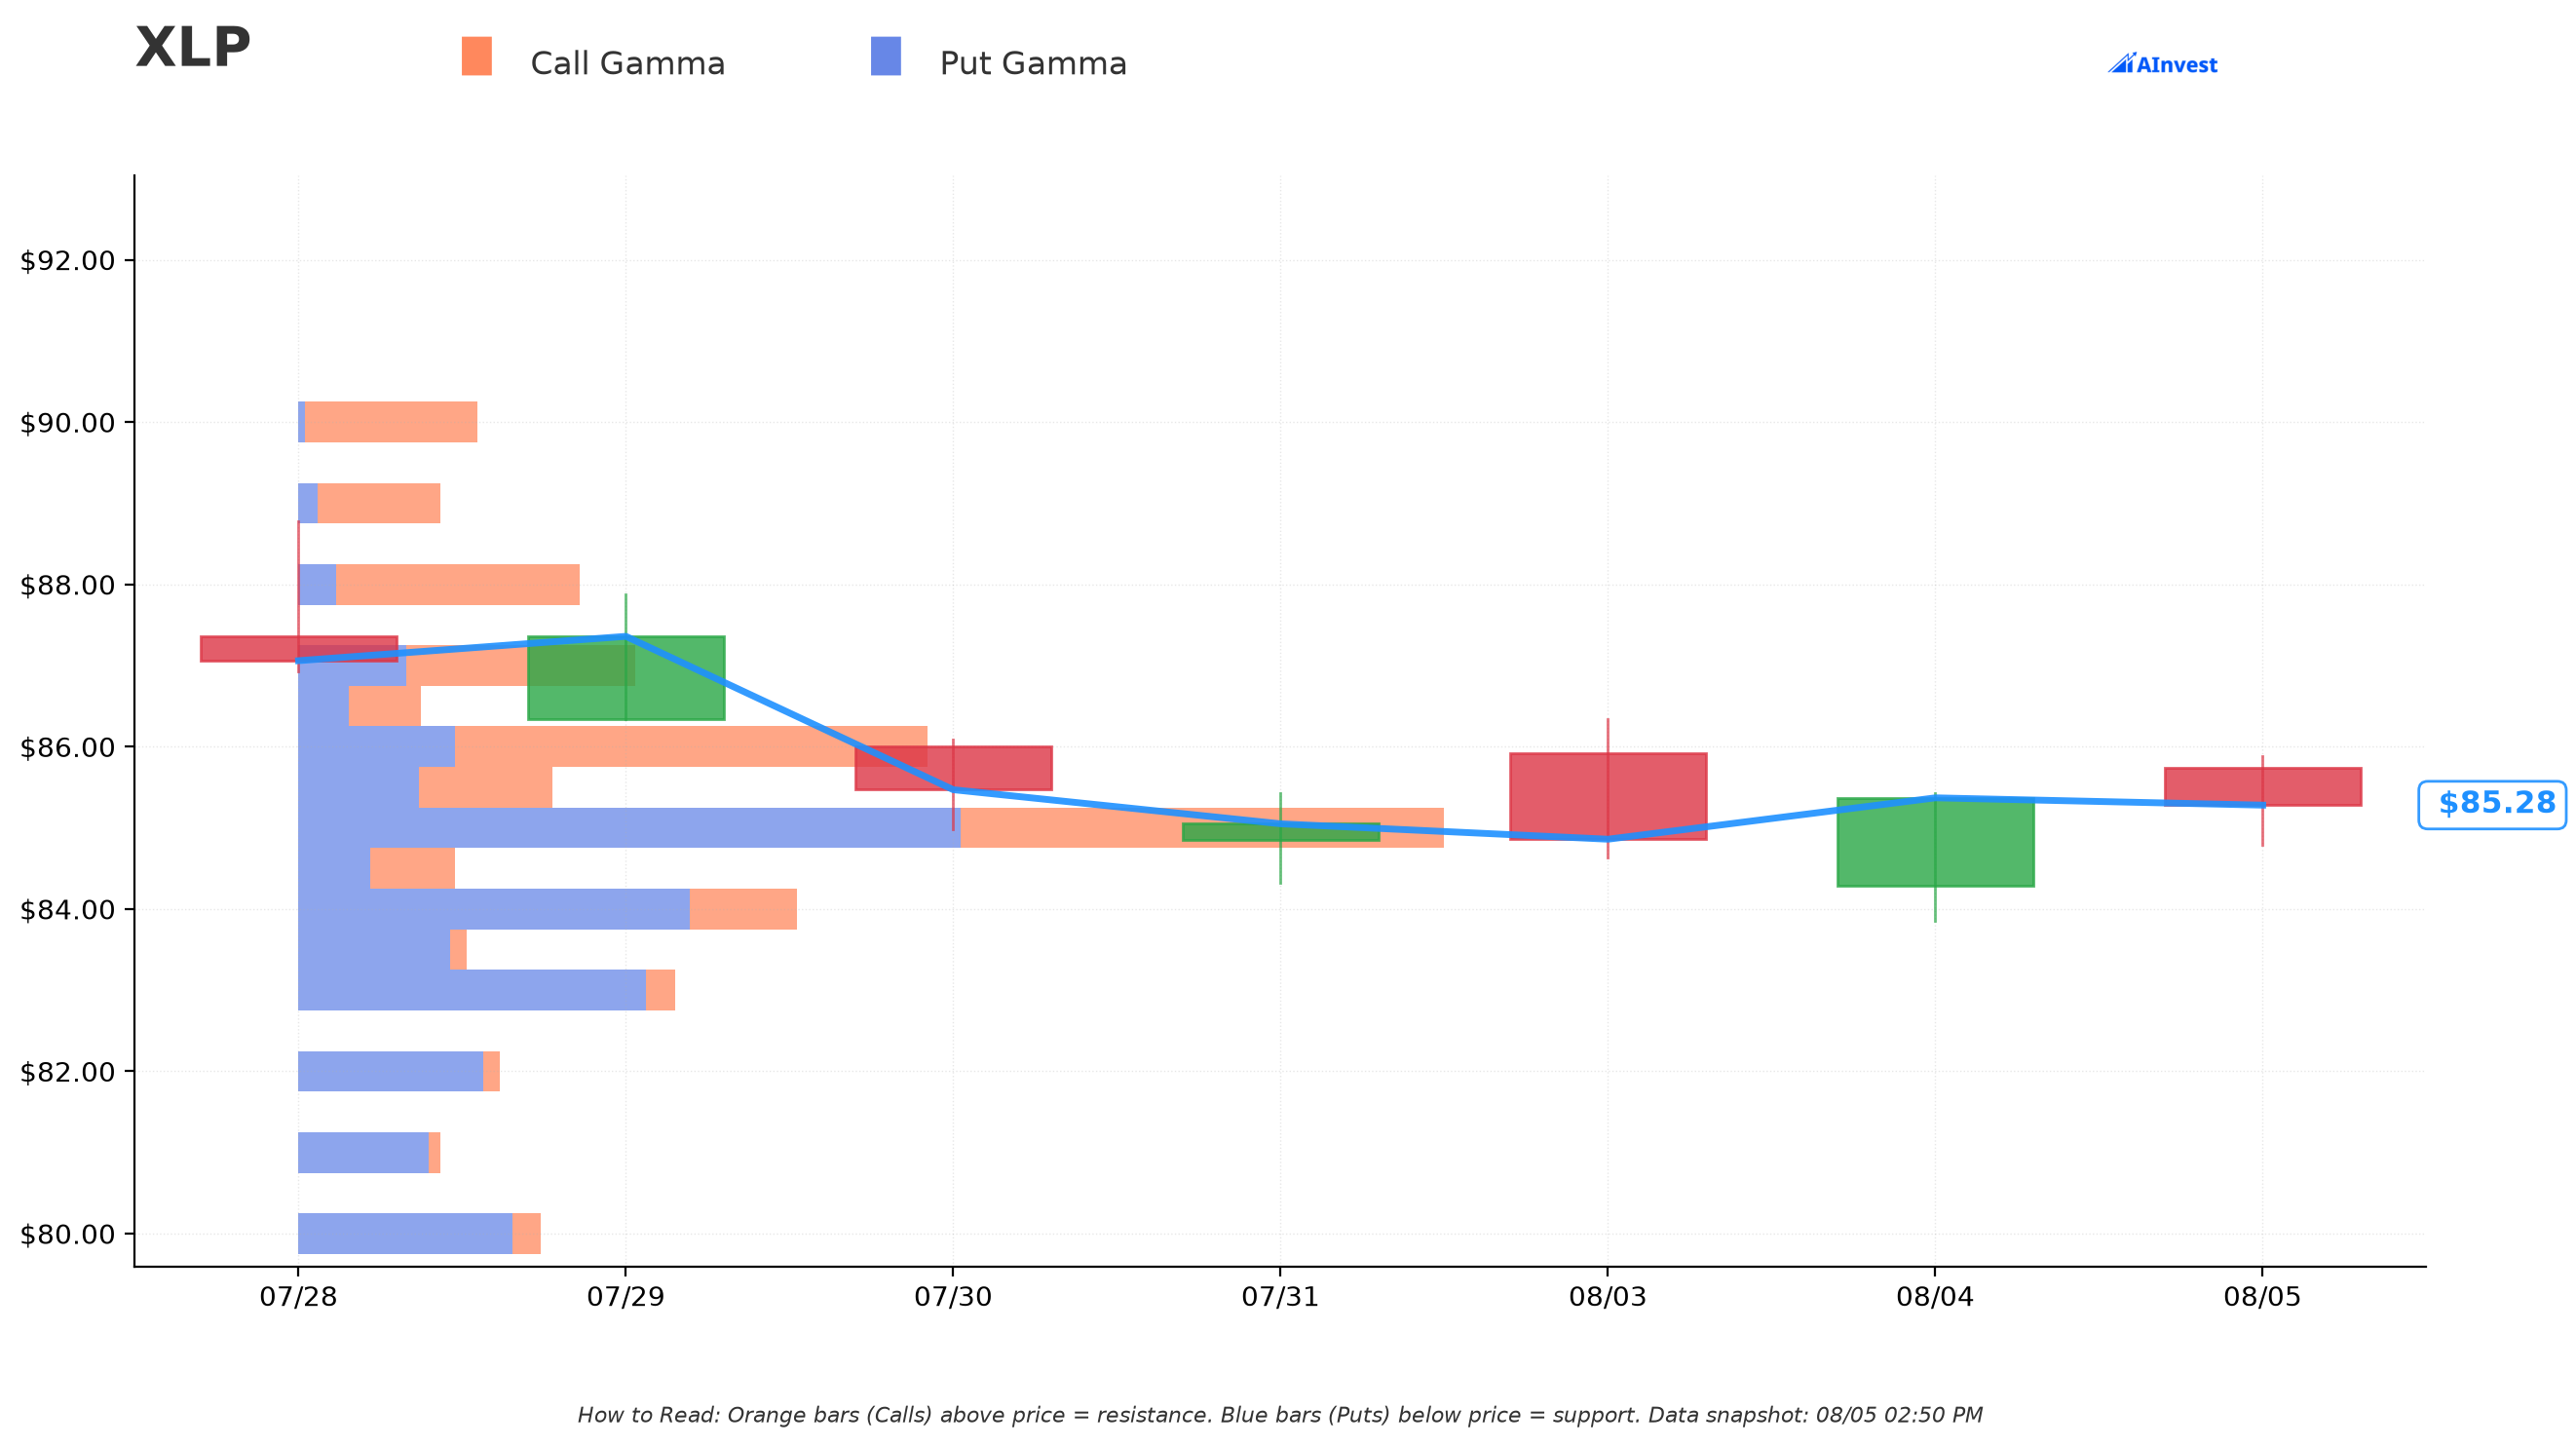
Reading the actual gamma exposure data with spot at $85.295:
- 🔵 Nearest support: $85 — "Very Strong," essentially sitting right on top of spot (0.35% away), with total gamma of 37.1 and put-side gamma (21.4) outweighing call-side (15.7).
- 🟠 Nearest resistance: $86 — also "Very Strong," just 0.83% above spot, with total gamma of 20.4, this time call-heavy (15.3 call vs. 5.1 put).
- 🔵 A second, notable support layer sits right at $78 — total gamma of 24.1, almost entirely put-side (24.0 of the 24.1), 8.55% below spot. That's the exact strike this morning's put trade targeted. In other words, the trader picked a strike where dealer gamma positioning already has some structural weight — not a random round number.
- Farther out, secondary support shows up at $84, $83, $82, $80, and $83.5/$84.5, while resistance extends to $87, $88, $85.5, and $90 — all still tightly clustered, meaning the options market currently has most of its attention on the $80–$90 band.
These levels shift daily as new options print and existing ones expire — treat them as a current snapshot, not a fixed line in the sand.
Implied Move
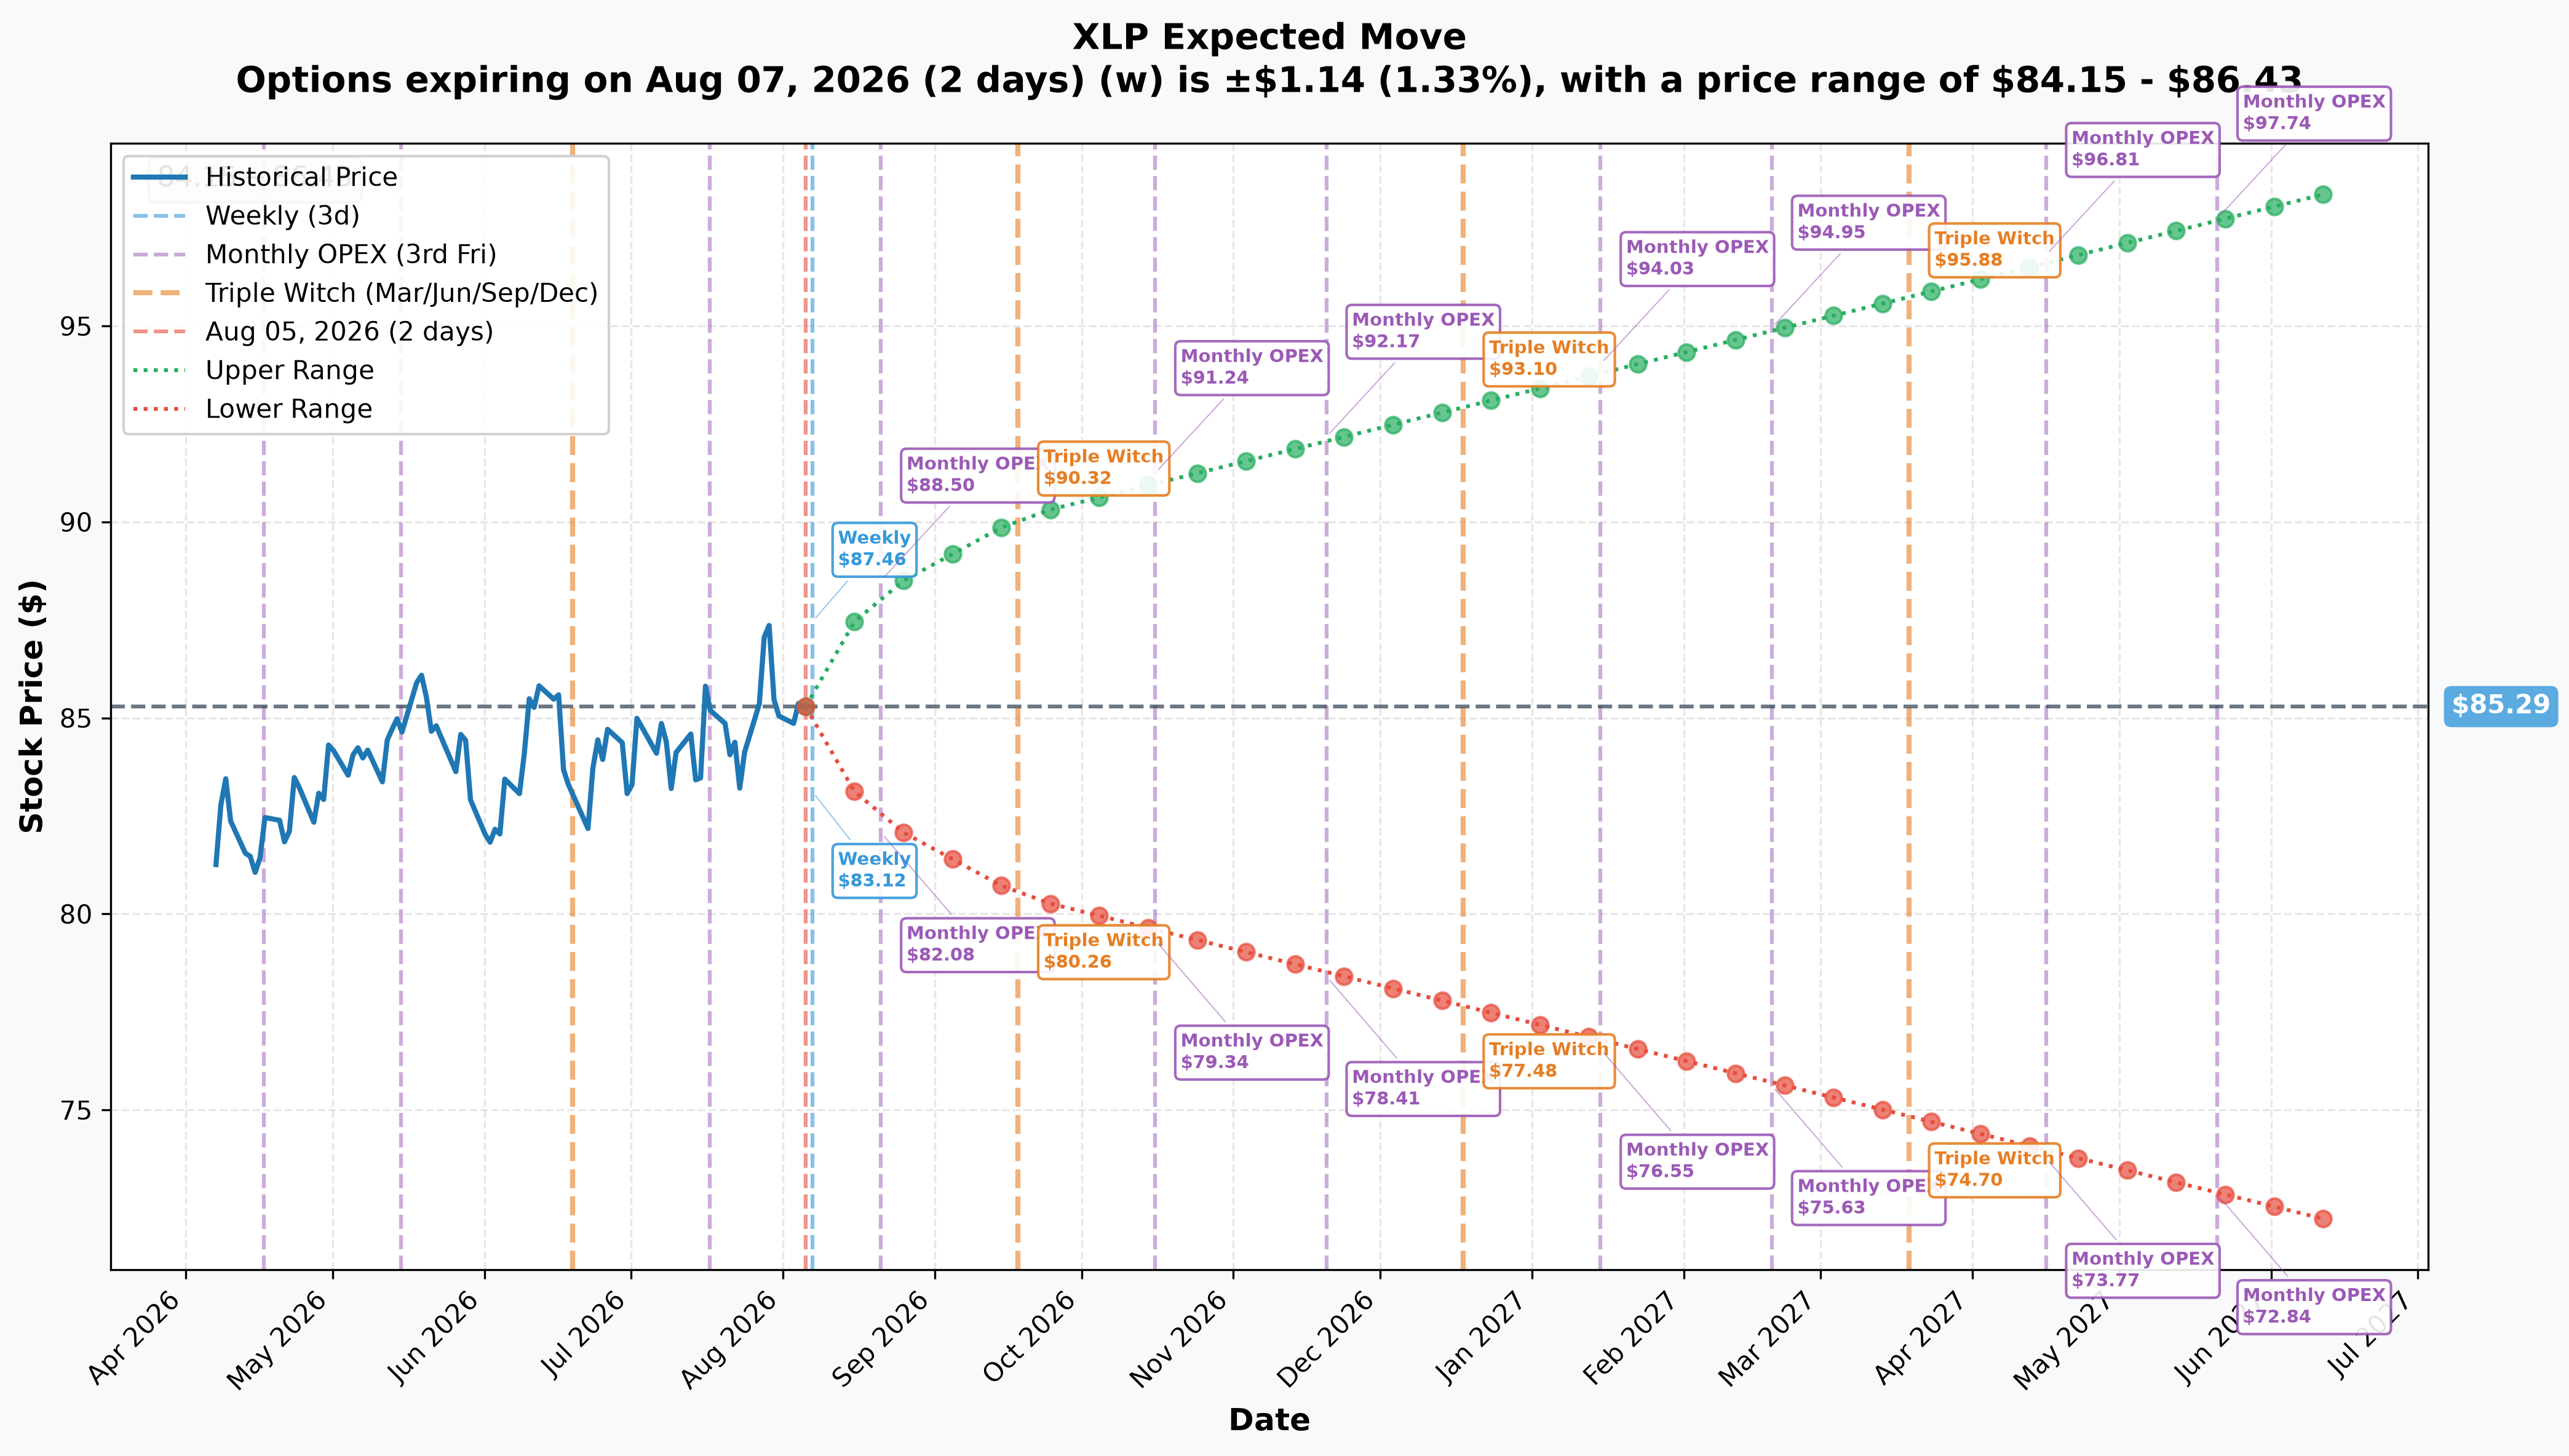
Pulling the real numbers from the options chain (quote-midpoint implied volatility, spot $85.29):
| Expiry | Days | Implied Move | Range |
|---|---|---|---|
| Weekly (Aug 7) | 2 | ±1.33% (±$1.14) | $84.15 – $86.43 |
| Monthly OPEX (Aug 21) | 16 | ±3.45% (±$2.94) | $82.35 – $88.23 |
| Triple Witch (Sep 18) | 44 | ±5.68% (±$4.84) | $80.45 – $90.13 |
| LEAPS (Jun 17, 2027) | 316 | ±15.53% (±$13.25) | $72.04 – $98.54 |
This is where the two legs tell different stories. The September leg expires exactly on that Triple Witch date, September 18 — and the $78 strike (8.1% below the $84.89 trade-time spot, ≈8.55% below current spot) sits below the market's own ±5.68% implied-move floor of $80.45. That means the September put is priced for a move bigger than what the options market is currently pricing as "normal" for that expiry — this leg is genuine tail insurance, not a base-case hedge.
The December leg is a different story. The implied-move chart's own December 18 Triple Witch cone (from the OPEX label set) runs from $77.48 to $93.10 — meaning the $78 strike sits just inside the lower edge of what the market considers a plausible move by mid-December (roughly a ±9.15% band). So the December protection is priced much closer to the market's own view of "how far XLP could realistically fall" over that horizon, while the September protection is a bet on something sharper and faster than the market currently expects.
🎪 Catalysts
Already Happened
- The Fed held on July 29, 2026 at 3.50–3.75%, but on a vote with three dissents in favor of a HIKE, not a cut, according to the Federal Reserve's July 29 press release. That's directly relevant to XLP: staples are bond-proxy stocks, and a 2.58% dividend yield competes poorly against a 3.50–3.75% policy rate — a hike would widen that gap further and pressure the sector's valuation.
- July 2026 ADP private payrolls printed +44K versus +68K expected, reported August 5 via the Investing.com economic calendar — a labor-market miss that's historically the kind of data point that can trigger rotation into defensive sectors like staples, cutting against the bearish put trade.
Upcoming — Inside the September Leg's Window
- September 15–16, 2026 FOMC, with a fresh Summary of Economic Projections, per the Federal Reserve's FOMC calendar — the single highest-impact date inside the September $78 put's life, given the live hold-vs-hike debate.
- August 26, 2026 Personal Income & Outlays (July data), per the BEA release schedule — carries both core PCE inflation (a Fed input) and real consumer spending data that drives Walmart and Costco volumes, 19.36% of the fund (StockAnalysis).
- September 30, 2026 Personal Income & Outlays (August data), also per the BEA schedule, landing just before the September put's expiration.
Upcoming — Inside the December Leg's Window
- October 27–28, 2026 FOMC, six days before the midterms, per the Federal Reserve calendar.
- December 8–9, 2026 FOMC, the final meeting before the December $78 put expires, also with a fresh SEP/dot plot, per the Federal Reserve calendar.
- November 3, 2026 U.S. midterm elections — a genuine idiosyncratic risk for XLP specifically, since tariffs (a direct cost input for Walmart and Costco), minimum-wage policy (both are among the largest U.S. private employers), SNAP/food-assistance funding, and food/drug-labeling regulation are all live policy questions that hit this sector's largest holdings directly.
- October 29 and November 25, 2026 Personal Income & Outlays / GDP releases, per the BEA schedule.
⚠️ Confirmed earnings dates for Walmart, Costco, and Coca-Cola — combined 26.52% of the fund — could not be sourced for this window; do not select expiries or size positions around estimated dates without verifying on each company's investor relations page.
🎲 Price Targets & Probabilities
Using the gamma levels and implied move together:
- Bull case (staples catch a bid): a hold above the $86 resistance wall opens a path toward $87–$88, both flagged "Very Strong" — roughly in line with the monthly OPEX implied move's upper bound of $88.23. This is the scenario where the July labor miss actually triggers real rotation into defensives, and both put legs simply expire worthless.
- Base case: price continues to gravitate around the $85 support / $85.5–$86 resistance band, where gamma is currently most concentrated — a tight, low-drama range unless a specific catalyst (FOMC, PCE, an election shock) breaks it.
- Bear case (the put buyer's scenario): a break of the $84–$83 support shelf opens room toward the $80 level and then the $78 support wall itself — which, notably, already carries real put-side gamma (24.1 total, 24.0 put) even before today's trade. If XLP actually gets there, both put legs would be solidly in the money; $78 is 8.55% below current spot, a move that's outside the 44-day Triple Witch implied range but inside the roughly 135-day window to December expiration.
None of these targets should be read as a prediction — they're where the options market and dealer positioning currently say attention is concentrated.
💡 Four Ways to Read This Trade
🎰 The YOLO Trader
There's nothing here to copy directly — you'd be buying options that are already deep out of the money (8%+ away) with no edge over the desk that just rolled ≈$6.57M net of protection you can't replicate at size. And note what the resolution actually tells you: this was not a new signal firing, it was an existing position being maintained, so there was never a fresh entry to follow. If you have a strong tail-risk view on staples specifically, a small position in the December $78 puts, sized so a full loss doesn't hurt, is the honest way to express it.
📈 The Swing Trader
The real actionable read here is the gamma band: $85 support and $86 resistance are both "Very Strong" and sit almost exactly on top of spot. Until that breaks, XLP is likely to chop inside a tight range. A break of $84 with volume is the first real tell that the bear case (and this trade) might be onto something; a reclaim of $86–$87 argues the opposite.
🛡️ The Premium Collector
Selling premium against a sector sitting in a tight gamma band, with implied vol not obviously elevated, is a reasonable idea here — but be aware you'd be selling into the same zone where someone just paid real money for downside protection. A modest iron condor using the monthly OPEX range ($82.35–$88.23) as your outer boundary respects both the current gamma structure and the fact that informed money is actively hedging this exact sector right now.
🌱 The Beginner
The big lesson from this trade isn't the dollar figure — it's that "defensive sector" doesn't mean "no risk." XLP is a bond-proxy that gets hurt by rate hikes, not just stock-market selloffs, and it's more concentrated (62.18% in its top 10 holdings) than most people assume. If you're holding XLP or a staples name for safety, understand what you actually own: two large retailers and a beverage company, all exposed to specific 2026 catalysts (Fed policy, tariffs, minimum wage) that have nothing to do with a broad market crash.
⚠️ Risk Factors — What The Tape Cannot Prove
- Calendar vs. double-long is now settled — it was neither; it was a roll. The August 6 OI snapshot proved the September leg closed (−80,107) and the December leg opened (+85,032). Real net cost ≈$6.57M, not $10.1M.
- What OI still cannot prove: which side of the September leg this desk held. Contracts were extinguished, but a long being sold to close and a short being bought to close look identical in the open-interest series. Our roll-out reading is inferred from the geometry and the net debit, not established by the tape.
- A multi-leg auction has a facilitated match, but we don't know who's on the other side, or why. OPRA data cannot tell us the broker, the customer, the order ID, or whether there's an invisible stock, futures, or options position sitting behind this trade elsewhere.
- Deltas and dollar-delta figures for a multi-leg package are estimates, not exact — per-leg deltas on a combo print can be allocated differently by different pricing engines, and we have not independently reconciled the −644,829 share figure against the underlying per-leg deltas shown above.
- This could simply be a hedge, not a directional bet. If the buyer already owns a large staples position — shares, a basket, or other options — this could be pure insurance on an existing holding rather than a fresh bearish view on XLP itself. The tape cannot see anyone's other positions.
- XLP's own catalyst calendar has real gaps. Confirmed earnings dates for Walmart, Costco, and Coca-Cola (26.52% of the fund) were not available, and BLS release dates for CPI/PPI/jobs could not be independently confirmed in the sourced catalyst research.
- Options trading involves substantial risk of loss and is not suitable for all investors. Nothing in this article is a recommendation to buy or sell any specific option, and this analysis should not be the sole basis for any investment decision.
🎯 The Bottom Line
Real talk: someone with an existing ≈80,000-contract bet against consumer staples decided on August 5 that it needed three more months, and paid ≈$6.57M net to buy that time. They kept the strike at $78 — roughly 8% below spot — and kept the size. That is a maintained conviction, not a new one, and it is worth paying attention to for exactly that reason: this trader has now been carrying downside protection on the market's designated safe harbor for weeks and chose to keep carrying it, into a genuinely hawkish-leaning Fed that just had three members vote to hike rather than cut.
What we got right and what we got wrong. The day-of article refused to assert between a double-long and a calendar and published the exact number that would settle it. That was the right call — the headline "$10.1M new bearish bet" would have been wrong by roughly $3.5M and wrong in kind. What the tape could never tell us, and still can't, is whether this desk is hedging a large staples holding or expressing an outright bearish view.
What to watch now: the $85 support / $86 resistance gamma band is what's actually driving XLP's day-to-day price action. The surviving December leg still spans every major scheduled event from here — the September 15–16 FOMC, the October 27–28 FOMC, the midterms, and the December 8–9 FOMC right before it expires. What the trader gave up by retiring the September leg is the near-dated, fast-moving slice of that protection: the December put covers the same events, but it reacts far more slowly to a sudden drop than a nearly-expiring put would have.
Last updated: 2026-08-06 (pre-market) — next-day OPRA open interest resolved the calendar-vs-double-long question. The September $78 leg closed (85,629 → 5,522) and the December $78 leg opened (25,080 → 110,112), confirming a put roll-out at a true net cost of ≈$6.57M. Title, lead, trade section, plain-English section, trading ideas, risk factors and bottom line were all corrected.
This article is for informational purposes only and does not constitute investment advice. Options trading involves substantial risk of loss and is not suitable for all investors. Always do your own research and consult a licensed financial advisor before trading.