🎢 XYZ (Block, Inc.) — $12.07M Long Straddle Reaches 2.4 Years Out, One Day Before Earnings
📅 2026-08-04 | Trade time 11:36:45 ET | Net debit $12,066,000
🎯 The Quick Take
One day before Block reports earnings, someone paid $12.07 million to buy both a put and a call at the same $115 strike, expiring December 15, 2028 — a straddle that is effectively delta-neutral (get the full XYZ options chain). This is not a bullish or bearish bet. It is a bet that Block moves a long way — in either direction — sometime over the next two and a half years, and that volatility itself is worth owning here. Tomorrow's number is only a small part of what this position is actually buying.
🏢 Who Is XYZ? (Yes, This Is Block, Not "Company XYZ")
Ticker note up front: XYZ is Block, Inc. — the company most people still know as Square, or by its old ticker SQ. Block renamed itself and its ticker in December 2021. If you searched for "XYZ" expecting some obscure small-cap, this is it: a ≈$50.6 billion payments and fintech company on the NYSE.
Block runs two big consumer- and merchant-facing businesses. Square is the merchant side — point-of-sale hardware, seller software, and seller lending. Cash App is the consumer side — peer-to-peer payments, a debit card, brokerage, and bitcoin. Attached to those are Afterpay (buy-now-pay-later), TIDAL (music streaming), TBD, and Bitkey (a bitcoin hardware wallet). The company is run by co-founder Jack Dorsey and employs about 10,205 people.
💰 The Option Flow Breakdown
📊 What Just Happened
At 11:36:45 ET, with XYZ trading at $84.17, both legs of this trade printed in the same package, at the same strike, the same expiration, the same millisecond:
| Time | Buy/Sell | Call/Put | Expiration | Strike | Size | Volume | Prior OI | Option Price | Premium | Spot | Option Symbol |
|---|---|---|---|---|---|---|---|---|---|---|---|
| 11:36:45 ET | BUY | PUT | 2028-12-15 | $115 | 2,000 | 2,000 | 1,700 | $41.18 | $8,236,000 | $84.17 | XYZ20281215P115 |
| 11:36:45 ET | BUY | CALL | 2028-12-15 | $115 | 2,000 | 2,000 | 1,711 | $19.15 | $3,830,000 | $84.17 | XYZ20281215C115 |
Net debit: $12,066,000. Both legs were bought — this is a long straddle, not a spread and not a credit trade.
Flow-type tag: 🧾 MULTI-LEG FLOOR TRADE. Both legs were negotiated on the exchange floor as a single package, not swept off the lit order book. This was a worked, facilitated trade with a counterparty on the other side — not aggressive one-sided buying into a thin book. Treat the size as real, but don't read floor-negotiated urgency into it the way you would a lit sweep.
Full trade legs at get the put chart and get the call chart.
✅ RESOLVED — Both Legs Confirmed Open, Exactly as Predicted
Updated 2026-08-05 pre-market. The ≈06:30 ET OPRA snapshot (reflecting the August 4 close) has published.
| Leg | Baseline OI (Aug-4 snap) | Resolving OI (Aug-5 snap) | Δ | Print size | Δ as % of print | Verdict |
|---|---|---|---|---|---|---|
| Dec-15-2028 $115 P (bought) | 1,700 | 3,700 | +2,000 | 2,000 | ≈100.0% | ✅ OPEN (BTO) |
| Dec-15-2028 $115 C (bought) | 1,711 | 3,715 | +2,004 | 2,000 | ≈100.2% | ✅ OPEN (BTO) |
We predicted roughly 3,700 on both legs. The put came in at exactly 3,700 and the call at 3,715 — a perfect one-for-one open on both sides. None of this size was existing contracts changing hands. The long straddle is confirmed as a brand-new position.
🤓 What This Actually Means — Plain English
Both legs are Buy-To-Open (BTO). Nobody sold anything here — the buyer paid cash for a long put and a long call, both at the $115 strike, both expiring December 2028.
What's a straddle? It's buying a call and a put at the same strike and expiration. A call profits if the stock goes up a lot; a put profits if the stock goes down a lot. Own both, and you don't care which direction wins — you're betting the stock moves, not which way it moves.
Why "delta-neutral" matters. Delta measures how much an option's value changes as the stock moves. The put here carries a delta of about −0.4583 (2,000 contracts × 100 shares × −0.4583 = −91,660 shares of downside exposure). The call carries a delta of about +0.5292 (2,000 × 100 × 0.5292 = +105,840 shares of upside exposure). Add them together and the position nets out to just +14,180 shares of directional exposure on a $50.6 billion company — essentially nothing. Do not read this as a bullish or a bearish bet. The buyer is not saying "up" or "down." They're saying "big move, don't care which way."
This is "long volatility." Rather than betting on direction, this position profits when the stock's realized (or expected/implied) volatility rises — the wider the eventual swing, or the more expensive options get to buy, the more this position is worth, sometimes well before December 2028 actually arrives.
Why the put is already worth so much more than the call. The $115 strike sits $30.83 above today's $84.17 spot. That makes the put already $30.83 in the money — its $41.18 price is mostly real, intrinsic value plus about $10.35 of time value. The call, sitting far out of the money, is $19.15 of pure time value and probability. Combined, the straddle cost $60.33 against a $115 strike.
📈 Technical Setup / Chart Check-Up
YTD chart
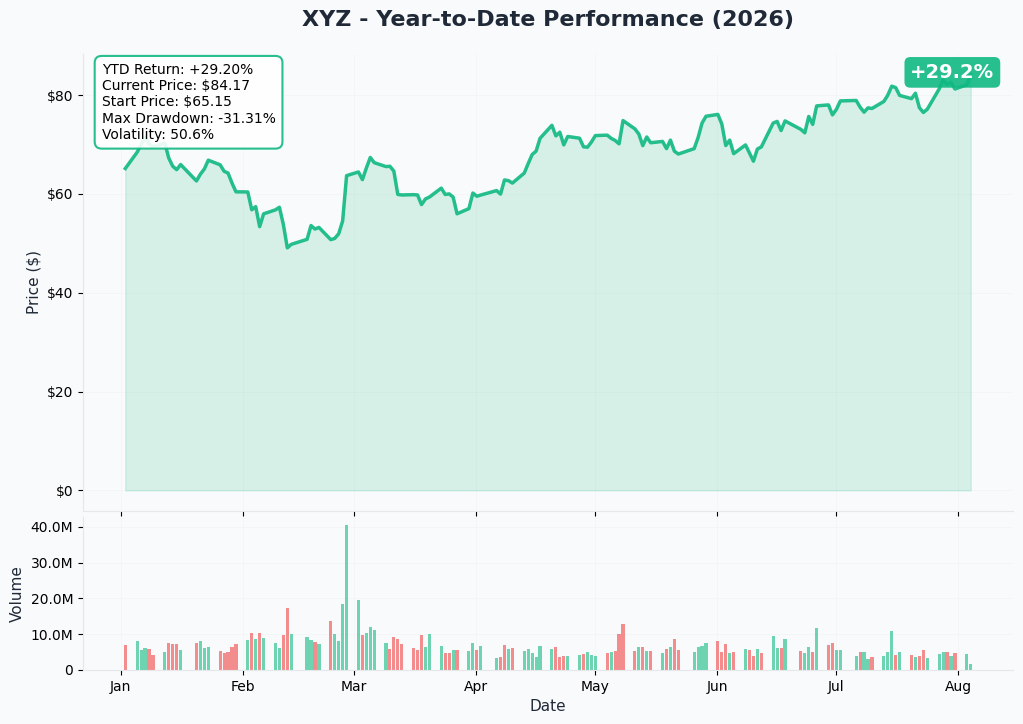
XYZ is +29.2% over the past year, a run that has carried it from the mid-$60s to a stretched, momentum-extended position at its 52-week high heading into tomorrow's print.
Gamma-based support & resistance
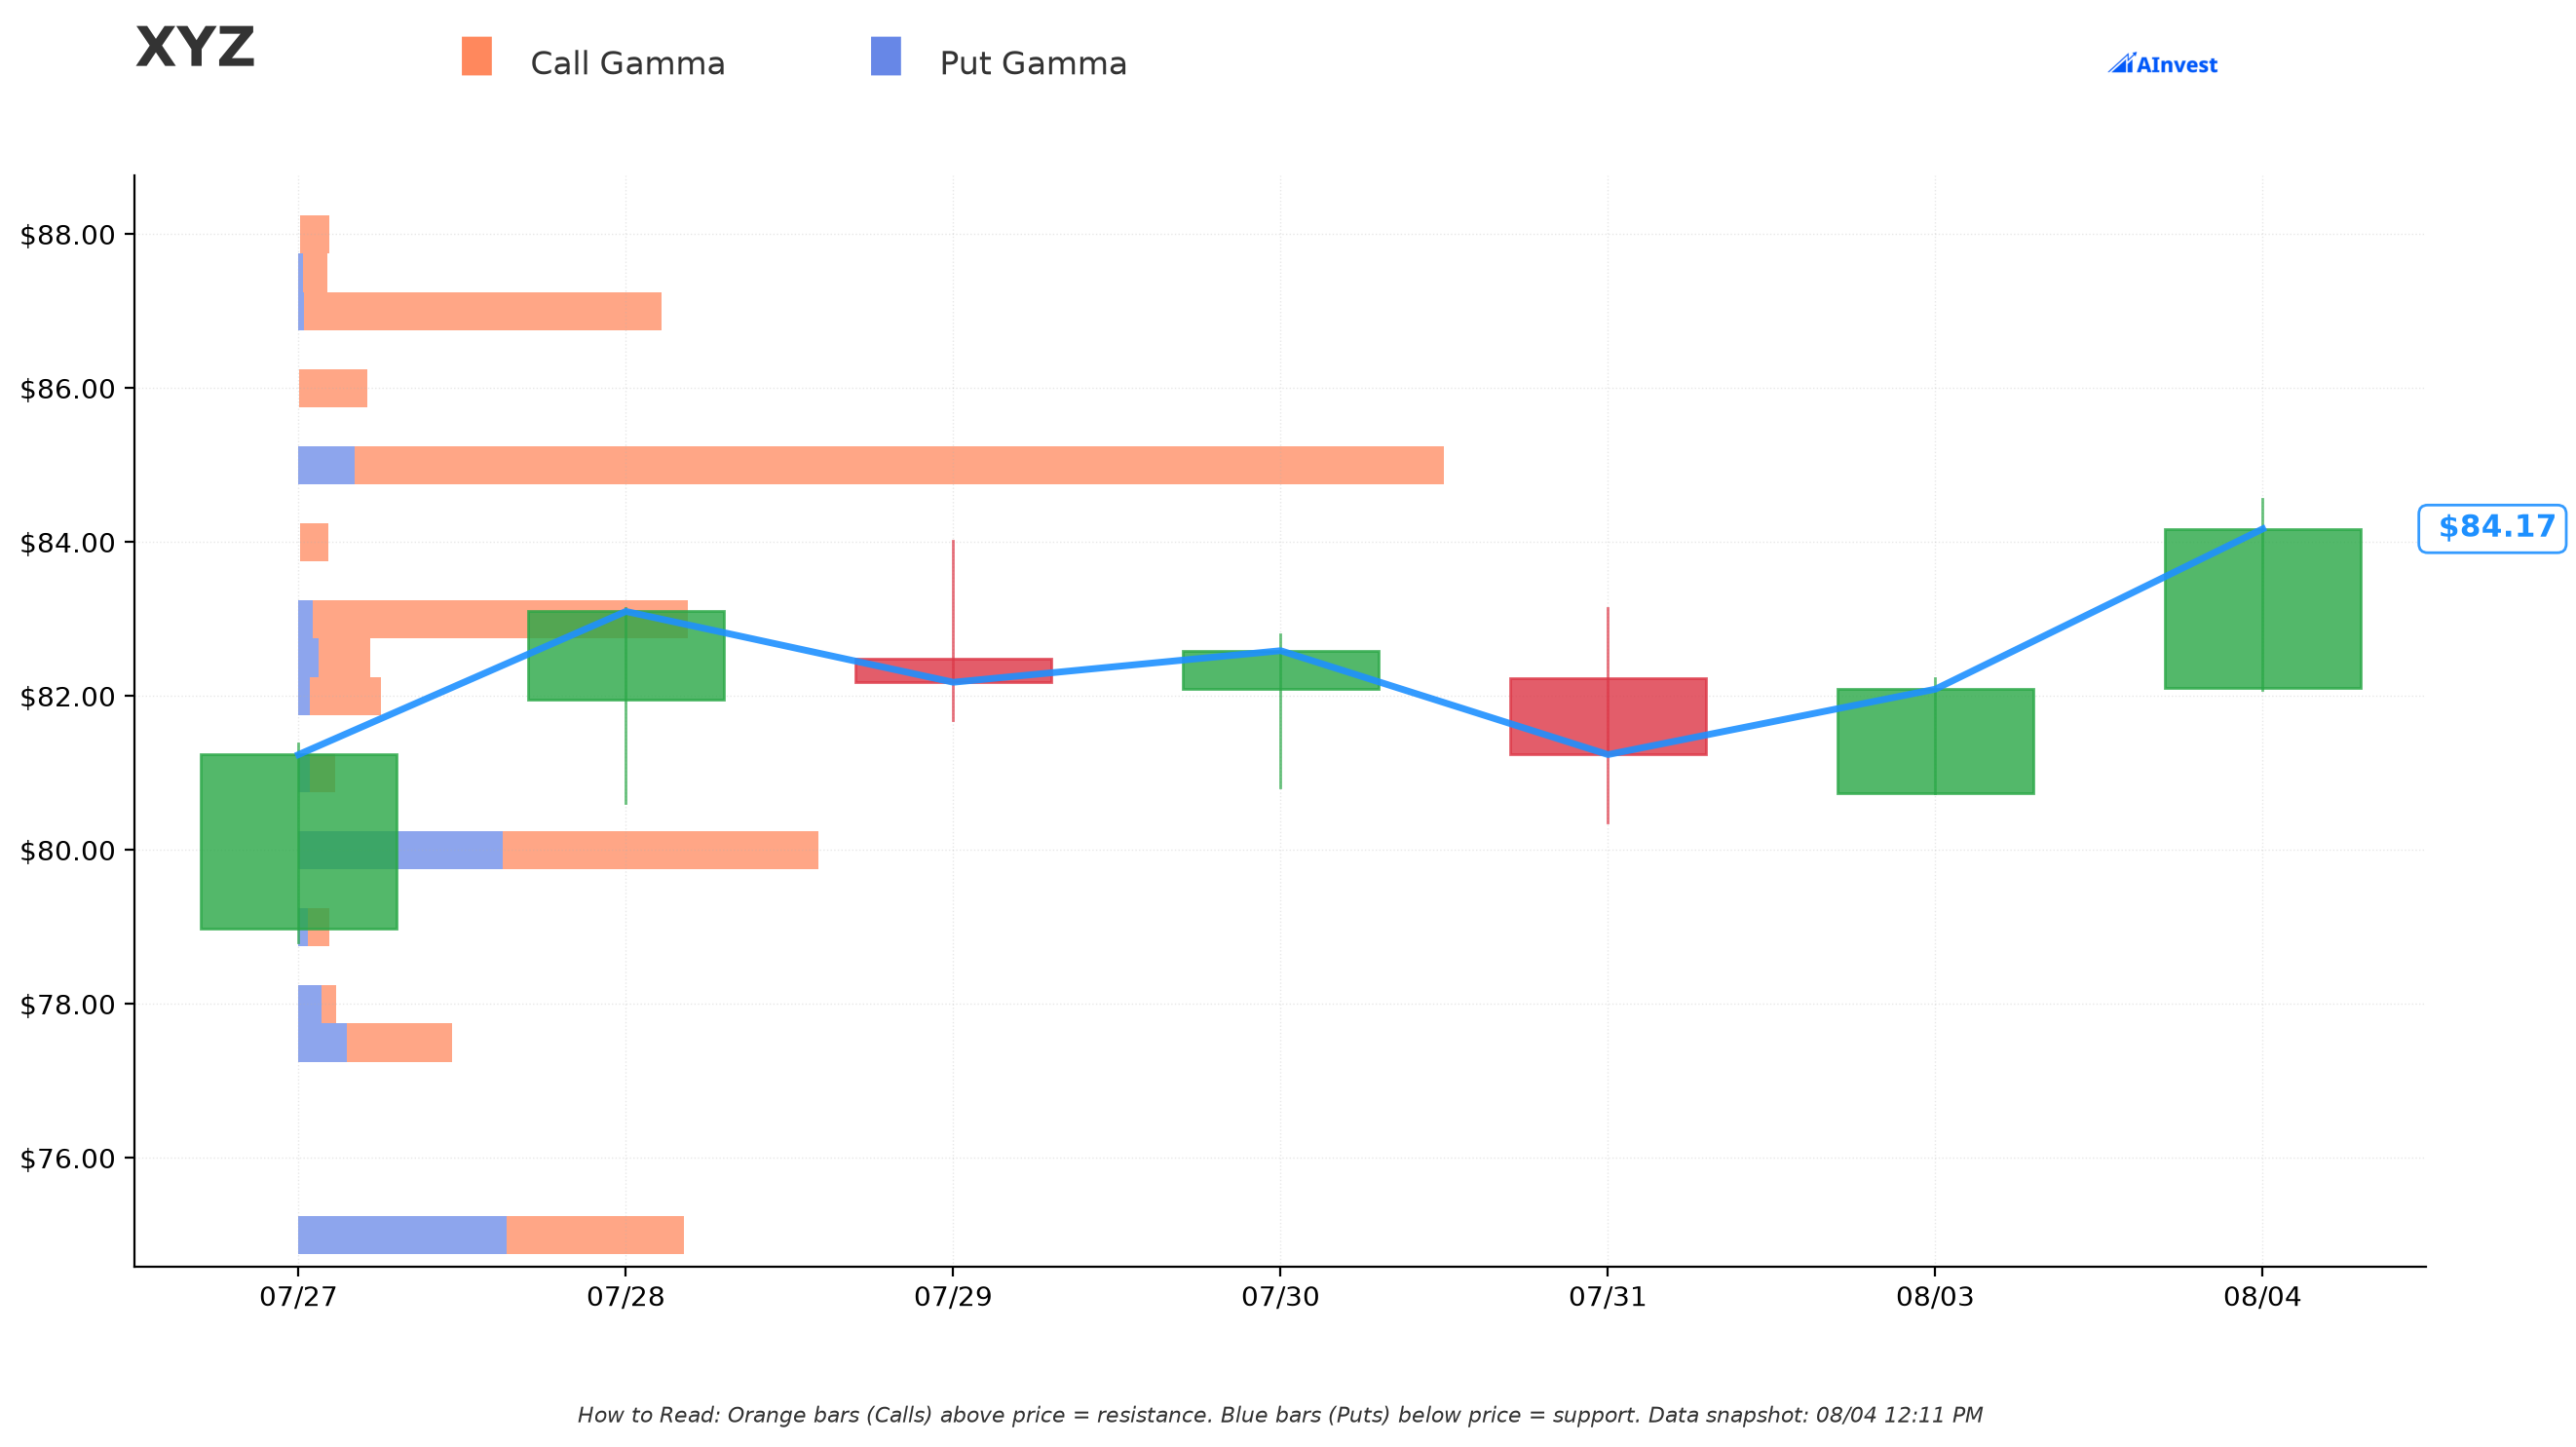
Reading the actual gamma exposure at the moment this chart was pulled (spot ≈$84.26):
- $85 strike — Strong resistance wall, only 0.88% above spot. This is heavily call-dominated (call gamma 5.84 vs put gamma 0.30), meaning dealer hedging flows are concentrated right above today's price. This is the level most likely to act as a near-term ceiling or magnet.
- $90 strike — Moderate resistance, 6.8% above spot (net gamma 2.39).
- $95 strike — a bigger resistance wall in raw size (net gamma 7.92) but sits 12.75% away, so it matters more as a medium-term target than a near-term wall.
- No computed support level below spot today. The model found no meaningful put-gamma concentration under $84 — this is a real gap in the visible dealer-hedging picture, not a claim that "there's no support." Treat the downside as comparatively less mapped by this data than the upside.
- Worth noting for this specific trade: the $115 strike itself carries very little current gamma (total gamma 0.78, call+put combined, 36.5% away from spot). The straddle's strike is sitting well outside where dealer hedging flows are concentrated today — consistent with a genuinely long-dated, wide-strike position rather than a bet on pinning near-term price action.
Implied move
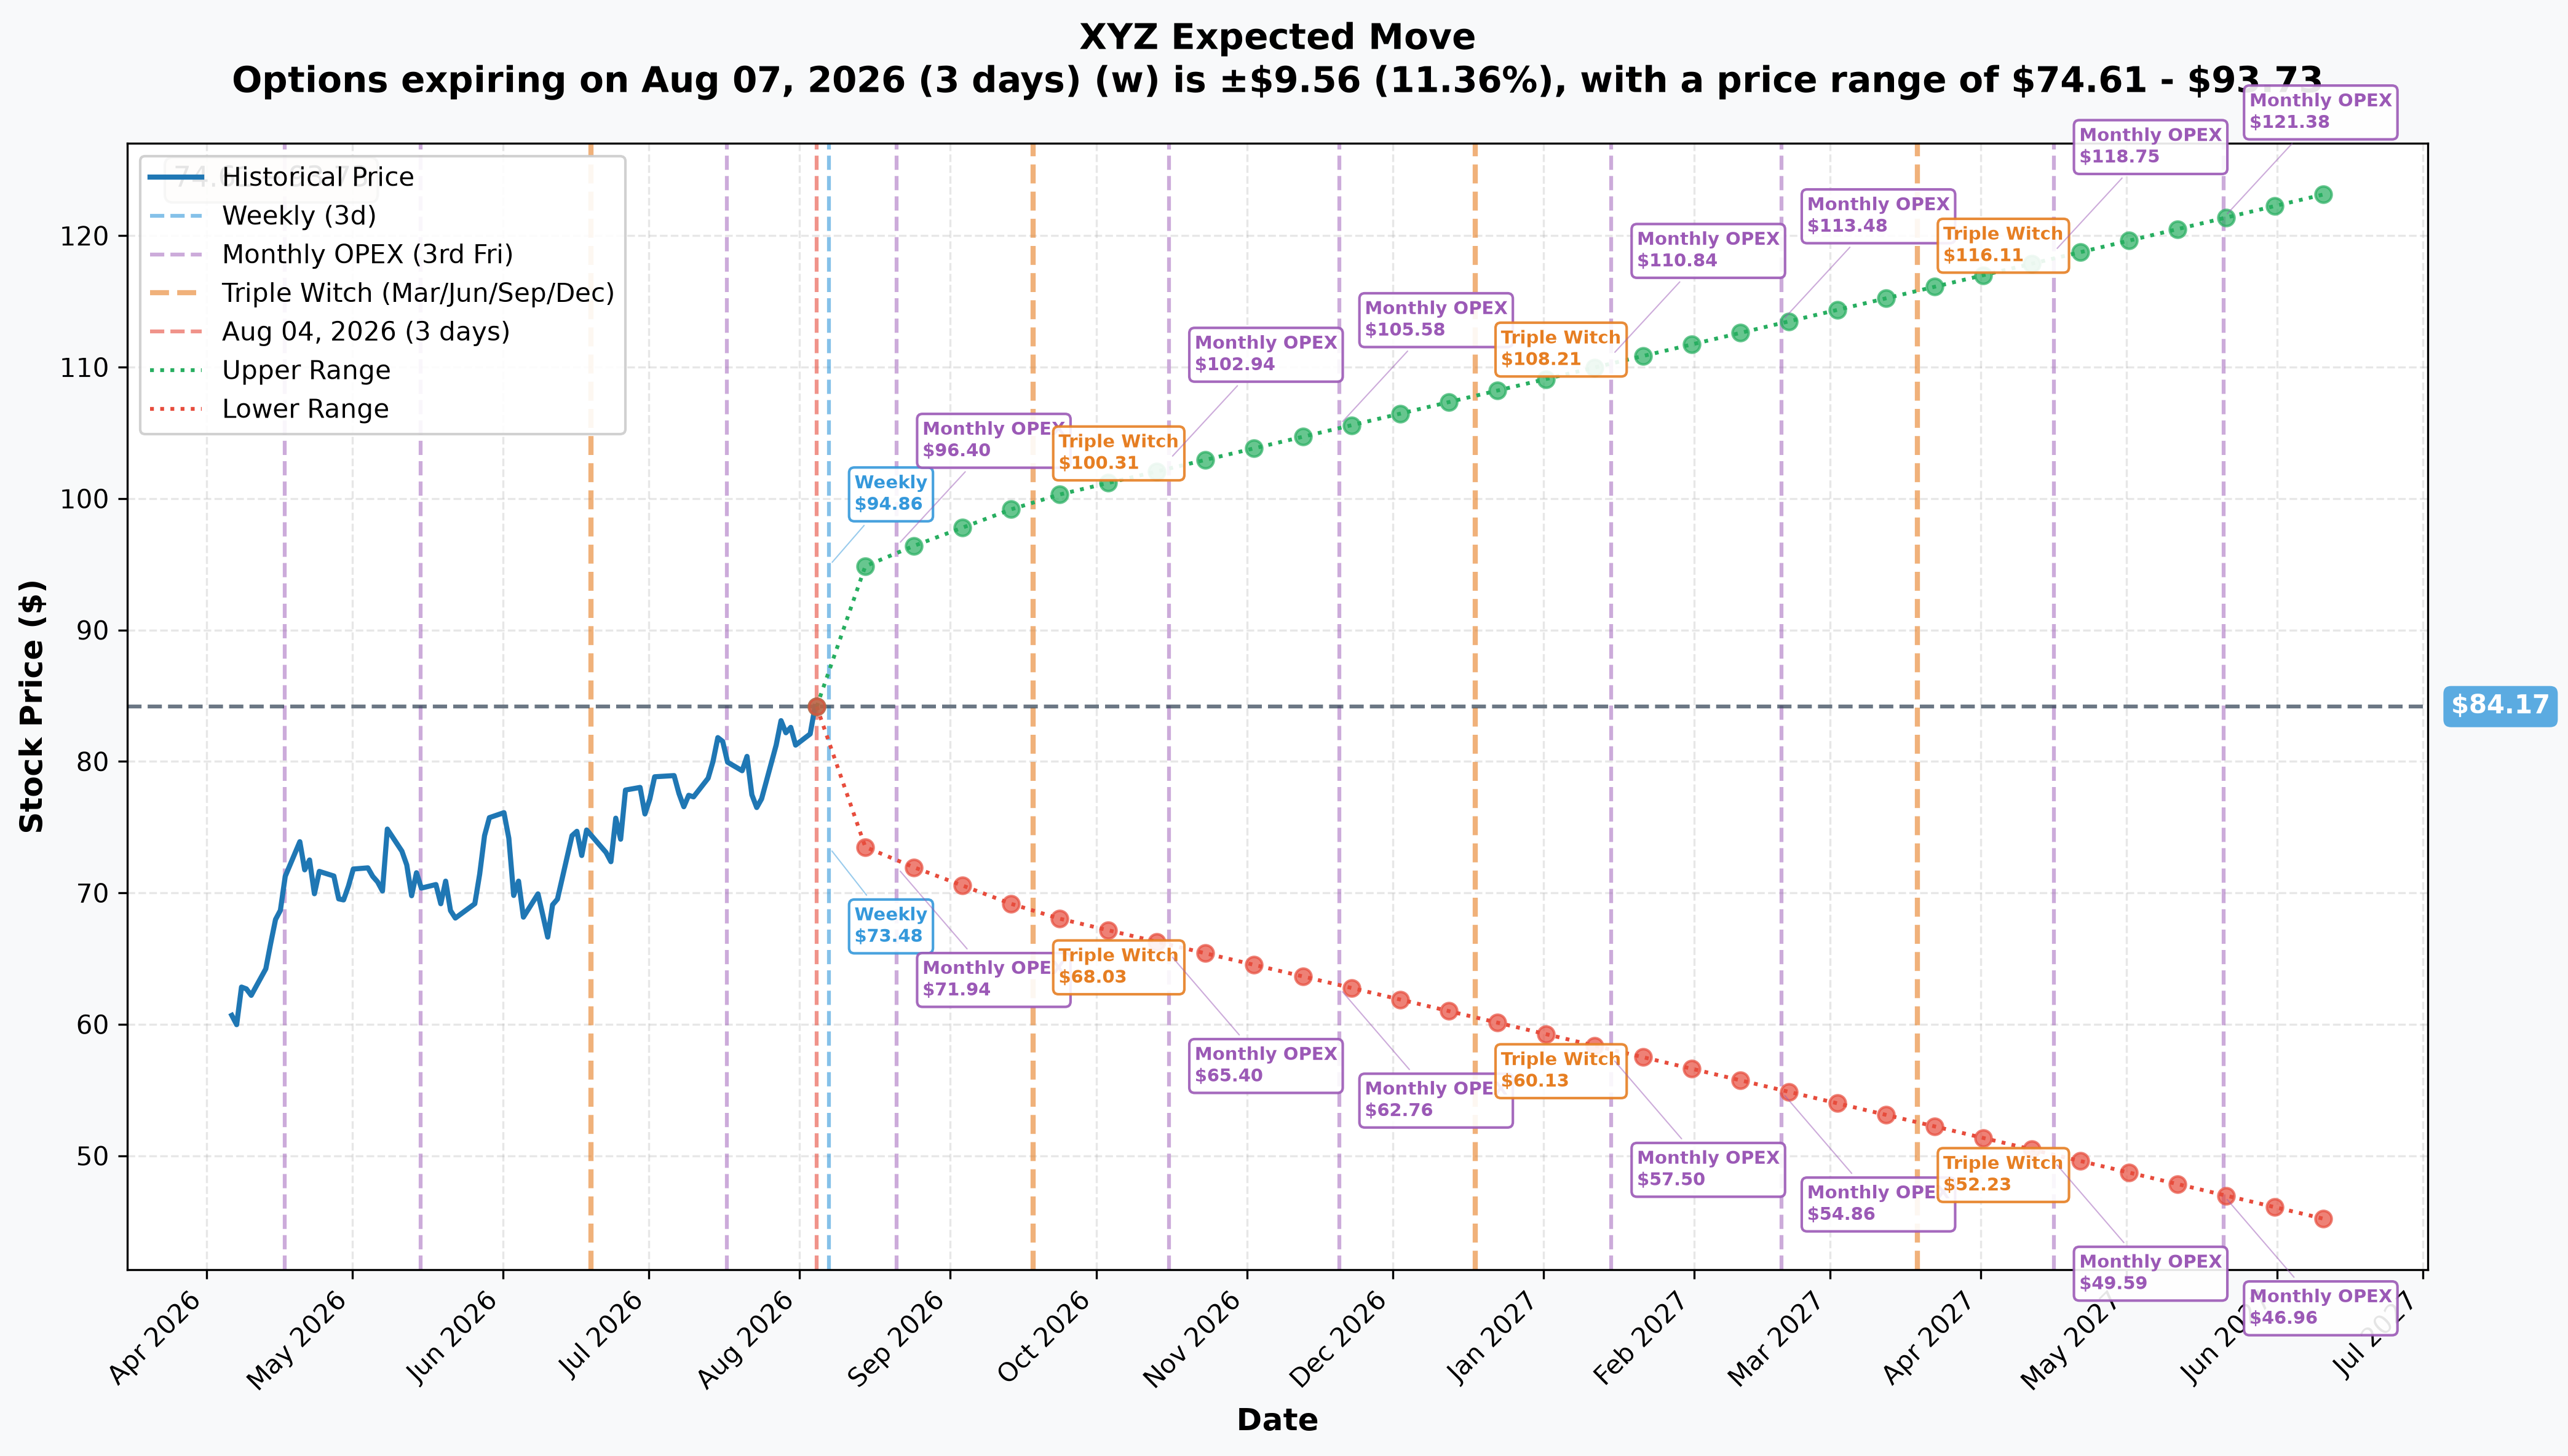
This is where tomorrow's earnings print actually shows up in the options market, and it's a useful contrast to the straddle above:
| Window | Expiry | Days out | Implied move | Range |
|---|---|---|---|---|
| Weekly (covers Aug 5 earnings) | 2026-08-07 | 3 | ≈11.4% (≈$9.56) | $74.61 – $93.73 |
| Monthly OPEX | 2026-08-21 | 17 | ≈14.0% (≈$11.81) | $72.36 – $95.98 |
| Quarterly triple witch | 2026-09-18 | 45 | ≈18.7% (≈$15.70) | $68.47 – $99.87 |
| LEAPS | 2027-06-17 | 317 | ≈47.0% (≈$39.58) | $44.59 – $123.75 |
The market is pricing roughly an 11.4% move by Friday around tomorrow's earnings — nowhere close to the straddle's own breakevens. Even stretching out to the longest visible chain, 317 days to June 2027, the implied range only reaches $44.59 to $123.75. The straddle bought today needs the stock at $54.67 or below, or $175.33 or above, just to break even at expiration in December 2028 — a full 18 months past where visible options pricing even extends. That gap is the clearest evidence this trade is not really about tomorrow's number; it's a bet on a much longer, wider arc than the market is currently pricing anywhere on the visible chain.
🎪 Catalysts
🔴 Imminent — tomorrow
Block reports Q2 2026 results Wednesday, August 5, 2026, after the close, with the earnings call at 5:00 p.m. ET — this is company-confirmed, announced in Block's own July 2 press release. It is genuinely T+1 from this trade.
Consensus is $0.55 adjusted EPS (MarketBeat earnings), against a streak of five consecutive adjusted-EPS beats, four of them by $0.29 or more — including a $0.55 blowout beat last quarter ($0.85 actual vs $0.30 consensus). The one miss in this window, Q4 2024, is the template for what a disappointment looks like.
A distinction worth being precise about: adjusted vs GAAP. That $0.85 "beat" for Q1 2026 was an adjusted number. On a GAAP basis, the same quarter was a loss — net income −$308.68M, EPS −$0.52 (stockanalysis quarterly financials). Whatever headline hits tomorrow, expect the same two-track read: a likely adjusted beat, alongside a GAAP line that could easily stay negative.
But the expiry on this straddle is December 2028 — roughly ten more earnings reports past tomorrow's. Tomorrow's binary event is a small piece of the window this position is actually paying for.
🟡 The underlying business, last three months
Underneath the noise, gross profit is genuinely compounding. Gross profit grew ≈26.8% year over year in Q1 2026 ($2,922M vs $2,304M a year earlier), while revenue was nearly flat, and gross margin has expanded from 39.9% to 48.2% across four quarters (stockanalysis quarterly financials). Block also raised guidance at the last print, citing higher payment volumes and increased lending activity, per the Wall Street Journal (carried via MarketBeat's newsfeed).
Block also holds 9,032 BTC, valued at ≈$578M (bitcointreasuries.net). It is plausible, though not confirmed by the company, that bitcoin-related activity is part of what's driving the revenue-flat/gross-profit-up divergence — treat that link as an inference, not a stated fact.
🟢 Setup going into the print
XYZ enters earnings sitting ≈0.3% below its 52-week high ($84.29 close vs a $84.50–84.56 high), with a beta of 2.53 and only ≈3% of float short — meaning there is very little short-covering fuel to cushion a bad print. Analyst sentiment has been broadly supportive: average targets cluster $89–93, the full range runs $55 to $115, and zero analysts carry a Sell rating. Six of the last seven analyst actions in the past two weeks were positive — five price-target raises plus a Buy reiteration — with the lone exception a Zacks downgrade to Hold on July 30 (MarketBeat price targets).
Put together — a high-beta stock sitting at its highs, a confirmed binary event one day out, and almost no short base to absorb a miss — that combination is a coherent reason for someone to want to own volatility here rather than pick a direction. That's a read on why a straddle makes sense in this setup, not proof of what the buyer was actually thinking.
🧑🤝🧑 Four Ways to Read This
🎰 YOLO Trader
You are not going to replicate a $12M institutional straddle, and you don't need to. If you want to express the same "big move, don't care which way" idea on a much smaller scale, a small straddle or strangle around the $115 area with a much nearer expiration (weeks, not years) captures the same logic without tying up capital for 2.4 years. Understand going in: a 2.4-year straddle is capital-intensive and slow — it is not built for a fast flip on tomorrow's number.
📈 Swing Trader
This particular trade isn't really built for you — a December 2028 straddle is not a swing vehicle. What is relevant to your timeframe is the weekly implied move of ≈11.4% into Friday, which is the market's actual pricing of tomorrow's earnings reaction. If you're trading the earnings event itself, that's the number to anchor to, not this trade's far-dated breakevens.
💰 Premium Collector
Worth being direct here: this trade is the other side of what you usually do. You typically sell premium and collect time decay; this buyer paid $12.07 million specifically to own time decay and volatility exposure for 2.4 years. If you're inclined to fade this kind of position by selling premium into elevated implied volatility around tomorrow's print, that's a legitimate short-dated idea — but recognize it's a different trade on a different clock than the one described here.
🌱 Beginner
Use this as a clean, real example of what a straddle is and why "long volatility" is a distinct idea from "bullish" or "bearish." The lesson: buying options isn't always a directional bet. Sometimes big money is paying for the possibility of a large move without committing to which direction it goes. Before trading anything like this yourself, understand that both legs lose value every day the stock sits still — that's the cost of not having to guess direction.
⚠️ Risk Factors — Read This Before You Copy the Trade
- Time decay works against both legs. Of the $60.33 combined cost, only $30.83 is real intrinsic value (from the in-the-money put); the remaining ≈$29.50 per straddle — about $5.9 million total across this 2,000-lot position — is time and volatility value that erodes every day the stock does nothing. Long volatility bleeds in quiet markets.
- The breakevens are genuinely wide. At expiration in December 2028, the stock needs to be below $54.67 (about −35% from today) or above $175.33 (about +108% from today) for this position to show a profit purely from intrinsic value. That's a real hurdle if held to expiration.
- It can still work before expiration without hitting those levels — a straddle gains value from a rise in implied volatility even without the stock moving that far, which is exactly what "long vega" means in practice. But that's a harder, less certain path than "the stock hit my breakeven."
- What the tape cannot tell us: we don't know who bought this, why, or whether it's hedging some other exposure we can't see (stock, other options, or something entirely off-exchange). We don't know if this implied volatility level is rich or cheap relative to Block's own volatility history — that requires a deeper look at the vol surface than the tape alone provides. And "proven open" tells us new contracts were created; it does not tell us anything about the buyer's conviction, time horizon for holding, or exit plan.
- Do not read this as a prediction of tomorrow's earnings reaction. The delta is roughly flat. If you're looking for a directional read on Block's Q2 print, this trade does not provide one.
🎯 The Bottom Line
Real talk: somebody paid $12.07 million for the right to be paid if Block makes a very big move, in either direction, sometime in the next 2.4 years. It's not a bet that earnings beats tomorrow. It's not a bet that earnings misses tomorrow. It's a bet that this is a genuinely volatile stock — 2.53 beta, +29.2% over the past year, a confirmed binary event one day away — and that owning the ability to be surprised, for years, is worth more than the roughly $5.9 million of time value baked into the price. Whether that turns out to be right depends on things nobody, including the tape, can tell us yet.
This analysis is for informational purposes only and is not investment advice. Options trading involves substantial risk of loss and is not suitable for all investors. Past performance and options flow do not guarantee future results. Always do your own research and consider your own risk tolerance before trading.
Last updated: 2026-08-05 — next-day OPRA open-interest resolution added: both straddle legs confirmed OPEN (BTO), one-for-one.