🐉 BABA Smart Money Loaded Up $2.2M on Bullish Calls - Is Alibaba's AI Comeback Trade On? 🚀
📅 March 23, 2026 | 🔥 Unusual Activity Detected
🎯 The Quick Take
Someone just quietly dropped $2.2 MILLION on BABA $145 calls expiring May 15th - a flat-out aggressive bullish bet on Alibaba making a 15% move higher in under two months. This isn't a hedge, this is a conviction play: a new Buy to Open (BTO) standalone position with 9,548 contracts trading at a Vol/OI ratio of 1.508x when OI was only 6,500 - meaning whoever did this essentially created the market here. With BABA sitting at $126.47 and the stock already down 20%+ from its December highs after a rocky Q3 earnings report four days ago, smart money is betting this selloff is overdone and the rebound is coming.
📊 Company Overview
Alibaba Group Holding Limited (BABA) is the world's largest online and mobile commerce company as measured by gross merchandise volume, operating China's dominant online marketplaces including Taobao (consumer-to-consumer) and Tmall (business-to-consumer):
- Market Cap: $292.2 Billion
- Industry: E-Commerce & Cloud Computing (China)
- Current Price: $126.47 (down ~20% from December 2025 highs near $155)
- Primary Business: Chinese e-commerce (Taobao, Tmall, Lazada), Alibaba Cloud / AI, international commerce, logistics (Cainiao), digital media
- Balance Sheet Strength: $80.1 billion in cash and liquid investments
- Buyback Program: $19.1 billion remaining authorization through March 2027
💰 The Option Flow Breakdown
The Tape (March 23, 2026 @ 14:36:40):
| Time | Symbol | Side | Buy/Sell | Type | Strike | Volume | OI | Expiration | Size | Premium | Spot | Option Price | Option Symbol |
|---|---|---|---|---|---|---|---|---|---|---|---|---|---|
| 14:36:40 | BABA | MID | BUY | CALL | $145 | 9,800 | 6,500 | 2026-05-15 | 9,548 | $2.2M | $126.47 | $2.28 | BABA20260515C145 |
🤓 What This Actually Means
This is a fresh bullish position - someone is making a high-conviction directional bet that BABA rallies hard into May OPEX. Here is what stands out:
- 💸 $2.2M in premium paid: At $2.28 per contract x 9,548 contracts - this is real money with real conviction
- 🎯 Strike is 15% out-of-the-money: The $145 calls need BABA to rally from $126.47 to above $145 by May 15th to hit max profit territory. That is an aggressive target
- 📊 Vol/OI ratio of 1.508x HIGH ACTIVITY: The 9,800 volume traded against only 6,500 open interest means this buyer established the bulk of the open interest in this strike/expiry in a single trade
- ⏰ 53 days to expiration: Capturing Q4 FY2026 earnings expected around May 14th - one day before expiry. This trade almost certainly has an earnings catalyst thesis baked in
- 🔥 Z-Score of 15.9 - EXTREMELY UNUSUAL: This is deep into statistically rare territory for BABA options activity. Trades this large in size relative to historical norms happen only a handful of times per year for this name
- 🐋 BTO / STANDALONE: This is a new standalone position - not a roll, not a close, not a hedge, not part of a spread. Pure directional bet
What is really happening here:
The timing is telling. BABA just reported mixed Q3 FY2026 earnings on March 19th that disappointed on the bottom line (net income down 66%), sending shares down further. Four days later, someone is loading up $2.2M on out-of-the-money calls expiring right around Q4 earnings. This looks like a trader who believes the post-earnings flush is the buying opportunity, and that Q4 results in May will tell a better story - particularly around Alibaba's Cloud Intelligence Group which grew 36% last quarter and is targeting $100B in annual AI revenue within five years.
Unusual Score: 🔥 EXTREMELY UNUSUAL (Z-Score: 15.9) - This happens only a few times per year for BABA. The size relative to the existing open interest is especially noteworthy - this single trade roughly doubled the open interest at this strike in one shot.
📈 Technical Setup / Chart Check-Up
YTD Performance Chart
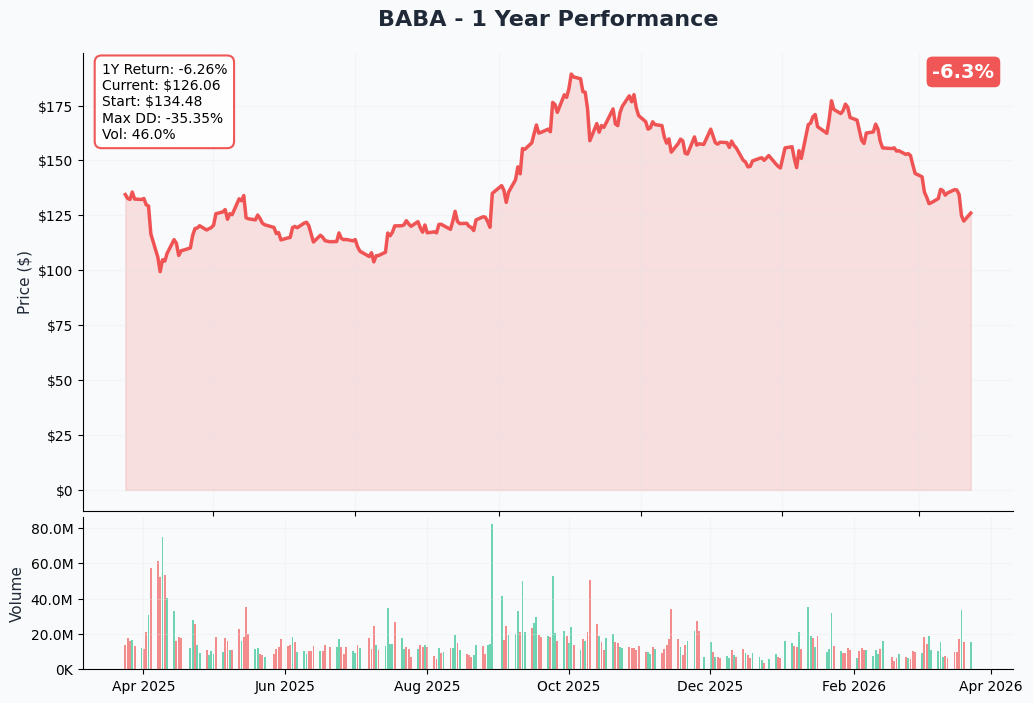
Alibaba has been on a rough ride in 2026. After a powerful run from the ~$80 52-week lows all the way to nearly $185 highs, the stock reversed hard. The current price of $126.47 represents a ~32% drawdown from peak, with the most recent leg down triggered by the mixed Q3 FY2026 earnings on March 19th where net income cratered 66% despite 36% cloud growth.
Key observations:
- 📉 Post-earnings flush: Shares dropped ~5% in premarket after Q3 results, extending the multi-week downtrend
- 🧲 $125 gamma magnet: Current price sitting right on top of a major gamma support level (more on this below)
- 📊 52-week range context: $80 low to $185 high - the stock has enormous range. Current $126 sits roughly in the lower third of that range
- 🎯 Analyst consensus: 37 Buy ratings, 4 Hold, 1 Sell with a consensus target near $198 - implying 56% upside from current levels
- 💰 Balance sheet floor: $80.1B in cash provides a hard fundamental floor under the valuation
Gamma-Based Support & Resistance Analysis
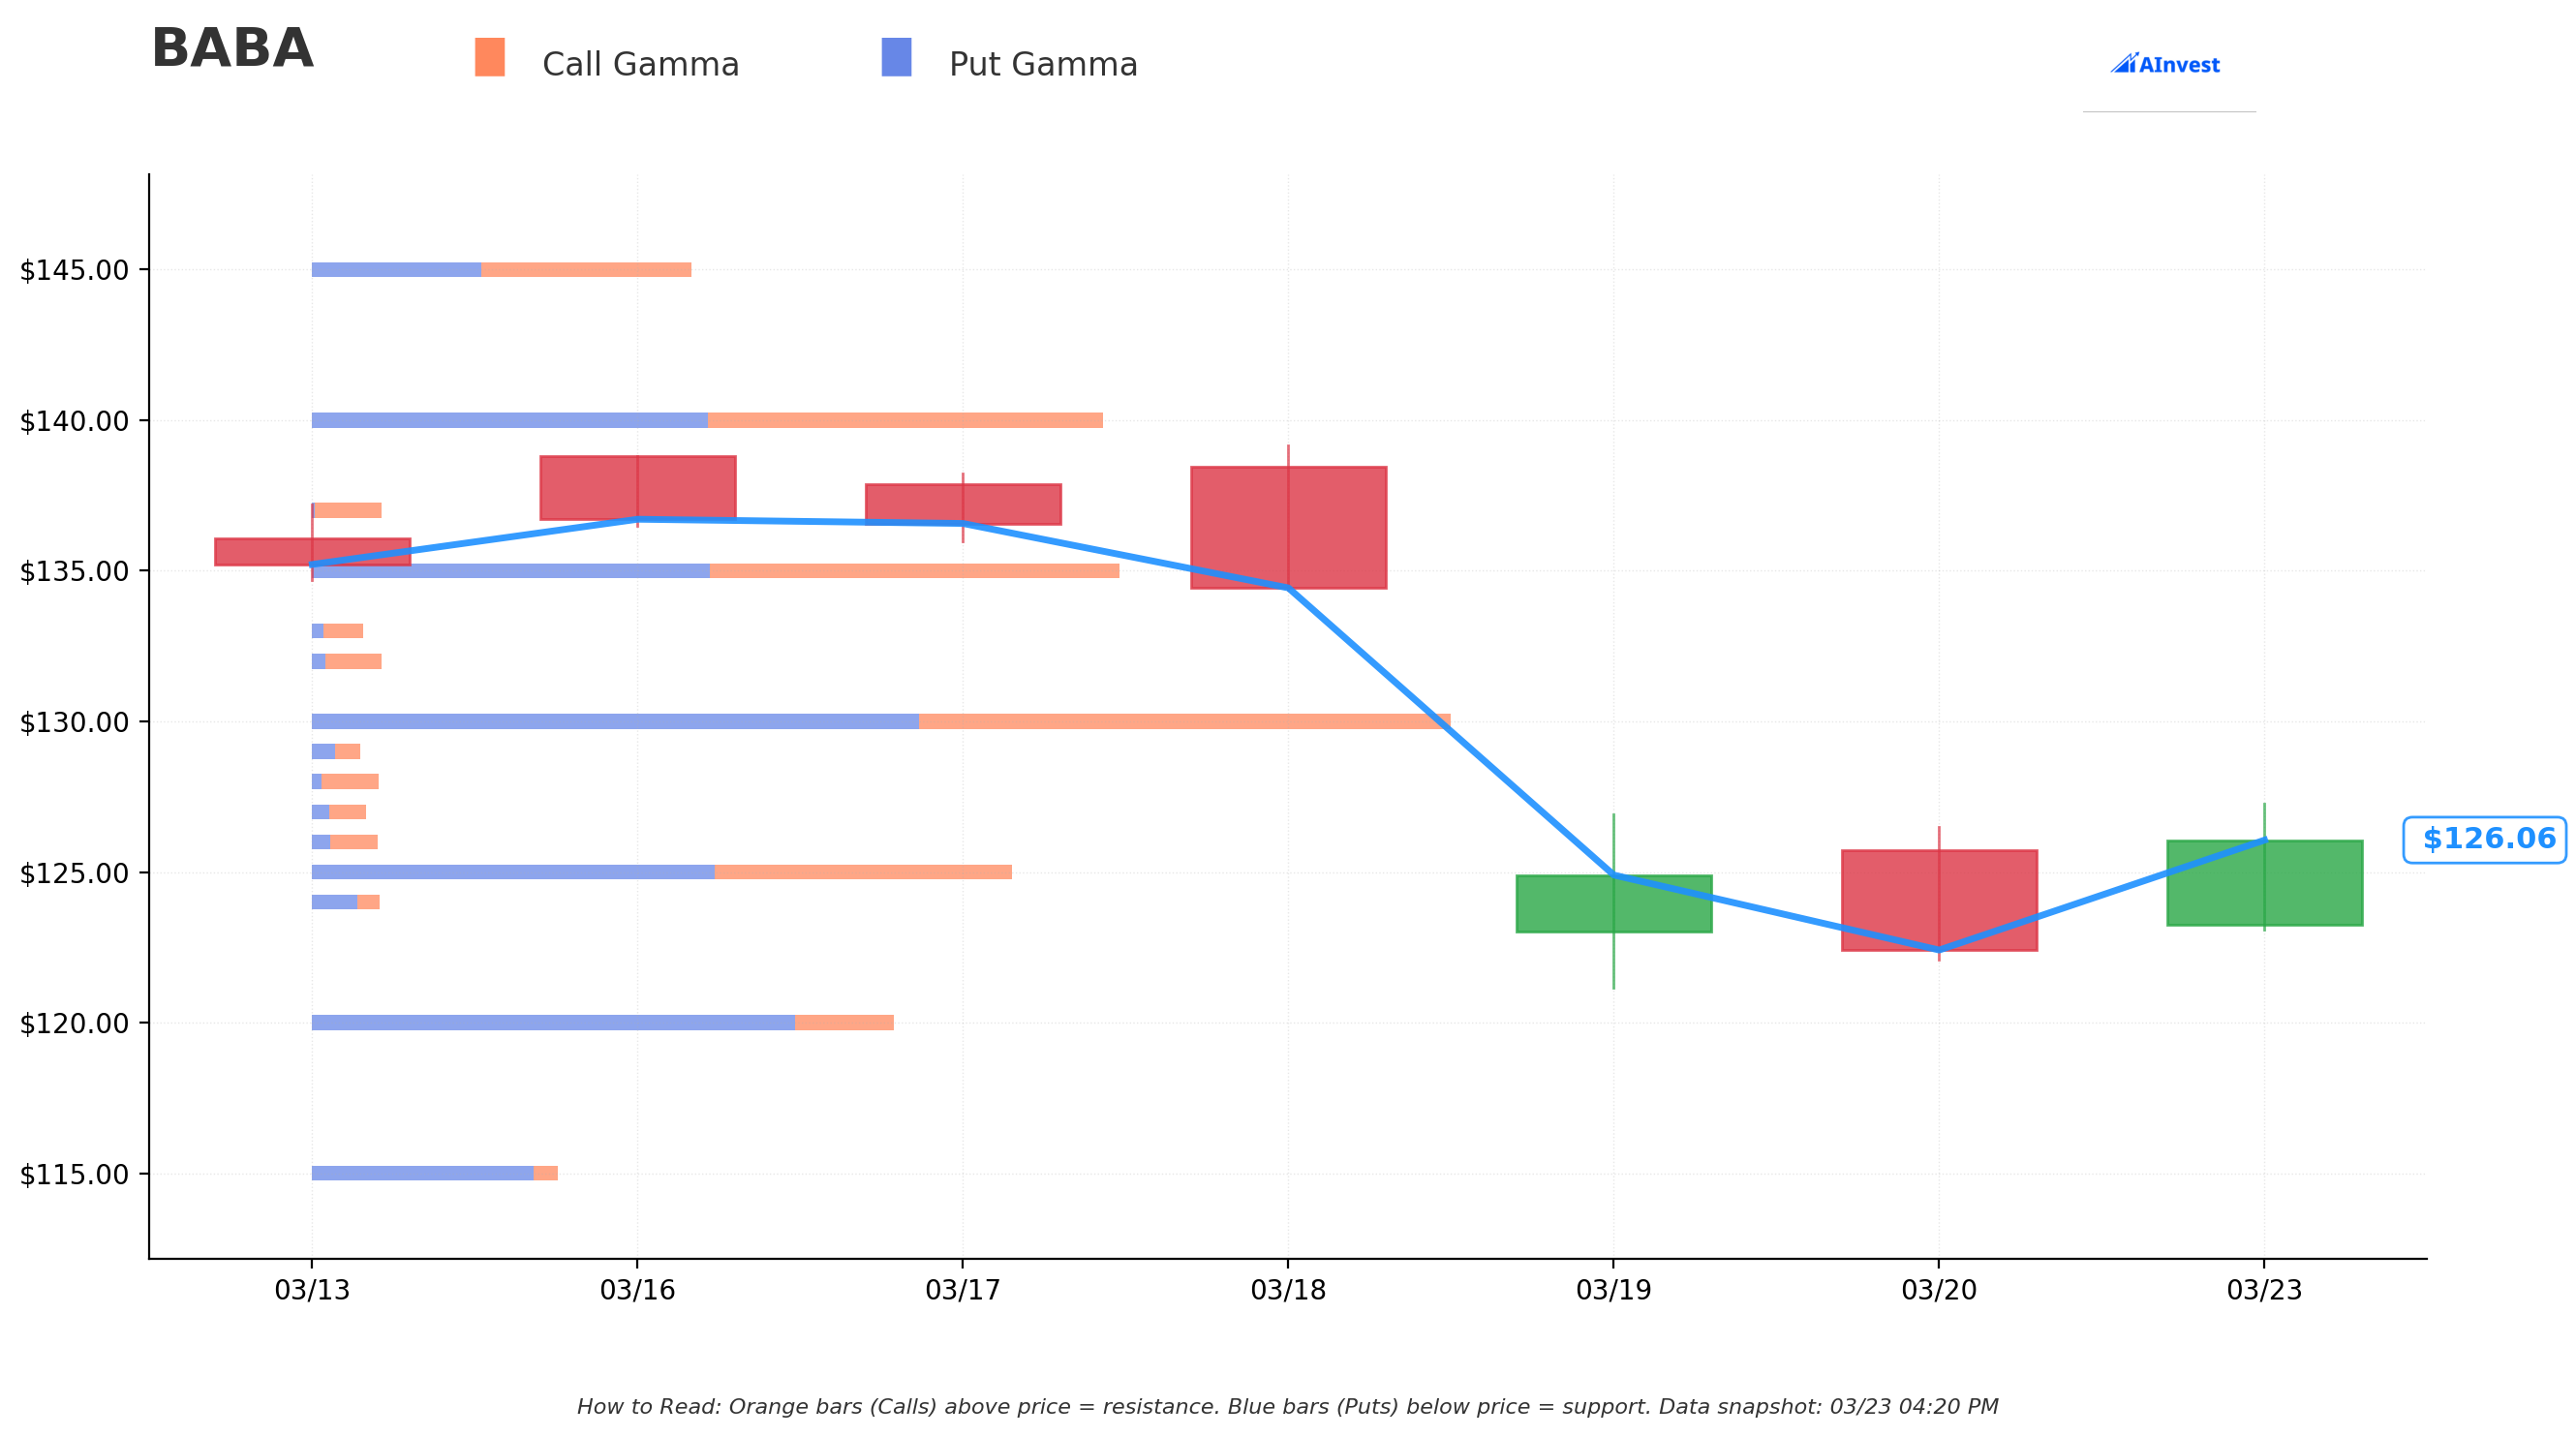
Current Price: $126.10
The gamma exposure map reveals where market makers are positioned and where price is likely to find natural magnets and walls:
🔵 Support Levels (Put Gamma Below Price):
- $125 - Immediate support with 15.9B total gamma (strongest nearby floor - price is sitting right on this level right now)
- $120 - Secondary support at 13.2B gamma - if $125 fails, this is the next landing zone
- $115 - Extended support at 5.6B gamma - only engaged in a real breakdown scenario
- $110 - Deep floor at 4.1B gamma - disaster scenario territory
🟠 Resistance Levels (Call Gamma Above Price):
- $130 - Immediate ceiling with 25.9B total gamma (STRONGEST RESISTANCE - only 3% above current price)
- $135 - Secondary resistance at 18.3B gamma (~7% above current)
- $137 - Lighter resistance zone at 1.6B gamma (~8.6% above current)
- $140 - Major structural ceiling at 18.0B gamma (~11% above current)
- $145 - The STRIKE of this trade! 8.6B gamma at exactly 15% above current price
- $150 - Extended upside at 14.4B gamma (~19% above current)
What this means for traders:
BABA is wedged right on top of the $125 gamma support with a thick wall of resistance starting at $130. The gamma data tells us market makers have enormous put exposure at $125 - they will be net buyers of BABA stock as it falls toward this level, which creates natural support. However, the $130 level is a meat grinder: $25.9B in gamma there means dealers will automatically sell into rallies approaching that strike.
The put buyer striking at $145 is targeting a breakout through every single resistance level between here and there - $130, $135, $140, $145. That is a high bar requiring a genuine momentum shift.
Net GEX Bias: Bullish ($98.3B call gamma vs $90.2B put gamma) - overall positioning skews bullish, consistent with the idea that smart money is leaning toward an eventual recovery.
Implied Move Analysis
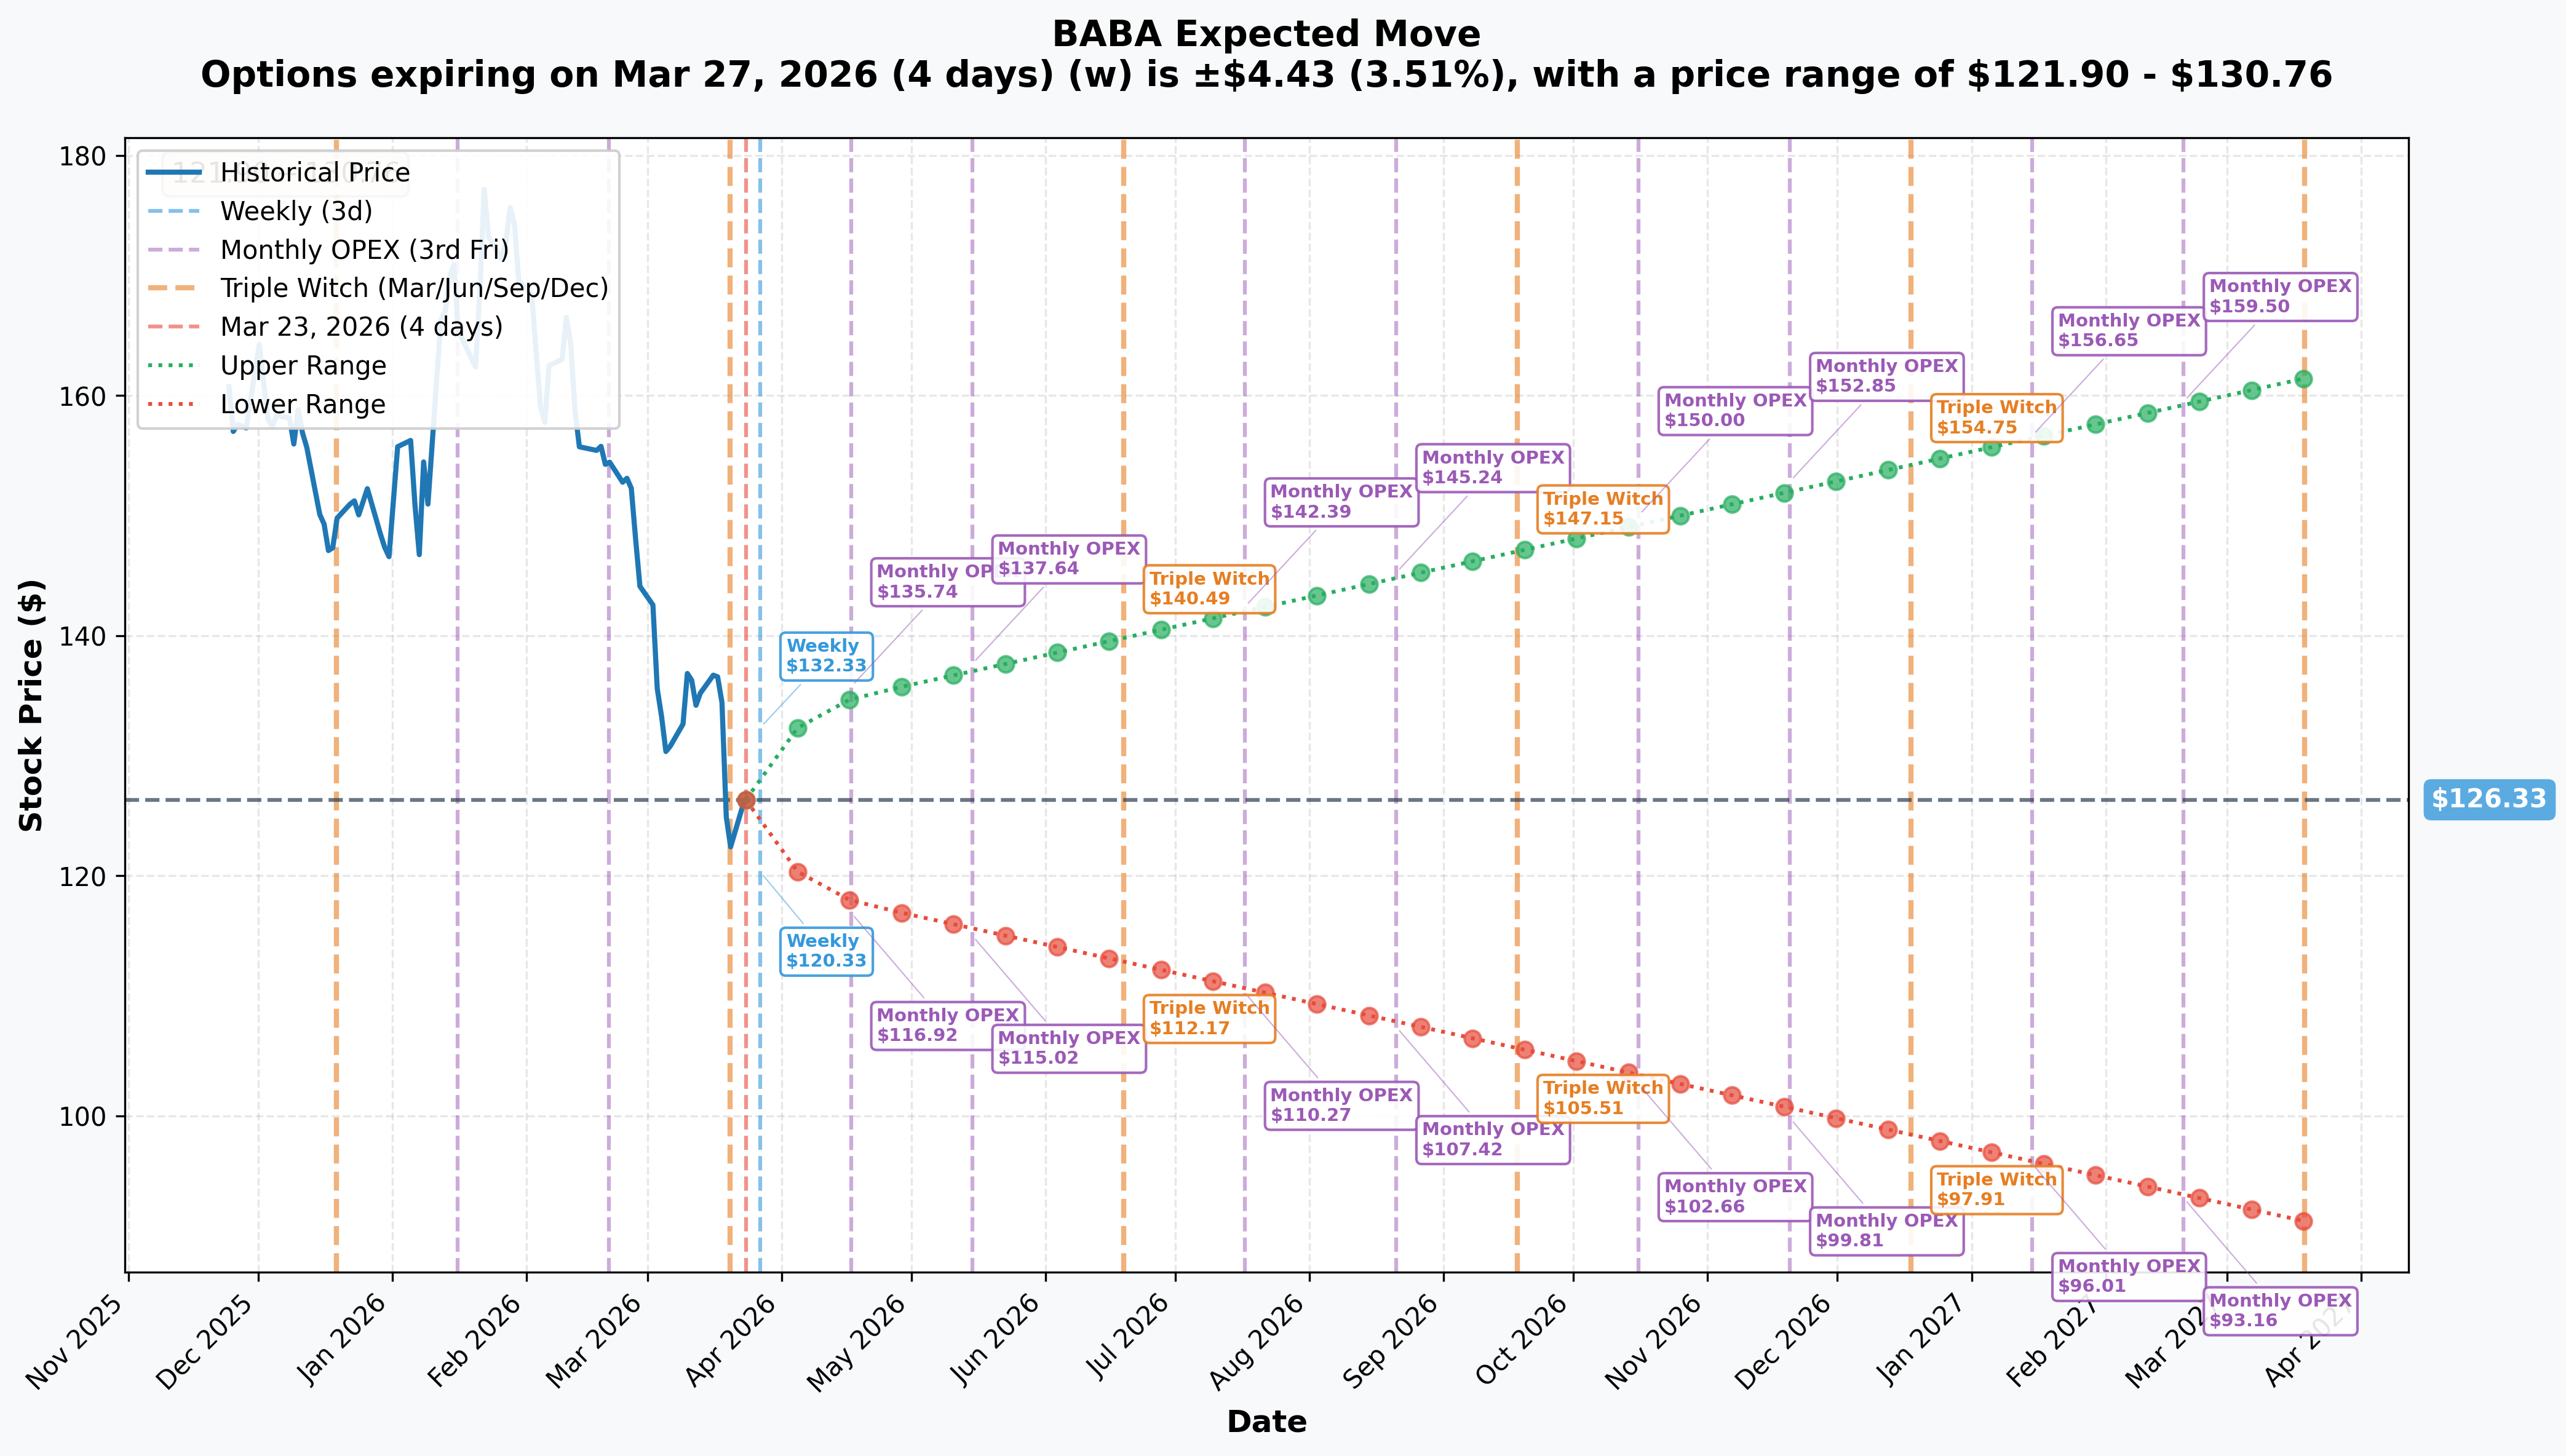
Options market pricing for upcoming expirations:
- 📅 Weekly (March 27 - 4 days): ±$4.43 (±3.51%) → Range: $121.90 - $130.76
- 📅 Monthly OPEX (April 17 - 25 days): ±$8.54 (±6.76%) → Range: $117.79 - $134.87
- 📅 May OPEX (May 15 - THIS TRADE!): Upper $137.64 / Lower $115.02 → ~±9% implied range
- 📅 Triple Witch (June 19): Upper $140.49 / Lower $112.17
- 📅 LEAPS (March 2027): ±$35.15 (±27.82%) → Range: $91.18 - $161.48
Translation for regular folks:
The options market is pricing in only a 3.5% move in the next 4 days (weekly), but over the May 15th expiration window the implied upper range is only $137.64. Here is the key insight: the $145 call that was just bought sits above the options market's implied move upper range for May expiration. That means for this trade to be in-the-money at expiry, BABA needs to move more than what the market is currently pricing as the likely upside scenario. This is an aggressive, high-conviction bet that the implied move is too conservative - possibly because the trader believes Q4 earnings will deliver a positive surprise that the market is not pricing in after the Q3 disappointment.
🎪 Catalysts
🔥 Recent Catalysts (Already Happened)
Q3 FY2026 Earnings - Reported March 19, 2026 (4 days ago)
Alibaba's Q3 results were genuinely mixed and triggered the selloff that set up this trade opportunity:
- ❌ Revenue: RMB 284.8B ($41.4B), up only 2% YoY, slightly missing consensus of RMB 290.7B
- ❌ Net Income: RMB 15.6B, down 66% YoY - the headline that spooked investors
- ❌ Free Cash Flow: Down 71% YoY to RMB 11.3B - massive AI/quick commerce investment burn
- ✅ Cloud Intelligence Group: Revenue up 36% YoY to $6.19B, AI products delivered triple-digit growth for the 10th consecutive quarter
- ✅ Cash Position: RMB 560B ($80.1B) - fortress balance sheet
- ✅ $100B AI Revenue Target: CEO Eddie Wu set a five-year goal to quintuple cloud and AI revenue to $100 billion annually
Analyst Reaction (March 19-21, 2026):
| Firm | Rating | Price Target |
|---|---|---|
| JPMorgan | Overweight | $205 (cut from $215) |
| Jefferies | Buy | $212 (cut from $225) |
| Mizuho | Outperform | $190 (cut from $195) |
| DZ Bank | Hold (downgrade) | - |
| MarketBeat Consensus | 37 Buy / 4 Hold / 1 Sell | ~$197-202 avg |
Qwen 3.5 AI Model Launch - February 16, 2026
Alibaba released Qwen 3.5 - a monster upgrade to its flagship AI model that claims to outperform GPT-5.2, Claude Opus 4.5, and Gemini 3 Pro on multiple benchmarks, with 60% lower operating costs. Qwen models surpassed 1 billion cumulative downloads with 300M+ monthly active users.
Pentagon Military List Incident - February 13, 2026
The Pentagon briefly listed Alibaba on its "Chinese Military Companies" list before withdrawing it the same day without explanation. Even though the listing was pulled, it erased billions in market cap in hours and left a geopolitical overhang that has not fully cleared.
Jack Ma / Xi Jinping Summit - February 17, 2025
Jack Ma appeared prominently at Xi Jinping's tech summit, signaling regulatory rehabilitation after years in the cold. Alibaba Chairman Joe Tsai said the meeting "gave us the confidence to put our earnings back into CAPEX and investments."
Apple Partnership for AI in China
Apple selected Alibaba's Qwen to power Apple Intelligence features for Chinese iPhone users, chosen over Baidu, Tencent, ByteDance, and DeepSeek. Expected to launch alongside iPhone 17 in Fall 2026 - though US officials have flagged concerns about the partnership.
📅 Upcoming Catalysts (Next 6 Months - What the $145 Call is Playing For)
1. Q4 FY2026 Earnings - Expected ~May 14, 2026 (ONE DAY BEFORE THIS CALL EXPIRES!)
This is the KEY catalyst. The $145 call expires on May 15th - practically on top of the expected Q4 earnings release:
- Consensus revenue: ~RMB 248.6B; Consensus EPS: ~$0.90 per ADS
- Key metrics to watch: Cloud Intelligence growth trajectory (can it sustain 35%+?), quick commerce losses narrowing, free cash flow recovery
- If cloud accelerates and profitability concerns ease, this could be the re-rating catalyst
2. Trump-Xi Meeting - Expected April 2026
A potential Trump-Xi meeting could settle the Pentagon list question and ease broader US-China tensions. Any constructive trade/geopolitical development would directly reduce the "China discount" embedded in BABA's valuation.
3. Wan 3.0 AI Video Model - Expected Mid-2026
Alibaba's 60B parameter Wan 3.0 model targeting 4K video generation and 30-second continuous generation is expected mid-2026. A strong launch could further validate the AI narrative.
4. Apple Intelligence China Launch - Fall 2026
Qwen-powered Apple Intelligence features on iPhone 17 targeting ~250 million Chinese iPhone users represents a potentially massive cloud inference revenue stream, though the revenue impact would likely land in FY2027.
5. Annual Cash Dividend
Ex-dividend date: June 12, 2026; Payment: July 10, 2026; Amount: ~$1.05 per ADS - provides a small but real income floor.
6. Share Buyback Firepower
$19.1 billion remaining buyback authorization through March 2027. At the current depressed price, buybacks are highly accretive and management has shown willingness to be aggressive.
🎲 Price Targets & Probabilities
Using gamma levels, implied move data, and the upcoming catalyst timeline:
📈 Bull Case (20% probability)
Target: $145-$155 by May 15th
How we get there:
- 🚀 Q4 FY2026 earnings (May 14) shows cloud accelerating to 40%+ growth, profitability improving
- ✅ Quick commerce losses begin to narrow meaningfully, easing the FCF concern
- 🤝 Trump-Xi meeting in April produces constructive outcomes, reducing geopolitical risk premium
- 🧲 Stock breaks through $130 gamma wall on volume, triggering dealer short covering
- 💰 Alibaba announces incremental buyback acceleration at depressed prices
- 📈 The $145 strike is exactly at the top resistance level on the GEX chart - a breakout through all resistance levels between $126 and $145 would need to happen
- This call goes from $2.28 to potentially $5-15+, delivering 2x-6x returns on the premium
⚖️ Base Case (50% probability)
Target: $128-$138 by May 15th
How we get there:
- 📊 Stock recovers somewhat from the post-Q3 flush, but the $130 resistance ($25.9B gamma) caps the rally
- ☁️ Cloud growth remains solid but overall earnings print is mixed again
- 🔄 Geopolitical noise continues without clear resolution
- 📉 The $145 calls expire worthless or nearly so - the $2.28 premium paid likely goes to near zero
😰 Bear Case (30% probability)
Target: $110-$120 by May 15th
How we get there:
- ❌ Q4 earnings miss further deteriorates sentiment, investors question the $100B AI revenue thesis
- 🚨 Pentagon military list gets reposted, triggering forced selling from US institutional holders
- 📉 US-China trade tensions escalate, adding more discount pressure on Chinese tech
- 🌊 The $125 gamma support fails and price washes through $120 to $115 levels
- The $2.28 in premium paid is a total loss
💡 Trading Ideas
🛡️ Conservative - "Catch the Bounce with Training Wheels"
Buy the $125/$135 call spread (April 17 expiry)
- Buy the April $125 call + Sell the April $135 call
- Estimated cost: ~$3.50-$4.00 debit for $10 wide spread
- Max profit: ~$6-$6.50 if BABA is above $135 at April OPEX
- Why this works: You are participating in a bounce off the $125 gamma support to the $135 resistance, with defined risk and a much lower bar than the whale's $145 strike. The implied move upper range for April OPEX is $134.87 - you are basically playing the options market's own expected upside
⚖️ Balanced - "Ride the Gamma Squeeze"
Buy BABA $130 calls (May 15 expiry)
- Cost: Roughly $4.50-$6.00 depending on vol levels
- Breakeven: ~$135-$136 at expiry
- Why this works: The $130 call is just above the massive $25.9B gamma resistance wall. If BABA breaks $130 with momentum (say, on pre-earnings bullishness), dealer hedging flows actually ACCELERATE the move higher as they buy stock to hedge new delta. You are betting on a gamma squeeze through the first major wall, with Q4 earnings acting as the binary catalyst
- Captures the same May 14th earnings catalyst as the whale trade, but at a more achievable strike
🚀 Aggressive - "Follow the Whale (Scaled Down)"
Mirror the $145 call position (May 15 expiry) - 1-5 contracts
- The exact trade: BABA May 15 $145 calls at ~$2.28 ($228 per contract)
- For 5 contracts: ~$1,140 total cost
- Max loss: 100% of premium ($1,140)
- Max gain: Theoretically unlimited above $145 at expiry
- Why this makes sense as a lotto ticket: At $2.28, the risk/reward is asymmetric if you believe Q4 earnings will be a positive catalyst. The whale paid $2.2M for the same thesis you can play for $228 per contract
- ⚠️ High risk: This is 15% OTM and requires a significant move in 53 days. Treat this as a small speculative position, NOT a core holding
⚠️ Risk Factors
The Bull Thesis Has Real Obstacles:
- ❌ Earnings risk is two-sided: The same Q4 earnings catalyst on May 14th that could send this call soaring could also confirm the bear thesis if cloud growth decelerates or FCF stays ugly
- ⚠️ $130 is a thick wall: The $25.9B in gamma at $130 resistance is the single strongest level in the entire gamma profile. BABA needs sustained institutional buying to punch through - a weak bounce gets sold there
- 🚨 Pentagon list could return: The February withdrawal did not clear the underlying geopolitical risk. Any re-listing would be a sharp negative event
- 📉 The $145 strike is above the implied move: The options market itself is only pricing BABA to $137.64 by May OPEX. The whale is betting against the consensus implied move - that is a low-probability outcome by mathematical definition
- 💸 Net income is in freefall: Down 66% last quarter, FCF down 71% - the investment cycle is compressing reported profitability hard. Retail investors who focus on earnings headlines (not cloud growth) will keep selling
- 🏦 ADR discount risk: BABA trades as an American Depositary Receipt on NYSE. US-China political tensions create structural discount that can widen unpredictably - delisting concerns have resurfaced in analyst notes
- 🎯 Time decay is brutal on OTM calls: With 53 days to expiry and a strike 15% OTM, theta (time decay) erodes the $2.28 premium daily if BABA stays range-bound. Every day that passes without a move toward $145 costs real money
🎯 The Bottom Line
Real talk: This is a big, aggressive, directional bet that Alibaba's post-earnings selloff has gone too far and that Q4 earnings in May will be the catalyst for a meaningful re-rating. The thesis has genuine merit - 36% cloud growth, a $100B AI revenue roadmap, an Apple iPhone partnership, $80B in cash, and $19B in buybacks at a stock sitting 30%+ off its highs is a compelling setup on paper.
But the $145 strike is asking for a lot. BABA needs to rally 15% in 53 days through multiple stacked resistance levels ($130, $135, $140) to put this trade in-the-money. The options market's own implied move says the upper range is only $137.64 for May OPEX - the whale is betting the market has this wrong.
If you own it: The gamma data suggests $125 is the floor to watch. Hold above $125 and the technical picture is constructive. Lose $125 and the next natural support is $120.
If you're watching: The May $130/$135 call spread is a more measured way to play the same thesis with a much more achievable price target at lower cost and risk.
If you're skeptical: The bear case is real - geopolitical risk, an earnings miss risk on May 14th, and ongoing profitability pressure could send BABA back toward $115. The $145 calls could easily expire worthless.
Mark your calendar for May 14, 2026 - that Q4 earnings report is the make-or-break moment for this entire trade.
The lesson here: When a single trader drops $2.2M on OTM calls right after a bad earnings reaction, they are either very wrong or they know something the rest of the market hasn't priced in yet. Watch the $130 level - if BABA starts powering through that gamma wall over the next few weeks, the whale thesis is working. 👀
⚠️ Disclaimer: This analysis is for informational and educational purposes only and does not constitute financial advice. Options trading involves substantial risk of loss and is not suitable for all investors. Unusual options activity does not guarantee future price movement. Always do your own research and consult a qualified financial advisor before trading. Past performance is not indicative of future results.