🐻 DRAM ≈$8.5M Aggressive Put Sweep — Bears Target the Red-Hot Memory ETF Ahead of Micron Earnings
📅 June 11, 2026 | 🔥 Unusual Activity Detected
✅ Updated 2026-06-12: Next-day OPRA OI confirms the open — open interest rose 989 → 16,035 (Δ +15,046, even larger than the ≈9,959 we tracked as more bears piled in). The bearish $65 put position into Micron's June 24 earnings is confirmed on the books.
🎯 The Quick Take
Four back-to-back put sweeps just hit the tape on DRAM (Roundhill Memory ETF) — someone spent ≈$8.5M in net premium lifting the ask on $65 puts expiring July 17, 2026. With 9,959 contracts bought across four prints in under 15 minutes, this is the most aggressive single-day options action the ETF has seen. The setup is deliberate: Micron (≈24% of the fund) reports fiscal Q3 earnings on June 24 — squarely before expiry — and the ETF has already rocketed ≈+128% since its April 2 launch. Someone is positioning for a near-term pullback, or hedging a large DRAM long, on a parabolic, hyper-concentrated fund where every major holding is rated overvalued by Morningstar.
📊 ETF Overview
DRAM (Roundhill Memory ETF) is not a stock — it is the first-ever dedicated memory-chip ETF, launched April 2, 2026 by Roundhill Investments:
- AUM: ≈$10B — reached $10B in just 50 days, the fastest any ETF has ever hit that milestone
- Expense ratio: 0.65%/yr
- Launched: April 2, 2026 (Roundhill / ETFGI)
- Performance since launch: ≈+128% as of June 11, 2026
- Concentration: Samsung ≈25%, SK Hynix ≈24%, Micron ≈24% — roughly 73% in just three names
- What it tracks: DRAM, High-Bandwidth Memory (HBM), NAND flash, and SSD manufacturers globally
The concentration is what makes this ETF both exciting and dangerous. You are not diversified when you buy DRAM — you are making a leveraged bet on Samsung, SK Hynix, and Micron, with the rest of the fund filling in the gaps. When Micron reports on June 24, ≈24% of this ETF's value is directly on the line.
Sector: Semiconductors / Memory Chips Exchange: BATS
💰 The Option Flow Breakdown
The Tape — June 11, 2026 | ⚡ AGGRESSIVE LIT SWEEP — 4 Prints, 15 Minutes
| Time | Buy/Sell | Call/Put | Expiration | Premium | Strike | Volume | OI | Size | Spot | Option Price | Option Symbol |
|---|---|---|---|---|---|---|---|---|---|---|---|
| 14:08:44 | BUY | PUT | 2026-07-17 | ≈$1.9M | $65 | 2,300 | 989 | 2,233 | $62.42 | $8.70 | DRAM20260717P65 |
| 14:08:57 | BUY | PUT | 2026-07-17 | ≈$2.2M | $65 | 5,000 | 989 | 2,514 | $62.40 | $8.70 | DRAM20260717P65 |
| 14:15:16 | BUY | PUT | 2026-07-17 | ≈$1.7M | $65 | 7,100 | 989 | 2,002 | $62.84 | $8.50 | DRAM20260717P65 |
| 14:23:24 | BUY | PUT | 2026-07-17 | ≈$2.7M | $65 | 12,000 | 989 | 3,210 | $62.86 | $8.50 | DRAM20260717P65 |
Total net premium: ≈$8.5M | Total size: ≈9,959 contracts | Flow type: ⚡ LIT SWEEP
Mechanism — tape-verified: Every single print is 100% lit auto-execution, 100% crossing the NBBO at the ask. This buyer lifted the offer four times in under 15 minutes, paying up to get filled. No negotiation, no facilitated block — just a buyer aggressively taking supply out of the displayed order book. This is the real thing: genuine, impatient aggression.
✅ RESOLVED — Next-Day OI Confirms the Open (2026-06-12)
| Snapshot | Open Interest |
|---|---|
| Pre-print baseline (EOD 2026-06-10) | 989 |
| Resolving (EOD 2026-06-11) | 16,035 |
| Δ | +15,046 |
Open interest ROSE by ≈15,046 — well above the ≈9,959 our four prints captured, meaning still more traders piled into the $65 puts that session. The aggressive, at-the-ask bearish position into Micron's ≈June 24 earnings is confirmed open and growing.
🤓 What This Actually Means — Plain English
Let's cut through the jargon.
A put option is the right — but not the obligation — to sell an asset at a fixed price by a set date. Buying puts is a way to profit when a stock or ETF goes DOWN, or to protect an existing long position from losses.
Here, the buyer purchased DRAM $65 puts expiring July 17, 2026 — 36 days away. With DRAM trading at ≈$62.86, the $65 strike is actually in-the-money (strike > spot by ≈$2.14). The $8.50 premium they paid consists mostly of time value baked in because DRAM's implied volatility is very elevated.
Why would someone pay $8.5M for puts on an ETF that's up 128%?
Two possibilities — and both are legitimate:
-
Bearish bet on a near-term pullback. The buyer thinks DRAM has run too far, too fast, and that the upcoming Micron earnings (June 24) will trigger a "sell-the-news" reaction. With consensus set at ≈$33.5B revenue and ≈81% gross margin for Micron's fiscal Q3, the bar is extremely high. Even a slight guidance wobble could cause a sharp drawdown in both MU and the ETF that holds it at 24%.
-
Hedging a big DRAM long. Large holders of DRAM shares sometimes buy puts as insurance — not because they're bearish, but because they want to protect gains on a +128% position without selling and triggering taxes. The aggressive "lift the ask" behavior suggests urgency, not passive hedging, but we can't rule this out.
The order type is BTO — Buy to Open. This is a fresh put position. The tape is unambiguous: 9,959 contracts bought against only 989 prior OI.
Key detail about the strike: The $65 strike sits exactly at the gamma resistance wall from the GEX data — and now also at the highest open interest level in the July chain. Market makers are short calls and long puts at $65, creating mechanical selling pressure whenever DRAM approaches that level. The buyer picked the strike that is both in-the-money AND the key technical ceiling. That's not accidental.
What does the buyer need to profit? With ≈$8.50 paid, the breakeven on expiry is $65 − $8.50 = $56.50. DRAM would need to fall ≈10% from current levels for these puts to be worth more than they cost at expiration. At $50, they're worth $15 — a 76% gain on the option. They profit more the lower DRAM falls, and the trade is time-boxed: it either works by July 17 or the premium is gone.
📈 Technical Setup / Chart Check-Up
YTD Performance
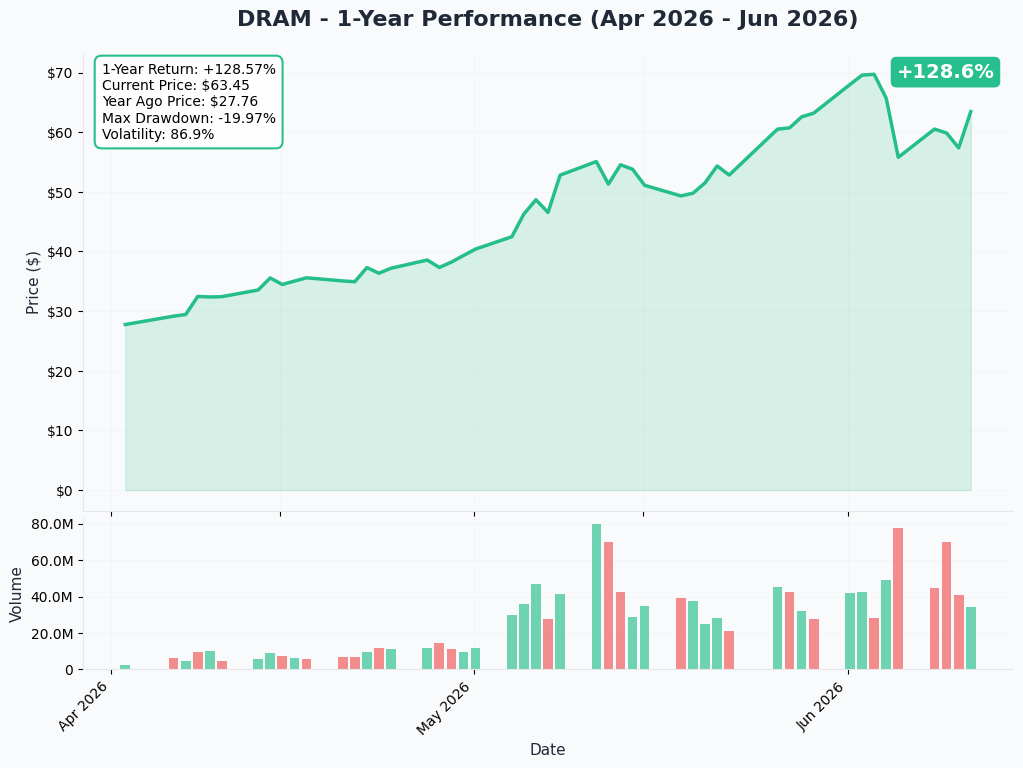
DRAM launched April 2, 2026 and has been essentially vertical since. A ≈+128% move in roughly 10 weeks is parabolic by any measure — this is what the AI memory supercycle narrative does when it gets hot inflows from retail and institutional momentum chasers alike.
Key observations:
- 🚀 The rally has been nearly uninterrupted since launch — there have been almost no meaningful pullbacks
- 📈 AUM reached $10B in 50 days, drawing in ≈$10B of new capital chasing the momentum
- ⚠️ A +128% move with virtually no corrections is classic "priced for perfection" territory — the further you go without a pullback, the more painful the eventual one tends to be
- 📅 The ETF is ≈10 weeks old; there is no long-term technical history to reference, which makes the gamma levels below especially important for near-term navigation
Gamma-Based Support & Resistance
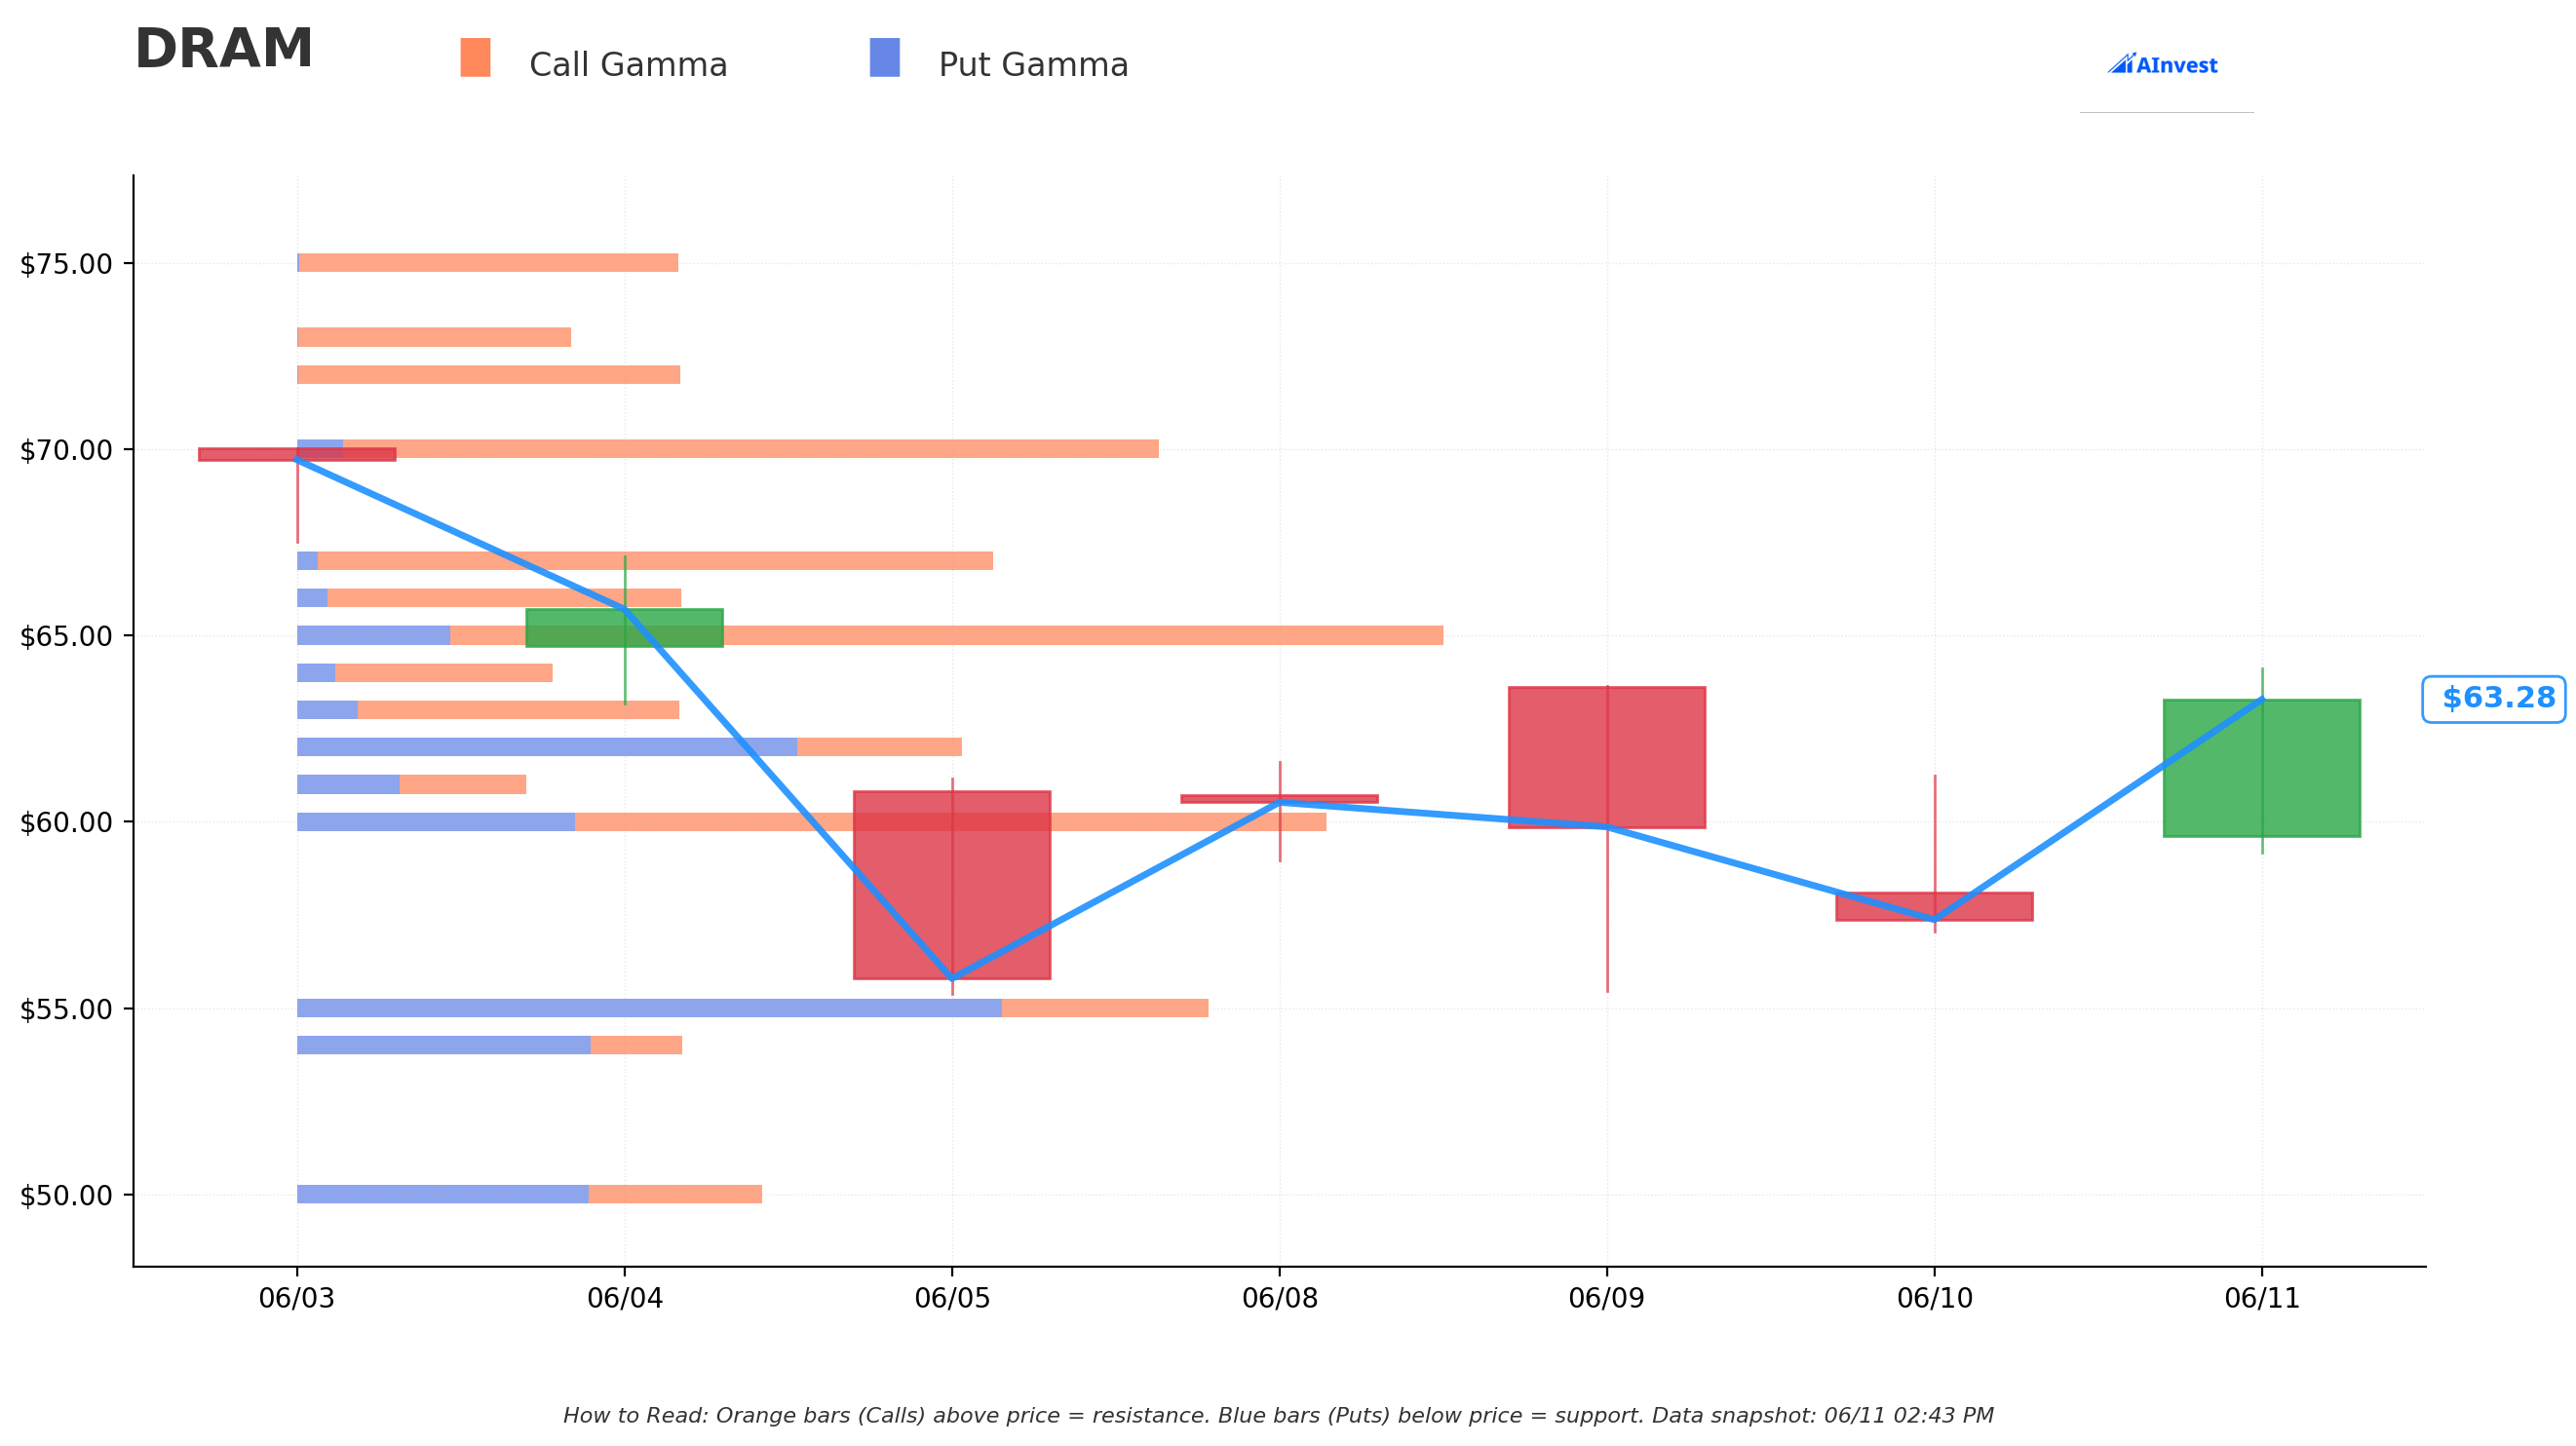
Current Price: ≈$63.33
The gamma exposure data (from gex.json) gives us the key mechanical price levels where options positioning creates natural buying and selling pressure.
🟠 Resistance Levels (Call Gamma / Selling Pressure Above Price):
- $65 — Major Gamma Wall. This is the most dominant resistance level, and it is also exactly the put strike the buyer chose. Market maker hedging creates consistent selling pressure as DRAM approaches $65. The ≈9,959 new puts opened at this strike just reinforced the level with a massive put open interest cluster. Any rally toward $65 will face heavy headwinds.
- $67 and $70 — Secondary Resistance. Lighter gamma walls above. A clean break through $65 would be needed before these even come into play.
🔵 Support Levels (Put Gamma / Buying Pressure Below Price):
- $60 — Key Support Floor. The nearest meaningful put gamma cluster below current price. Market makers will tend to buy dips toward $60, creating a natural cushion. This is the first level the put buyer needs DRAM to break through.
- $55 — Deeper Support. The next significant gamma floor below $60. If $60 gives way, this is where the next natural stopping point sits. For the $65 puts to be solidly in-the-money and profitable by expiration, DRAM would need to trade through this level as well.
Translation for traders: Right now DRAM is sandwiched between $60 support and a massive $65 resistance wall. The put buyer is betting DRAM breaks $60 on its way lower — driven by the June 24 Micron catalyst. If DRAM stays pinned above $60, the puts lose time value every day.
Implied Move Analysis
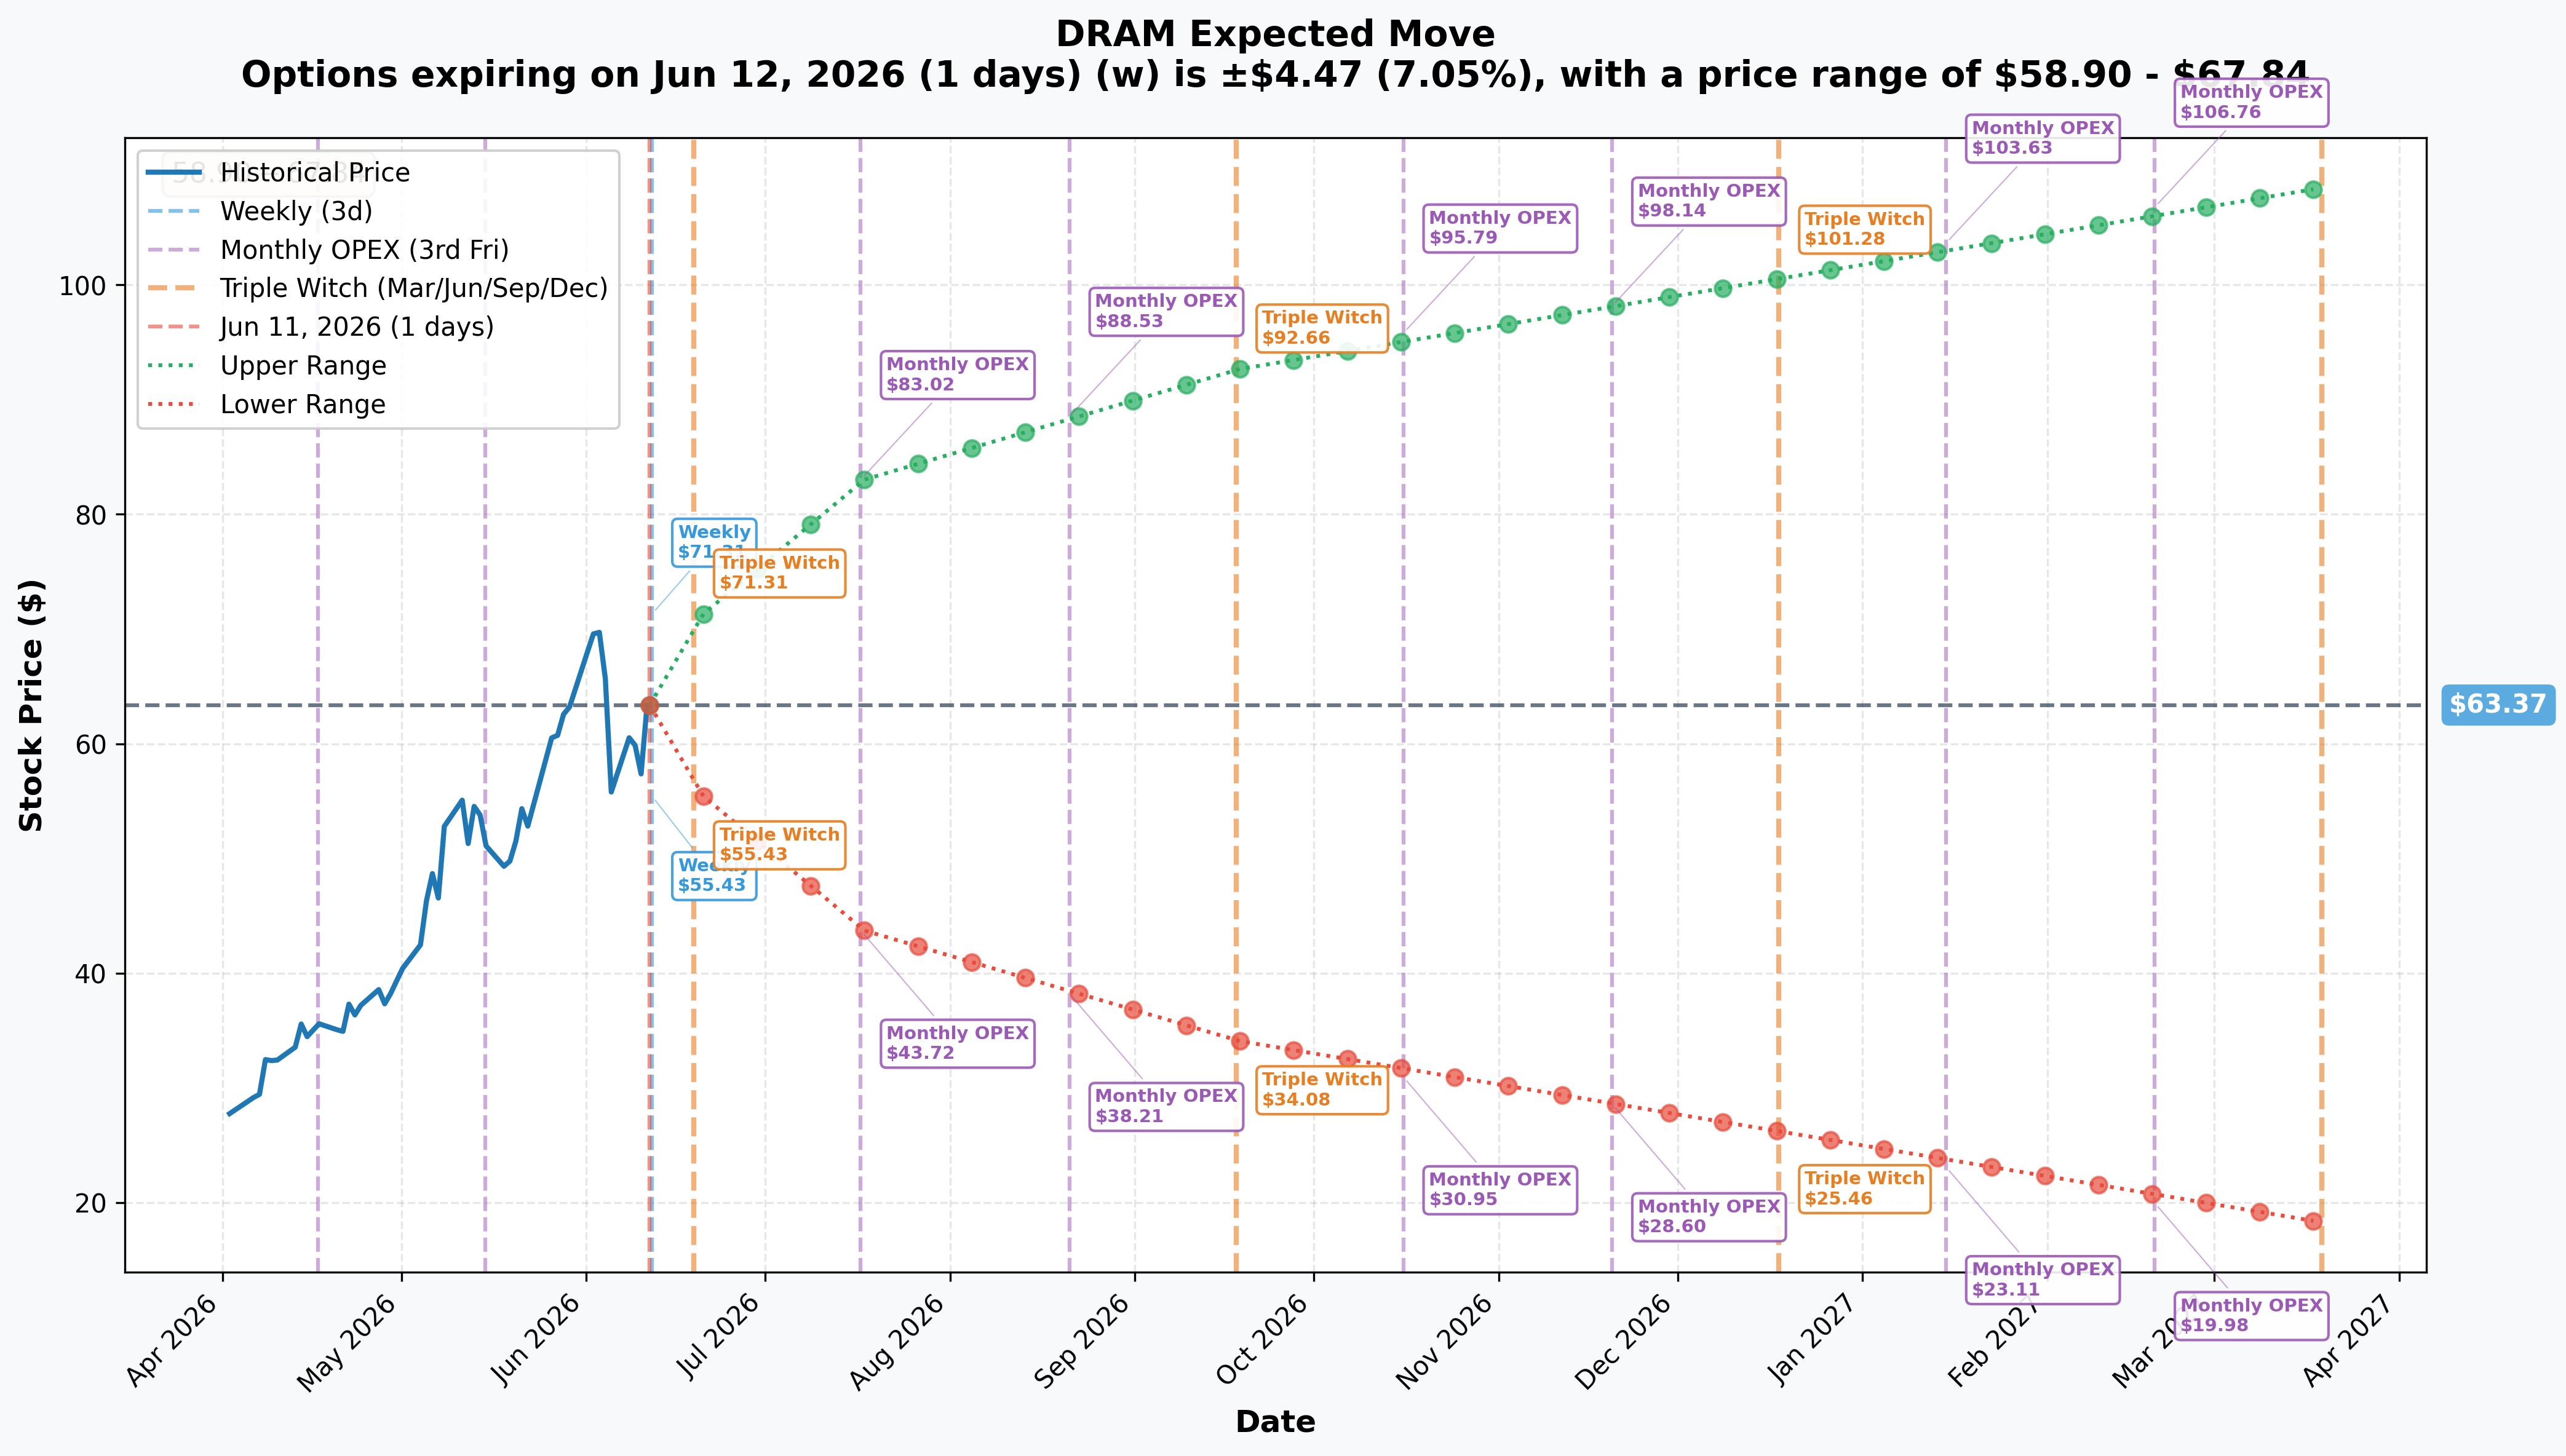
The options market is pricing an enormous range of outcomes for DRAM given its extreme realized volatility and young history:
- 📅 Weekly (≈7-day): ≈±7% — a roughly $4–$5 swing either direction week-to-week
- 📅 Monthly OPEX (2026-07-17, 36 days — THIS trade's expiry): ≈±31% → Range $43.72 – $83.02
A ±31% implied move on a 36-day window is very wide — it reflects how volatile this brand-new, concentrated, parabolic ETF is. The options market is basically saying: by July 17, DRAM could be anywhere from $44 to $83.
For the put buyer, the lower half of that cone ($43.72–$62.86) is the profit zone. They need DRAM to drift into that lower range by July 17 for a full win. A fall to $55 would put them solidly in-the-money. A fall to $50 or below would be a major winner. If DRAM stays above $65, the puts expire worthless and the buyer loses the full $8.5M.
Key takeaway: The options market's own implied probability range says a significant DRAM pullback is well within the realm of realistic outcomes — it's just a question of whether the timing is right.
🎪 Catalysts
⭐ The Trade Is Timed Around This — Micron Fiscal Q3 Earnings: June 24, 2026
This is the single most important event inside the put's life. Micron (≈24% of DRAM) reports fiscal Q3 results on June 24, 2026 at 2:30 p.m. Mountain time — 13 days from now, and a full 23 days before the July 17 expiry.
The bar is extremely high. Company guidance / consensus heading in: revenue ≈$33.5B (±$0.75B), gross margin ≈81%, EPS ≈$19.15. MarketBeat analysts are tracking closely.
Why is this THE catalyst? 24/7 Wall St. explicitly flags that if Micron walks back its 2027 order-book commentary, the bull case for DRAM weakens materially. With the stock — and the ETF — priced for flawless execution, even a technically solid beat could trigger "sell-the-news" behavior. Micron's blowout fiscal Q2 (reported March 18, 2026) with $23.86B revenue crushing the ≈$20.07B consensus was the engine of the ETF's rally. Replicating that magnitude of upside surprise with a ≈$33.5B revenue target is a much harder lift.
Monthly TrendForce Memory Contract-Price Prints — Ongoing
24/7 Wall St. calls TrendForce's monthly contract-price reports "the single most important signal to watch" for DRAM's sustainability. Historically, two consecutive months of declining DDR5 contract prices precede severe drawdowns, with memory stocks shedding 40–60% within six months of a pricing peak. Any June or July TrendForce print showing price softness would be an immediate bearish trigger inside the put's 36-day life.
Context: server DRAM contract prices were hiked 60–70% QoQ by Samsung and SK Hynix earlier in 2026, and conventional DRAM prices were projected up 58–63% QoQ in Q2 2026. The question is whether this pricing power continues into Q3.
Already Happened (Supporting the Parabolic Run)
Micron Blowout Fiscal Q2 (March 18, 2026) Revenue $23.86B — smashing the $20.07B consensus; non-GAAP EPS $12.20; HBM4 volume production for Nvidia's Vera Rubin underway. Micron raised FY2026 capex to >$25B from $20B. This was the earnings print that lit the ETF's fuse.
Structural AI Memory Demand — HBM Supercycle Samsung and SK Hynix have warned AI-driven memory shortages could last into 2027 and beyond, with customers reserving supply years ahead. Nvidia's Vera Rubin ramp confirmed AI memory demand is structural. HBM3E prices were raised ≈20% for 2026 on Nvidia H200 + Google TPU / Amazon Trainium demand.
Overvaluation Warning Signs (Bear Case Accumulating) Morningstar flags virtually every DRAM holding as overvalued as of mid-May 2026 — none of the big three has a durable moat, and memory's commodity nature "historically produces violent boom-bust cycles." Yahoo Finance labeled DRAM's rally a scenario where "an 85% surge masks a dangerous bet". The Motley Fool flagged the surge in inflows as potentially a "too late to buy" late-cycle signal.
Upcoming Catalysts to Watch
📅 June 24, 2026 — Micron Q3 Earnings (23 days before expiry) The binary event the trade is built around. Watch revenue vs ≈$33.5B consensus and gross margin vs ≈81% guidance. Any commentary walking back the 2027 order-book strength is the bear trigger.
📅 June–July — TrendForce Monthly Price Prints First sign of DRAM/DDR5 contract price softness would hit sentiment before Micron even reports.
📅 Hyperscaler Capex Guidance (ongoing) AWS, Google, Microsoft, and Meta Q2 earnings guidance on data center spend feeds directly into the HBM demand equation. Any "capex discipline" commentary is a headwind.
📅 July 17, 2026 — Put Expiration The final verdict date. The buyer has 36 days to be right.
🎲 4-Reader Interpretation
🚀 YOLO Trader
The structure is already done for you — someone bought the DRAM July-17 $65 puts at $8.50. If you want to ride alongside, those are the contracts. You need DRAM below ≈$56.50 at expiry to profit, and the more it falls, the bigger the win. The Micron earnings on June 24 are the ignition switch — if MU disappoints and the ETF drops 15–20%, these puts could double or triple. The risk: if DRAM stays flat or climbs further, you lose 100% of whatever you pay. Size it to what you can afford to lose outright, because that is a realistic outcome.
📊 Swing Trader
The $60 gamma support is your pivot. If DRAM breaks and closes below $60 on volume after the Micron earnings print, that removes the nearest mechanical floor and opens a path toward the $55 gamma level. A swing setup: watch the close on June 24 / 25 post-earnings. If MU sells off and drags DRAM below $60, the momentum toward $55 could be swift. Near-term put spreads (e.g., buying the $65 put and selling the $55 put to reduce cost) would give you a defined-risk way to play the post-earnings move. If DRAM rallies above $65 on a Micron beat, the put case is weakened for now — close and reassess.
🛡️ Premium Collector
With DRAM's implied volatility at extreme levels on a brand-new, parabolic ETF, selling premium is tempting — but be careful. Selling puts below $60 (e.g., short the $55 put) to collect income could work if DRAM holds above $60, but you are short gamma on an ETF that can move ±7% per week. A Micron earnings miss could blow through your short strike quickly. If you do sell premium, keep it small, pick a strike well below the $60 gamma floor, and close before the June 24 earnings binary rather than running through it naked.
🌱 Entry-Level / Beginner
Here's what happened in plain English: someone paid ≈$8.5 million for the right to profit if this ETF goes down before July 17. They bought what's called a "put option" — think of it as a bet that the price drops, or as an insurance policy on a position they already own. They did it four times in a row in 15 minutes, which is the urgency signal that makes this unusual. The ETF has gone up ≈128% since it launched in early April — that's an extraordinary move in just 10 weeks. The key upcoming event is Micron's earnings on June 24: Micron is roughly one-quarter of this ETF, and if Micron's results disappoint after such a big run-up, the whole fund could pull back sharply. That's the window these put buyers are targeting. These trades do not mean the ETF will definitely fall — the buyer could be wrong. But when $8.5M of put premium gets bought this aggressively right before a major earnings event, it's worth paying attention to.
⚠️ Risk Factors
Options trading involves substantial risk of loss and is not suitable for all investors. Here are the specific risks for this trade and thesis:
The Bull Case Is Real — Micron Could Beat Again Micron just printed $23.86B in revenue against a $20.07B consensus in March. The AI memory demand story is confirmed by Nvidia's Vera Rubin ramp and Samsung/SK Hynix order books filled into 2027. If Micron beats June 24 consensus by even a moderate margin and maintains its 2027 guidance, DRAM likely rallies — and all $8.5M in put premium evaporates.
Time Decay Works Against Put Buyers Every Day At ≈$8.50 premium on a 36-day option, theta (time decay) is burning away the option's value daily. If DRAM stays flat between now and July 17, the puts lose significant value even without a move higher. The buyer needs the catalyst to arrive — and soon.
Concentration Risk Cuts Both Ways The ETF's 73% concentration in three names means a single positive Micron surprise on June 24 could spike the ETF sharply. Concentrated funds are volatile in both directions.
Memory-Cycle Glut Risk Is Real, But Timing Is Uncertain Analysts warn a mid-2026 wave of new HBM/DRAM capacity could meet slowing orders, potentially causing prices to roll over. But Samsung and SK Hynix currently project shortages lasting into 2027. Timing a supercycle peak is genuinely hard, and being early is the same as being wrong on a 36-day option.
Currency Risk (Won Exposure) As a Korean-won proxy with Samsung + SK Hynix at ≈49%, a 5% won move can swing NAV by ≈2.5 percentage points independent of stock performance. An unexpected won strengthening could partially offset any put gains from a Micron-driven selloff.
ETF Rebalancing Drag Three positions pinned near the ≈25% cap force trimming into strength, capping upside — but this is a modest mechanical effect, not a primary risk for short-term put holders.
What the OPRA Tape CANNOT Tell Us: We know the mechanism (lit sweep, 100% at-ask), size (≈9,959 contracts), premium (≈$8.5M net), and direction (BUY PUT = bearish / hedge). We do not know the buyer's identity, whether this is a standalone directional bet or part of a larger hedged portfolio, or whether they are hedging an existing DRAM long. A motivated DRAM long-holder buying ≈9,959 puts as insurance has a very different risk profile than a pure short speculator. Both interpretations fit the tape. We interpret the tape; we do not read minds.
🎯 The Bottom Line
Here's the deal: someone just paid ≈$8.5M in net premium to aggressively bet on — or hedge against — a near-term pullback in the hottest new ETF on the market. Four prints, one strike, under 15 minutes, 100% at-the-ask. That is not passive hedging. That is urgency.
The thesis is tight and time-boxed: Micron reports June 24, the put expires July 17. If Micron's fiscal Q3 result or guidance disappoints on a stock and ETF priced for perfection, the trade pays off. If Micron beats and the AI memory narrative stays intact, the buyer loses the full $8.5M.
Morningstar's warning that every DRAM holding is overvalued, 24/7 Wall St.'s analysis that two months of declining DDR5 prices precede 40–60% drawdowns, and the ETF's own ≈±31% 36-day implied move cone all say this pullback scenario is far from impossible. It's a real risk on a real timeline.
What to watch:
- 📅 June 24, 2026 — Micron Q3 Earnings: Revenue vs ≈$33.5B consensus, gross margin vs ≈81%, and 2027 order-book commentary. This is the binary.
- 📅 June/July TrendForce DDR5 print: Any rollover from the 58–63% QoQ surge would be the early warning siren.
- 📅 $60 gamma support: The first mechanical floor to watch. A close below $60 after Micron earnings would signal accelerating momentum toward $55.
- 📅 $65 gamma resistance: Where the put strike sits — also the mechanical ceiling. A failed rally back to $65 would be a bearish confirmation.
- ✅ OI Confirmed (2026-06-12): DRAM July-17 $65P OI rose 989 → 16,035 (Δ +15,046) — more bears piled in beyond our four prints. Position confirmed open.
- 📅 July 17, 2026: Put expiry — the final verdict.
If you already hold DRAM shares: The $65 gamma wall overhead and the massive new put open interest at that strike mean the $62–$65 range is likely to feel heavy going forward. The Micron earnings are the key risk event to size around. Consider whether you want to enter that binary with full exposure or take some off the table ahead of June 24.
If you're watching from the sidelines: The implied move cone ($43.72–$83.02 by July 17) tells you the market is pricing in a genuinely wide range of outcomes. The put buyer's breakeven of ≈$56.50 sits in the lower third of that cone — not an extreme outlier, but it requires a real catalyst to materialize in a compressed window. Watch the Micron print on June 24 before making a call either way.
If you're bullish on DRAM long-term: The AI memory demand story remains structurally real. The $60 gamma floor and $55 floor below it are the support levels that matter. As long as Micron doesn't guide down and TrendForce prices hold, the bull thesis stays intact — it's the near-term, parabolic valuation and binary earnings event that create the short-term vulnerability the put buyer is targeting.
≈$8.5M in net premium, targeting a near-term pullback on a +128% ETF, timed around a single binary event. Patient, deliberate, and urgently executed. The market answers on June 24.
Disclaimer: Options trading involves substantial risk of loss and is not suitable for all investors. This analysis is for educational and informational purposes only and does not constitute financial advice. Past unusual options activity does not guarantee future returns. The DRAM July-17 $65 puts analyzed here were purchased at ≈$8.50 per share; buyers of these contracts can lose the entire premium if DRAM closes above $65 at expiration on July 17, 2026. ETF holdings and weights drift daily — verify current weights at Roundhill's DRAM page before trading. Open/close classification was confirmed by next-day OPRA open interest data on 2026-06-12: OI rose 989 → 16,035 (Δ +15,046), confirming the position as a new open. This article reflects market conditions as of June 11, 2026 — always conduct your own due diligence.
Last updated: June 12, 2026