🌏 EEM: Massive $24M Institutional Exit - Someone's Getting Out Fast!
📅 September 16, 2025 | 🔥 Unprecedented Activity Detected
🎯 The Quick Take
Big money just dumped $24 MILLION worth of deep in-the-money EEM calls in two identical blocks - that's like watching the smart money rush for the exits before everyone else notices the fire alarm! 🚨 These aren't random trades; someone's systematically unwinding a massive bullish position after EEM's incredible +27% YTD rally, and they're doing it with military precision ahead of critical Q3 earnings from Taiwan Semi (October 15-17).
🏢 Company Overview
iShares MSCI Emerging Markets ETF (EEM) is the go-to vehicle for betting on developing economies, managing approximately $19.78 billion in assets. This ETF tracks the MSCI Emerging Markets Index, giving you exposure to 1,244 companies across the world's fastest-growing economies.
What Makes EEM Tick:
- 📊 Top Holdings: China (25.1%), Taiwan (19.2%), India (14.2%)
- 💰 Expense Ratio: 0.72%
- 🎯 Dividend Yield: 2.24%
- 📈 Current Price: $53.06 (near 52-week high of $52.67)
💰 The Option Flow Breakdown
📊 The Tape - What Actually Happened
| Time | Symbol | Side | Buy/Sell | Type | Expiration | Premium | Strike | Volume | OI | Size | Spot | Option Price |
|---|---|---|---|---|---|---|---|---|---|---|---|---|
| 14:38:24 | EEM | MID | SELL | CALL | 2025-10-17 | $12M | $45 | 15K | 5K | 15,000 | $53.06 | $8.25 |
| 14:38:24 | EEM | MID | SELL | CALL | 2025-09-19 | $12M | $45 | 15K | 17K | 15,000 | $53.06 | $8.05 |
Option Symbols Created:
- EEM20251017C45 (October expiration)
- EEM20250919C45 (September expiration - expires this week!)
🤓 What This Actually Means
Translation for us regular folks: Someone with DEEP pockets just cashed out $24 million in profits! 💸
Here's the kicker - these are deep in-the-money calls at $45 strike when EEM is trading at $53.06. That's $8+ of intrinsic value per contract! This isn't speculation; this is someone who was sitting on massive gains and decided NOW was the time to take the money and run.
🔥 Unusual Score: 10/10 VOLCANIC
- 1681x larger than average EEM option trade
- This literally NEVER happens - we found zero trades this size in the past 30 days
- Size comparison: This is hedge fund-level money, not your neighbor Bob! 🏢
📈 Chart Check-Up & Technical Levels
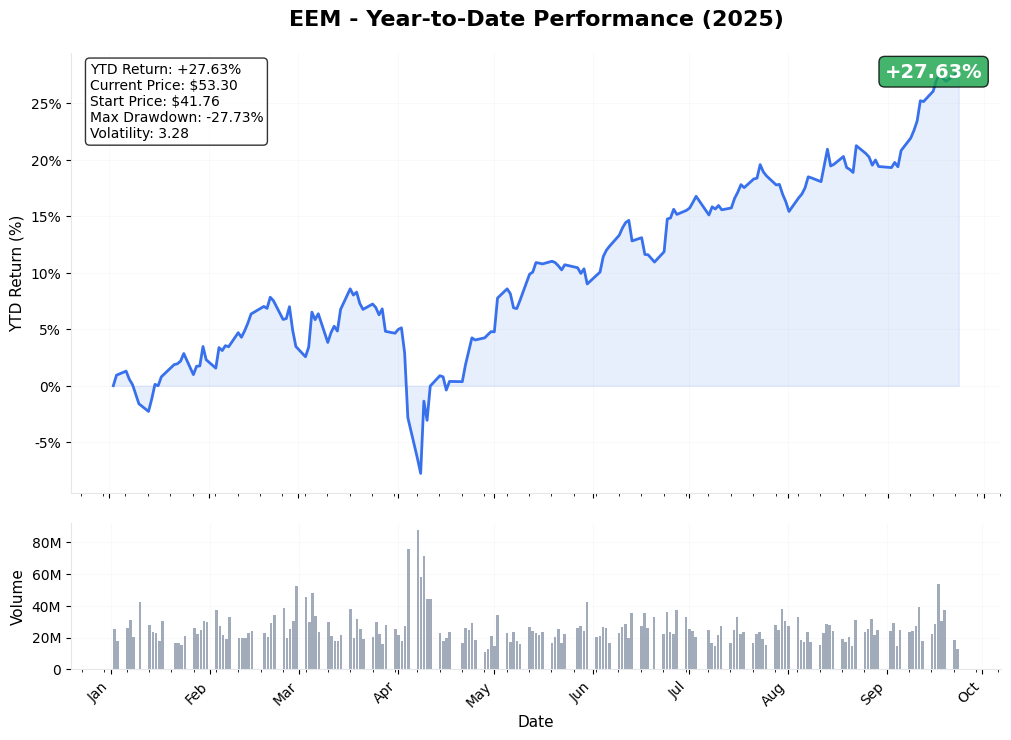
Looking at the YTD performance chart:
Key Technical Observations:
- 🚀 YTD Return: +26.99% (absolutely crushing it!)
- 📊 Current Price: $53.03
- 💪 52-Week Range: $41.76 - $53.06
- 📉 Max Drawdown: -27.36% (shows significant volatility)
- 🎢 Volatility: 3.10 (elevated but manageable)
Critical Levels to Watch:
- Resistance: $53.50 (psychological barrier + recent highs)
- Support #1: $50.00 (round number + previous consolidation)
- Support #2: $48.00 (20-day moving average zone)
- Major Support: $45.00 (the strike they're selling!)
🎪 Catalysts That Matter
📅 Upcoming Events (Mark Your Calendar!)
October 15-17, 2025: TSMC Q3 Earnings 🇹🇼
- Taiwan = 19.2% of EEM
- Q2 showed $30.07B revenue (+44.4% YoY)
- Beat estimates by $0.34 EPS
Q4 2025: China Stimulus Decisions 🇨🇳
✅ Recent Developments (Already Happened)
September 16, 2025: India Market Rally 🇮🇳
August 2025: China Economic Wobbles
- GDP growth 5.4% Q1 but momentum slowing
- Exports to US down 30% YoY (ouch!)
🎲 Price Targets & Probabilities
🚀 Bull Case: $58 (25% chance)
What Needs to Happen:
- TSMC crushes Q3 earnings (again)
- China announces surprise stimulus package
- Fed turns dovish, weakening dollar
- Saudi foreign investment continues surging (up 16% to SAR 3 trillion)
😐 Base Case: $50-52 (50% chance)
Most Likely Scenario:
- Consolidation after 27% rally
- Mixed China data continues
- TSMC meets but doesn't blow out expectations
- Brazil stays cheap at 6.7x P/E (43% discount to history)
😰 Bear Case: $45 (25% chance)
The Nightmare:
- China property crisis worsens
- Taiwan tensions escalate
- Dollar strength crushes EM currencies
- Global risk-off event triggers exodus
Plot twist: The institutions are selling $45 strikes - that's EXACTLY where they think support might break! 👀
💡 Trading Ideas for Every Risk Level
🛡️ Conservative: "Sleep Well Strategy"
Wait for the Dip & Buy Shares
- Let the big boys finish selling
- Buy EEM shares if it touches $50
- Set stop loss at $48
- Target: $55 by year-end
- Why it works: You're buying where institutions showed support, with defined risk
⚖️ Balanced: "Smart Money Copycat"
Sell Call Spreads (Just Like Them!)
- Sell EEM 11/15 $55 Call
- Buy EEM 11/15 $58 Call
- Collect ~$0.80 credit
- Max Profit: $80 per spread if EEM stays below $55
- Why it works: You're betting alongside the institutions that rally is capped
🚀 Aggressive: "YOLO With Training Wheels"
Buy Put Spreads for the Reversal
- Buy EEM 10/18 $52 Put
- Sell EEM 10/18 $48 Put
- Cost: ~$1.20 per spread
- Max Profit: $280 per spread if EEM hits $48
- Why it works: Limited risk, 230% potential return if selloff accelerates
⚠️ Risk Factors (The Scary Stuff)
Real talk - here's what could blow up any trade:
🚨 Immediate Risks:
- More institutional selling could trigger cascade
- TSMC earnings in 30 days could disappoint
- September options expiration Friday = extra volatility
⚡ Ongoing Concerns:
- US-China trade tensions getting worse
- Taiwan situation remains a powder keg
- Saudi mega-projects facing delays
💸 Market Structure:
- EEM has heavy concentration risk (60% in just 3 countries!)
- High expense ratio (0.72%) eats returns
- Dollar strength = EM weakness (inverse relationship)
🎯 The Bottom Line
Here's the deal: When institutions dump $24 MILLION in deep ITM calls after a 27% rally, they're not being subtle - they're telling you the easy money has been made! 🎪
This isn't panic selling; it's profit-taking with surgical precision. The fact they chose $45 strikes (exactly $8 below current price) suggests they think that's where real support lives.
Your Action Plan:
📌 If you own EEM: Consider taking some chips off the table above $52
📌 If you're watching: Set alerts for $50 (first support) and $48 (major support)
📌 If you're bearish: Those put spreads look juicy with TSMC earnings as catalyst
Mark your calendar for October 15-17 (TSMC earnings) - that's when the next big move happens!
Remember: When the smart money makes moves this big, they usually know something we don't... yet. Trade carefully! 💪
⚠️ Options trading involves substantial risk and is not suitable for all investors. Past performance doesn't guarantee future results. Always do your own research and consider your risk tolerance before trading.
📈 Trade Smart. Trade Informed. Trade Like the Big Boys.
Analysis based on unusual options activity detected September 16, 2025