🐋 EEM Whale Alert: $1.4M Bullish Bet on Emerging Markets Before Fed Decision!
📅 February 13, 2026 | 🔥 Unusual Activity Detected
🎯 The Quick Take
Someone just dropped $1.4 MILLION on weekly EEM calls expiring in just 7 days! This isn't your average retail trader testing the waters - this is institutional money making a concentrated bet that emerging markets continue their 2026 rally. With EEM already up 10.6% year-to-date and riding a wave of dollar weakness plus AI-fueled semiconductor demand, this whale is betting the party isn't over yet.
🏢 ETF Overview
What is EEM?
The iShares MSCI Emerging Markets ETF tracks large- and mid-cap equities across developing economies. Think of it as your one-stop shop for exposure to the fastest-growing economies on the planet.
| Metric | Value |
|---|---|
| AUM | $27.75B |
| Expense Ratio | 0.72% |
| 52-Week Range | $38.19 - $61.91 |
| YTD Return | +10.6% |
| 1-Year Total Return | +43.71% |
| Total Holdings | 1,245+ securities |
🌍 Top Holdings
| Rank | Company | Weight | Why It Matters |
|---|---|---|---|
| 1 | Taiwan Semiconductor (TSMC) | 10.96% | AI chip dominance |
| 2 | Tencent Holdings | 5.59% | China tech giant |
| 3 | Alibaba Group | 3.99% | E-commerce leader |
| 4 | Samsung Electronics | ~3% | Memory chip king |
| 5-10 | Various EM Blue Chips | ~12% | Diversified exposure |
🗺️ Country Exposure
| Country | Weight | Key Sectors |
|---|---|---|
| 🇨🇳 China | 33.12% | Tech, Consumer, Financials |
| 🇹🇼 Taiwan | 15.41% | Semiconductors |
| 🇮🇳 India | 12.54% | Financials, IT Services |
| 🇰🇷 South Korea | 12.07% | Memory Chips, Tech |
| Others | ~27% | Brazil, Mexico, Saudi Arabia |
📊 Sector Breakdown
- 🖥️ Technology: 23.7% (semiconductors driving returns)
- 🏦 Financials: Major allocation
- 🛍️ Consumer Discretionary: Significant weight
- ⛽ Energy: Notable exposure
💰 The Option Flow Breakdown
📊 What Just Happened
| Field | Details |
|---|---|
| Symbol | EEM |
| Date/Time | February 13, 2026 @ 10:46:16 ET |
| Option | EEM 2026-02-20 $58.5 Call |
| Action | BUY TO OPEN (New Position) |
| Strategy | Long Call (Weekly Expiration) |
| Size | 5,640 contracts |
| Premium Paid | $1.4M |
| Option Price | $2.41 per contract |
| Spot Price | $60.67 |
| Open Interest | 30,000 |
| Volume | 5,600 |
🤓 What This Actually Means
Translation for us regular folks: A whale just bought 5,640 call options on EEM, paying $2.41 each (that's $1.4M total!) betting the ETF stays above $58.50 by next Friday.
Here's the math that matters:
- 💵 Break-even: $60.91 (current price is $60.67 - needs just 0.4% move up!)
- 📈 Intrinsic Value: $2.17 (these calls are already in-the-money)
- ⏰ Time Premium: Only $0.24 per contract
- 🎯 Delta: Likely ~0.80+ (moves almost like stock)
Why weekly calls? This trader wants maximum leverage on an immediate move. They're paying mostly for intrinsic value with minimal time decay - a sign they expect EEM to rip higher NOW, not later.
The 30,000 open interest at this strike tells us there's already significant positioning here. Adding 5,640 contracts (nearly 19% of OI) is a statement trade.
📈 Technical Setup
YTD Performance
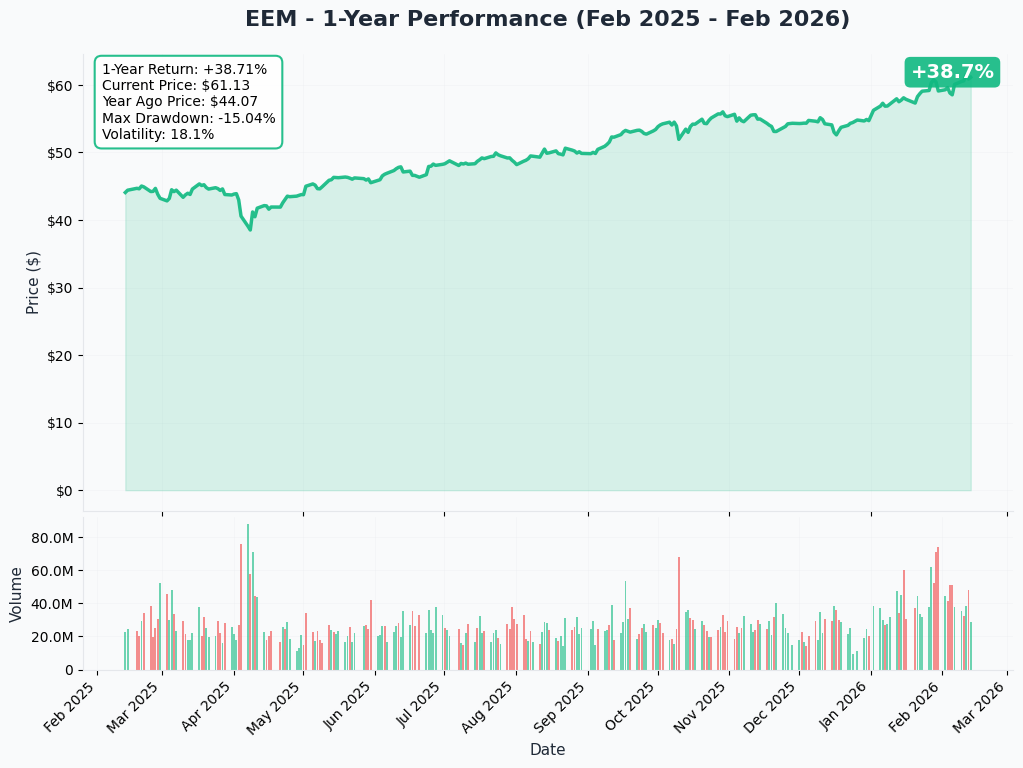
EEM has been on a tear in 2026! The ETF broke out to new 52-week highs, with the MSCI EM Index pushing past its 2021 highs. More than two-thirds of index components are trading above their 200-day moving averages - that's broad-based strength, not just a few names carrying the load.
📊 Key Technical Levels
| Level | Price | Significance |
|---|---|---|
| 🔴 52-Week High | $61.91 | Immediate resistance |
| 🟢 Current Price | $60.67 | Mid-range of recent move |
| 🔵 Whale Strike | $58.50 | Strong put support zone |
| 🟣 200-Day MA | ~$52 | Long-term trend support |
Gamma & Implied Move Analysis
Note: Gamma and implied move charts are currently unavailable due to ThetaData being offline. However, based on the option flow data:
- 📍 $58.50 Strike: Heavy call open interest suggests dealer short gamma here - this level likely acts as a magnet/support
- 📍 $60 Strike: Psychological level with typical options clustering
- 📍 $62.50-$65: Potential resistance zone if rally extends
🎪 Catalysts
✅ Recent Catalysts (Already Happened)
| Event | Date | Impact |
|---|---|---|
| TSMC Record Q4 Earnings | January 2026 | Profit jumped 35% on AI demand 📈 |
| China Stimulus Announcement | December 2025 | "Moderately loose" policy shift 🇨🇳 |
| Seoul Stocks Hit All-Time High | January 2026 | KOSPI surged past 4,600 🇰🇷 |
| Dollar Posts Sharpest Annual Decline | 2025 | 9.4% depreciation boosted EM 💵 |
| EEM New 52-Week High | February 11, 2026 | Bullish MACD signal line cross 📊 |
📅 Upcoming Catalysts
| Event | Expected Date | Potential Impact |
|---|---|---|
| Fed FOMC Meeting | March 18-19, 2026 | Rate cut decision - major dollar catalyst |
| China Two Sessions | March 2026 | Fiscal stimulus details, GDP target |
| TSMC Q1 Earnings | Mid-April 2026 | AI demand, 2nm ramp update |
| Samsung Q1 Earnings | Late April 2026 | Memory pricing, HBM shipments |
| India Budget Implementation | April 2026 | Tax cuts, Pay Commission effects |
The Setup: Morgan Stanley expects the dollar to continue weakening into mid-2026, with UBS calling weak dollar and high volatility "the dominant theme for 2026." Every Fed rate cut is another tailwind for EEM.
🎲 Price Targets & Probabilities
🐂 Bull Case: $65+ (Probability: 35%)
Target: $65 by end of Q1 2026
Why it could happen:
- Goldman Sachs projects MSCI China +20% by year-end
- TSMC guiding for ~30% revenue growth in 2026
- EM earnings growth expected at 21-29% vs 14% for U.S.
- Fed easing cycle pushing toward 3% policy rate
⚖️ Base Case: $60-$62 (Probability: 45%)
Target: Consolidation around current levels
Why this makes sense:
- Already up 10.6% YTD - some profit-taking natural
- Valuations at 40% discount to U.S. equities remain attractive but not screaming cheap
- China stimulus implementation takes time to show in earnings
🐻 Bear Case: $55-$58 (Probability: 20%)
Target: Pullback to key support levels
What could go wrong:
- Trump tariffs escalation - 50% on Brazil already announced for August
- Taiwan geopolitical tensions resurface
- Fed hawkish surprise if inflation reaccelerates
- China private sector confidence fails to improve
💡 Trading Ideas
🛡️ Conservative: "The Dividend Collector"
Strategy: Buy EEM shares on pullback to $58-$59
- Entry: $58.50-$59.00 (near whale's strike)
- Stop Loss: $55.00 (-6%)
- Target: $65.00 (+10%)
- Risk/Reward: 1:1.7
Why this works: You're buying what the whale is betting on, but with no time decay. If EEM pulls back, you get a better entry. If it keeps running, you participate in the move.
⚖️ Balanced: "Follow the Whale"
Strategy: Buy EEM March 2026 $60 Calls
- Entry: ~$2.50-$3.00 per contract
- Max Risk: Premium paid
- Break-even: ~$62.50-$63.00
- Target: $5.00+ if EEM hits $65
Why this works: Gives you more time than the weekly (5 weeks vs 1 week) while still capturing the Fed meeting catalyst in March. The $60 strike is at-the-money for direct delta exposure.
🚀 Aggressive: "The YOLO Express"
Strategy: Bull Call Spread - Buy $60 Call / Sell $63 Call (Feb 20 expiry)
- Entry: ~$1.50 net debit
- Max Risk: $1.50 per spread
- Max Profit: $1.50 (100% return) if EEM closes above $63
- Break-even: $61.50
Why this works: You're playing for a continuation move this week. The spread reduces your cost basis while capping gains. If EEM breaks to new highs, you double your money. If not, your loss is defined.
⚠️ Risk Factors
🌐 Geopolitical Risks
- Taiwan Strait tensions: TIME rates this as a top 10 global risk for 2026. Taiwan produces >90% of advanced chips. Any escalation would be catastrophic for EEM.
- China + Taiwan = 48% of EEM: Cross-strait relations are the single biggest tail risk
💰 Trade Policy Risks
- Trump tariffs on Brazil (50% effective August 2026) could spread to other EM
- China tariff escalation would hit 33% of the portfolio directly
- Supply chain rerouting accusations (Vietnam, Malaysia at risk)
📊 Concentration Risks
- TSMC alone is 11% of the ETF
- Top 10 holdings = 30%+ of assets
- Samsung + SK Hynix = 52% of KOSPI profits - semiconductor downturn would hurt
🏠 China-Specific Risks
- Weak private sector confidence persists
- Property market overhang still unresolved
- Stimulus implementation may disappoint vs expectations
⏰ Time Decay Risk (For This Trade)
- Weekly expiration = extreme time decay pressure
- Theta burn accelerates into Friday
- Any sideways action kills the trade
🎯 The Bottom Line
Real talk: This $1.4M whale bet is a high-conviction play that emerging markets continue their 2026 momentum. With EEM up 10.6% YTD, trading at a 40% discount to U.S. equities, and benefiting from continued dollar weakness, the fundamental case is solid.
The whale's edge: They bought in-the-money calls with minimal time premium - a smart way to get leveraged exposure without paying for excessive extrinsic value. The $58.50 strike provides a cushion of $2.17 in intrinsic value.
📋 Action Plan
If you're bullish on EM:
- Consider the March calls for more time runway
- Use the whale's $58.50 strike as your mental stop level
- Watch the dollar index (DXY) - continued weakness = green light
If you're watching from the sidelines:
- Wait for a pullback to the $58-$59 zone
- Monitor the Fed's March meeting for confirmation of easing cycle
- Keep an eye on China stimulus implementation
If you're bearish:
- The $55 level is your line in the sand
- Consider put spreads rather than naked puts (IV is elevated)
- Watch for tariff escalation headlines
Mark your calendar: Fed FOMC on March 18-19 is the next major catalyst. That meeting could either fuel another leg higher or trigger profit-taking if the Fed signals a pause.
⚠️ Disclaimer
This analysis is for informational purposes only and should not be considered investment advice. Options trading involves significant risk, and you can lose your entire investment. The unusual options activity discussed represents observed market data and does not guarantee future price movements. Past performance does not indicate future results. Always conduct your own research and consider consulting with a financial advisor before making investment decisions.
📊 Data sourced from market feeds as of February 13, 2026