🛡️ EEM - $3.4M Dual Put Hedge as Smart Money Braces for Emerging Market Turbulence!
📅 March 19, 2026 | 🔥 Unusual Activity Detected
🎯 The Quick Take
Someone just loaded up $3.4 MILLION in puts on EEM - simultaneously buying two different strike puts on the same April 17 expiration, creating a layered downside protection play. With the Iran war squeezing EM economies through the Hormuz blockade, oil above $110/bbl, and the Fed staying hawkish yesterday after its March 18 rate hold, this big player is paying serious premium to hedge against an EM selloff in the next 29 days. Translation: institutional money just bought a $3.4M insurance policy on emerging markets.
📊 ETF Overview
iShares MSCI Emerging Markets ETF (EEM) is one of the most traded EM ETFs on the planet, offering broad exposure to large and mid-cap companies across emerging market economies:
- AUM: $28.2B
- Exchange: NYSE Arca
- Type: ETF (iShares / BlackRock)
- Expense Ratio: 0.72%
- Dividend Yield: 2.08%
- Total Holdings: 1,282 positions
- YTD 2026 Return: +4.7% to +7.0% (after a blockbuster +33.3% in 2025)
- Top Geographic Weights: China (~25%), Taiwan (~18%), India (~17%), South Korea (~12%), Brazil (~5%)
- Top Holdings Driving Performance: TSMC at 13.43% is the single biggest influence, followed by Samsung (5.13%), SK hynix (2.92%), Tencent (3.85%), and Alibaba (2.66%)
EEM is the go-to instrument for institutional players who want liquid options exposure to EM — its options market is deep, making it the preferred vehicle for hedging EM macro risk rather than individual country ETFs.
💰 The Option Flow Breakdown
📊 The Tape - March 19, 2026
| Time | Symbol | Side | Buy/Sell | Type | Strike | Expiration | Size | Premium | Spot | Option Price |
|---|---|---|---|---|---|---|---|---|---|---|
| 14:34:42 | EEM | MID | BUY | PUT $53 | $53 | 2026-04-17 | 27,200 | $1.6M | $57.01 | $0.59 |
| 14:34:42 | EEM | MID | BUY | PUT $56 | $56 | 2026-04-17 | 13,600 | $1.8M | $57.01 | $1.36 |
Combined: $3.4M total premium | Both legs executed simultaneously at 14:34:42 | Both classified as EXTREMELY UNUSUAL z-scores
🤓 What This Actually Means
This is a defensive hedging position - not a random speculative bet. Here's the breakdown:
- 🐋 Two-strike approach: The trader bought the $56 put (near-the-money, only 1.8% OTM) AND the $53 put (deeper OTM, ~7% below spot) at the EXACT same time. This layered structure gives them immediate protection if EEM starts sliding, plus deeper coverage if it really falls apart.
- 💸 Volume vs. OI tells the story: The $53 put had 27,000 contracts traded against only 21,000 open interest (z-score: 8.6x) — this is almost certainly fresh positioning, not a close. The $56 put: 17,000 volume vs 42,000 OI (z-score: 3.8x) — still well above normal. Both are flagged EXTREMELY UNUSUAL — we see z-scores this high maybe a handful of times in a given quarter.
- 📅 April 17 expiration is no accident: That's the same week TSMC (EEM's biggest holding at 13.43%) is expected to report Q1 2026 earnings. A major TSMC miss would dent EEM significantly. The puts expire right in the thick of earnings season for EEM's top holdings.
- 🏦 Not a retail play: Executing 40,800 total contracts ($3.4M premium) simultaneously at two different strikes at the mid price is institutional-grade execution. Definitely not your neighbor Bob on Robinhood.
What's really happening here: Someone with a large EEM position - or a portfolio heavily exposed to EM equities - decided today was the day to buy insurance. With the Iran war pushing oil toward $110/bbl+ and the Fed signaling only one cut for the rest of 2026, this trader is betting that if EEM breaks below $56, it could slide fast to the $53 range. The dual-put structure means they profit most in a 5-10% drawdown scenario over the next 29 days.
📈 Technical Setup / Chart Check-Up
YTD Performance Chart
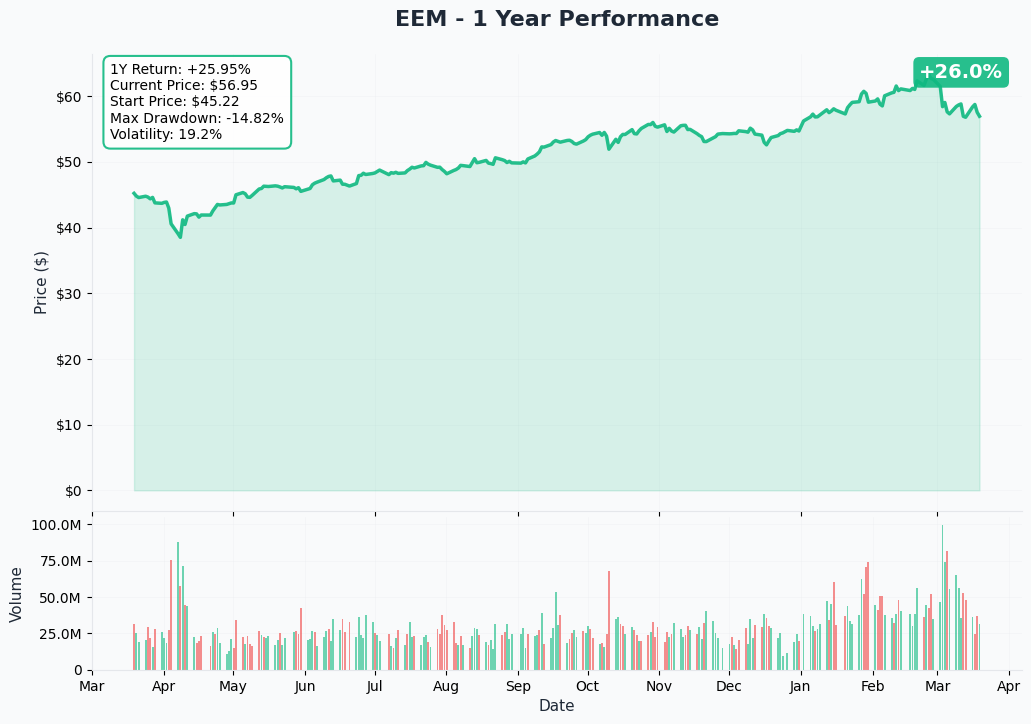
EEM has had a solid run in 2026, building on its outstanding +33.3% return in 2025 — the best relative year for EM equities since 2009. The ETF is currently trading around $57.01 after pulling back from higher levels earlier in the year. Key observations:
- 📊 January surge: Record $19B in EM ETF inflows in January, with EEM alone absorbing $4B+, drove prices higher
- 📉 Iran war headwind: The Strait of Hormuz blockade starting February 28 capped the upside and introduced a persistent overhang for energy-importing EM economies
- 🎢 Choppy consolidation: EEM has been trading in a tight range as bulls (cheap EM valuations, China stimulus) wrestle with bears (oil shock, hawkish Fed, tariff uncertainty)
- 📈 TSMC-driven support: The strong AI chip revenue story at TSMC (+80% over 1 year, +38% Q1 guidance YoY) has kept EEM from selling off more aggressively
Gamma-Based Support & Resistance Analysis
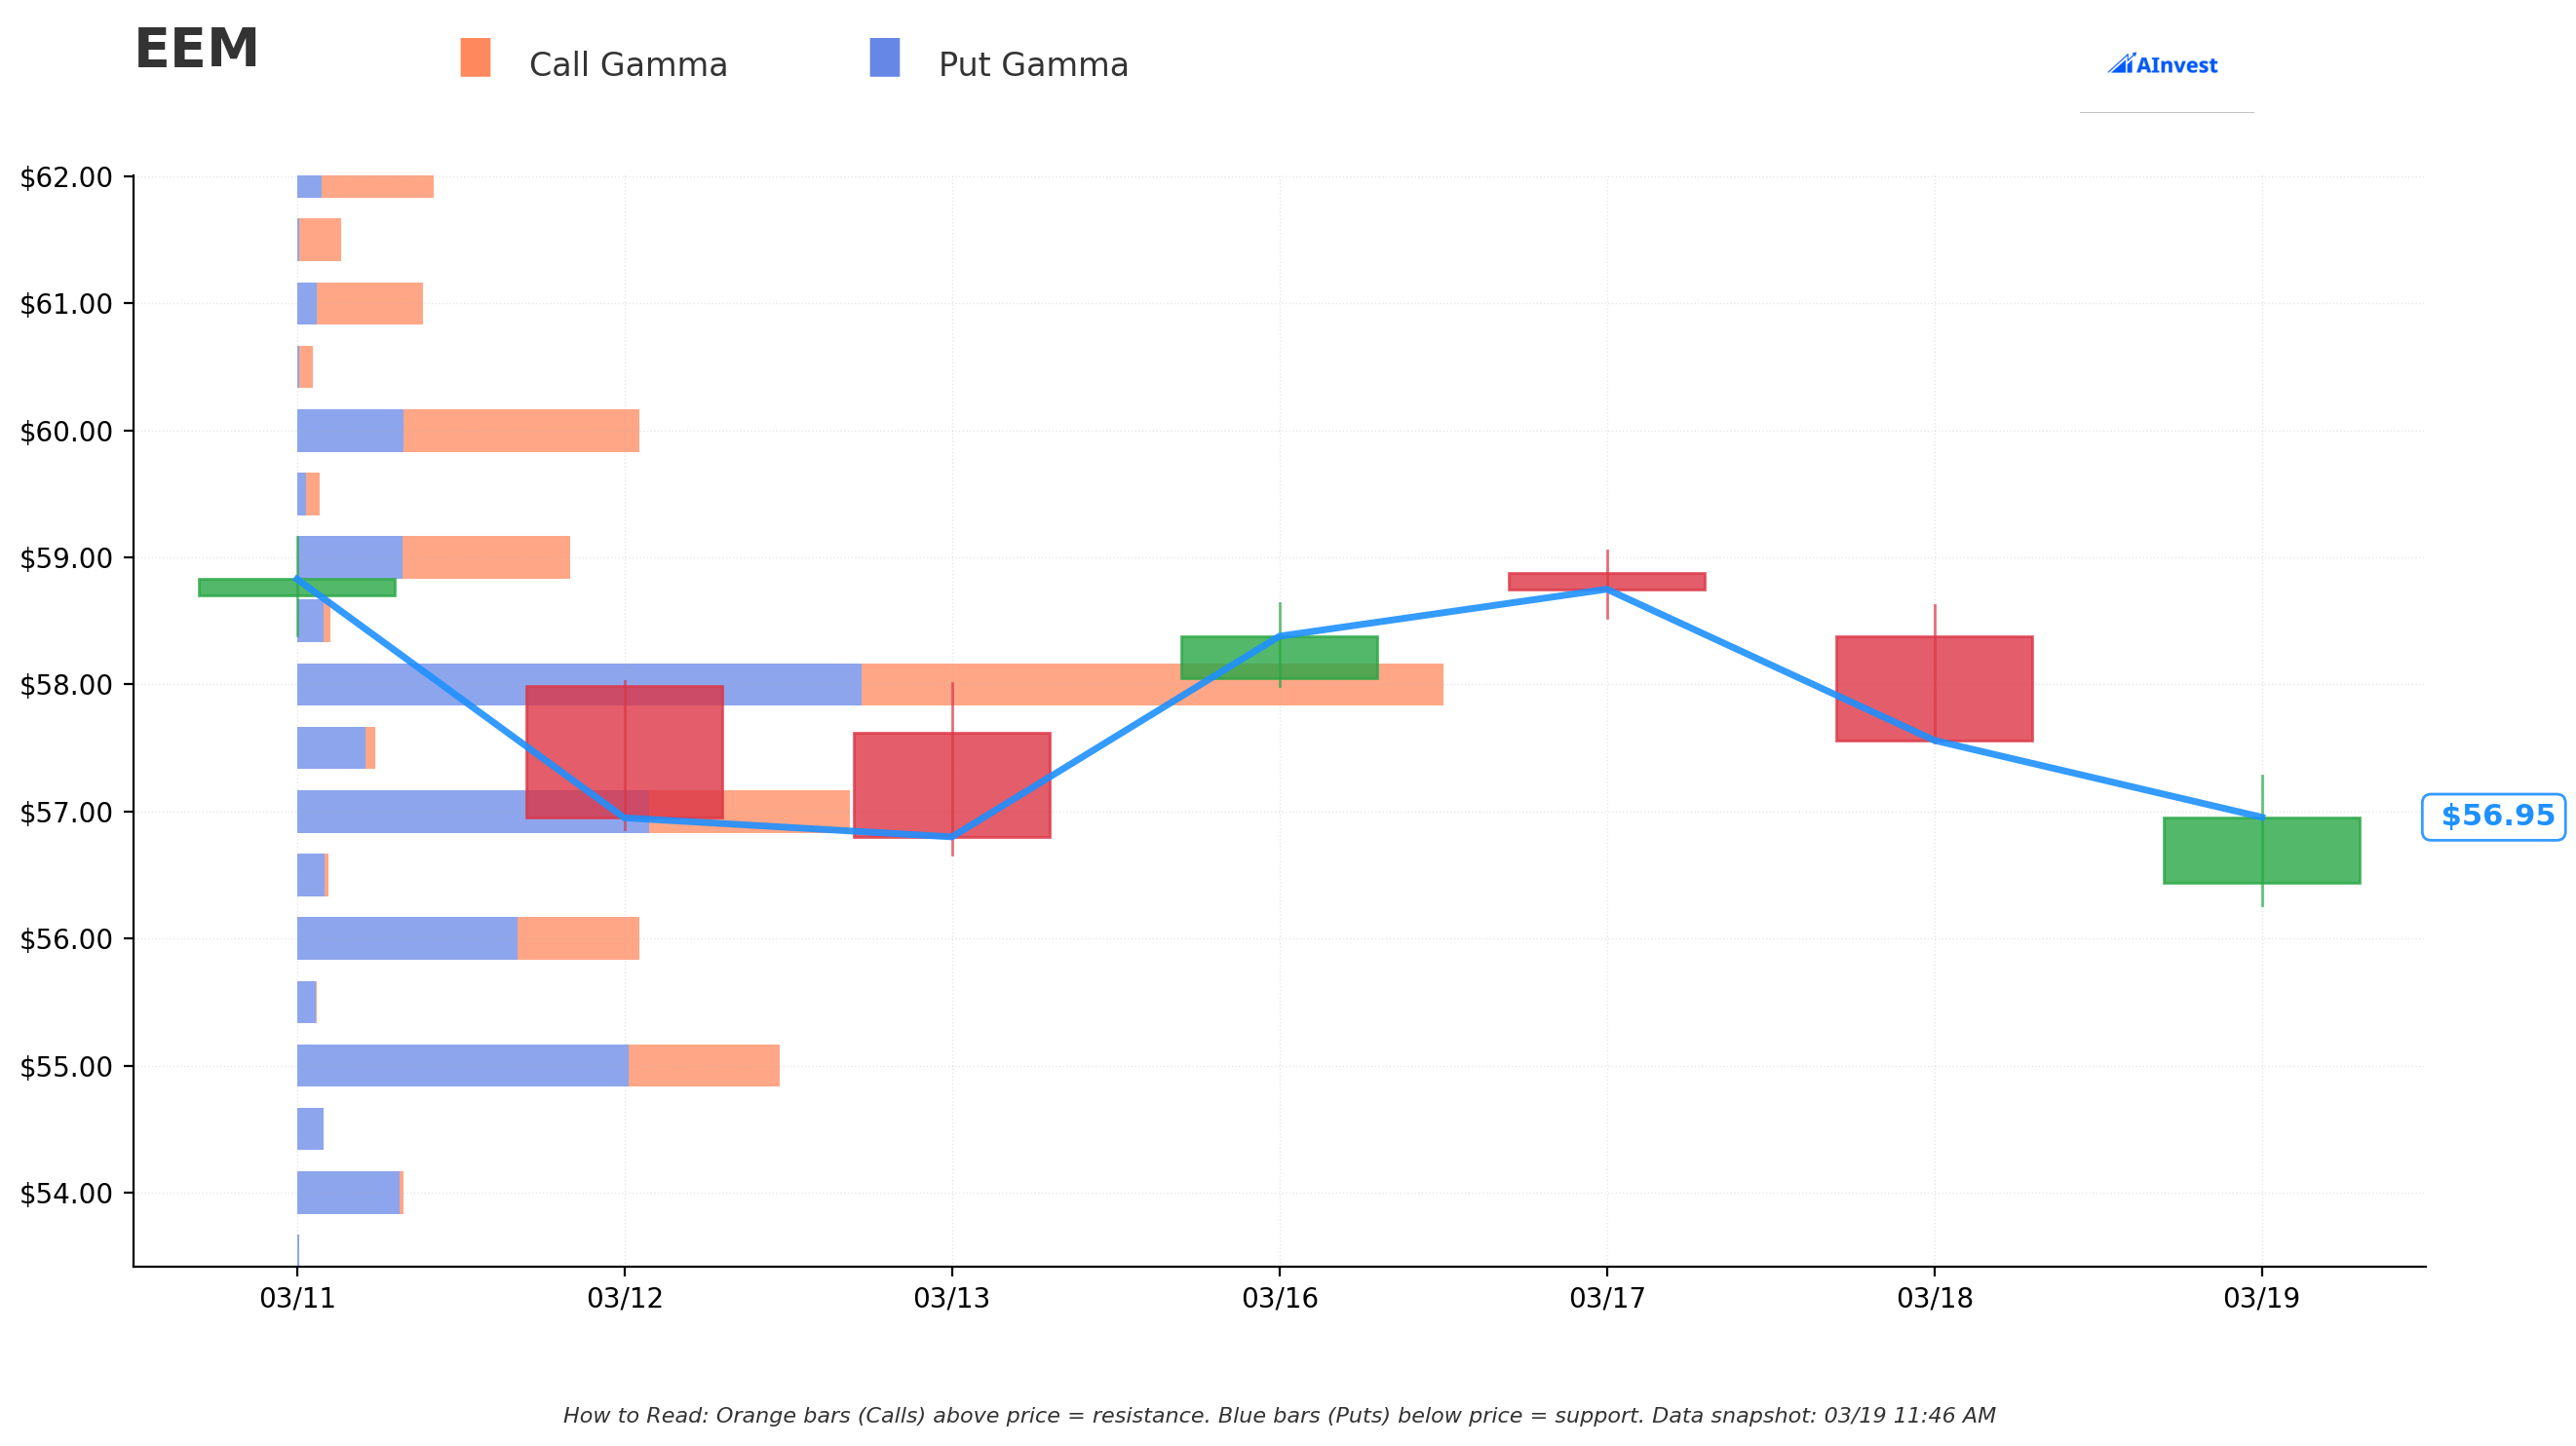
Current Price: $57.00 | Net GEX Bias: Bearish
The gamma exposure data shows clear price magnets and barriers that help explain where EEM is likely to gravitate near-term:
🔵 Support Levels (Put Gamma Below Price):
- $56 - Strongest nearby support with 130.5 total GEX (net: -36.5, meaning put-heavy) — the gamma wall where this trade's near-the-money put leg is struck. Dealers will actively buy if price tests here.
- $55 - Second support with 184.1 total GEX (net: -69.3) — this is the LARGEST total gamma level in the support zone. Market makers will be very active defending this level.
- $50 - Deep support with 67.3 total GEX at 12.3% below current price — a disaster scenario floor.
🟠 Resistance Levels (Call Gamma Above Price):
- $58 - Immediate and STRONGEST resistance at 447.1 total GEX — this is the single largest gamma level in the entire structure. EEM rallies will face heavy selling pressure here. Getting through $58 would be a meaningful breakout.
- $59 - Secondary resistance at 114.9 total GEX (3.5% above spot)
- $60 - Third resistance at 131.7 total GEX with net bullish tilt — 5.3% above current price
- $65 - Extended upside target at 96.2 total GEX, 14% above spot
What this means for traders: EEM is sandwiched between the massive $58 resistance wall (447 GEX — dealers sell rallies hard into this) and the solid $55-$56 support zone. The net GEX bias is Bearish, meaning the overall options positioning is more heavily weighted toward put protection. This is consistent with what we're seeing in today's trade — institutional players are leaning defensive. The $56 put strike is not random: it sits right at the first major put gamma support level.
Implied Move Analysis
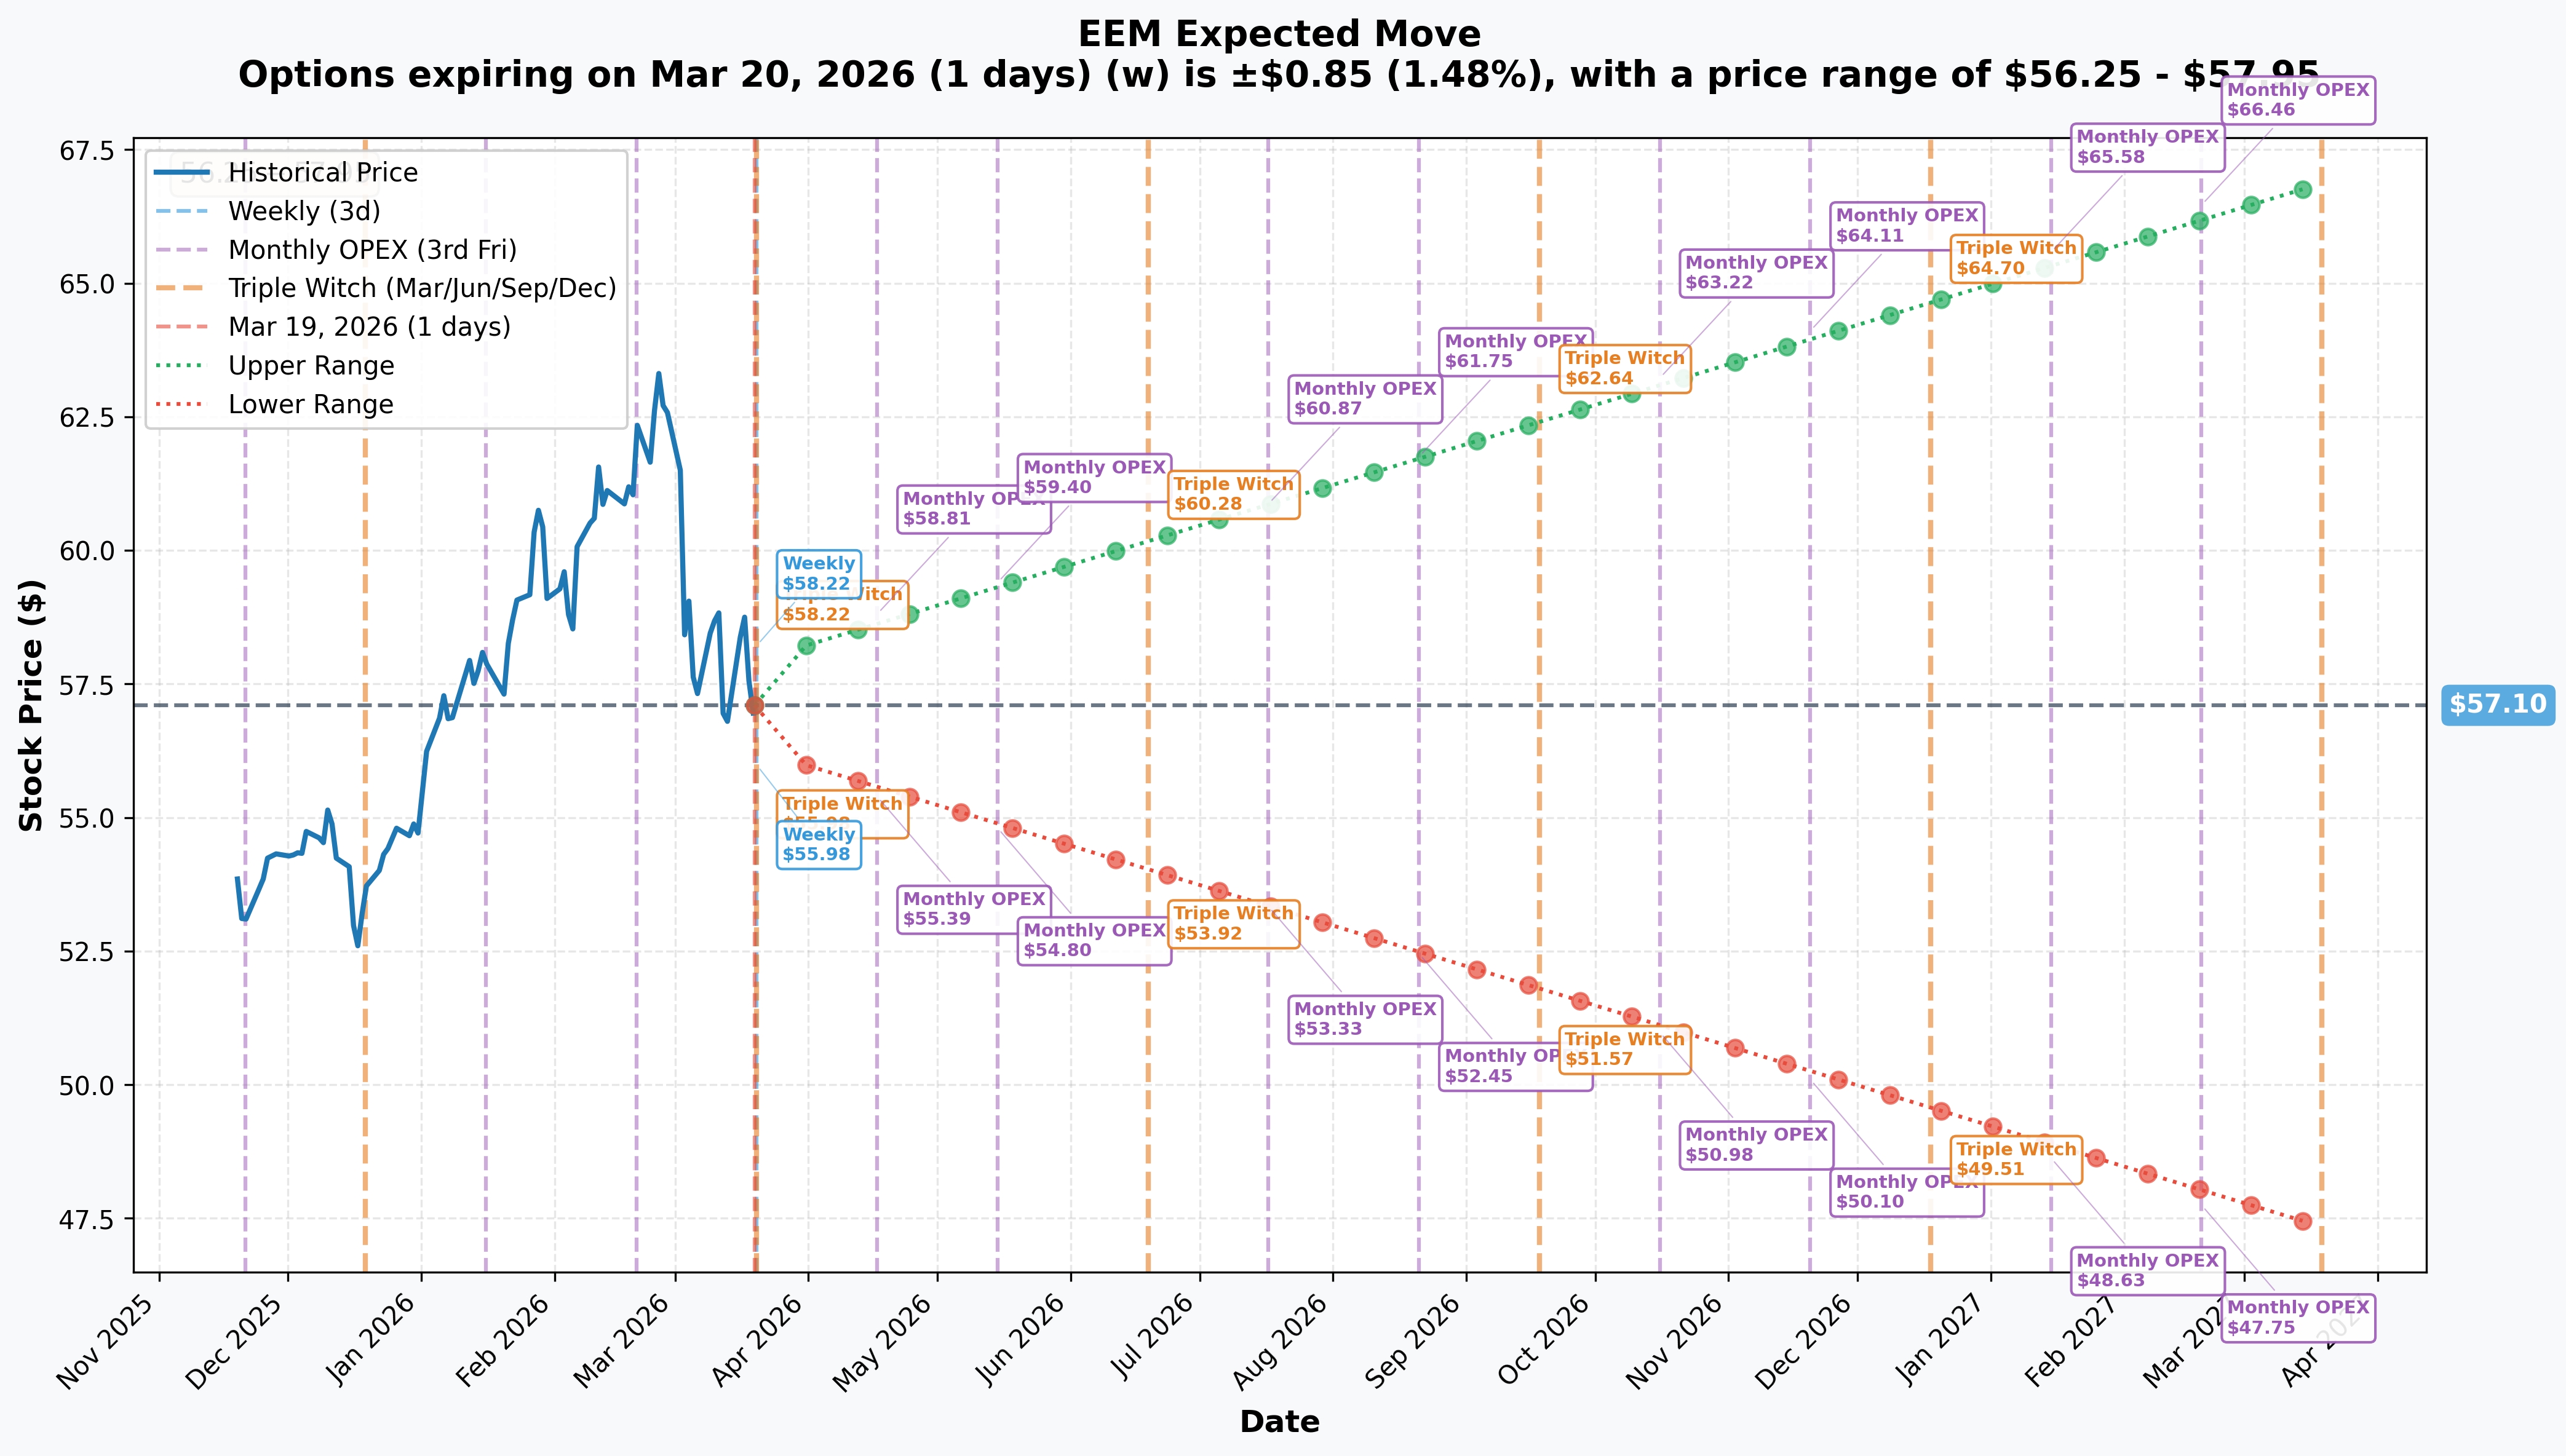
Options market pricing for upcoming expirations:
- 📅 Weekly/Triple Witch (March 20 - TOMORROW): ±$0.85 (±1.5%) → Range: $56.25 - $57.95
- 📅 April OPEX (April 17 - 29 days - THIS TRADE!): ±$1.71 (±3.0%) → Range: $55.39 - $58.81
- 📅 May OPEX (May 15 - 57 days): ±$2.30 (±4.0%) → Range: $54.80 - $59.40
- 📅 June Triple Witch (June 19 - 92 days): ±$3.18 (±5.6%) → Range: $53.92 - $60.28
- 📅 July OPEX (July 17 - 120 days): ±$3.77 (±6.6%) → Range: $53.33 - $60.87
- 📅 LEAPS (March 19, 2027 - 365 days): ±$9.78 (±17.1%) → Range: $47.33 - $66.88
Translation for regular folks: The options market is pricing a 3% move by April 17 — that's the expiration window this $3.4M trade covers. That $3% window puts the lower implied move boundary at $55.39, just above the $55 gamma support. Here's what's interesting: the $53 put is priced at $0.59, which means the market thinks a drop to $53 is a real but low-probability event by April 17 — but not impossible. The June implied range extends all the way to $53.92 on the downside, which tells you the market sees growing tail risk the further out you go.
Key insight: The put buyer is positioning for a move that is LARGER than what the options market currently implies for April. They're essentially betting the Hormuz situation, upcoming EM earnings season, or Fed hawkishness catalyzes a move beyond the $55-56 gamma support.
🎪 Catalysts
🔥 Active Catalysts (Happening Now)
Iran War & Strait of Hormuz Blockade (Feb 28 - Present) 🛢️
The dominant macro risk for EEM right now. U.S. and Israeli airstrikes against Iran began February 28, triggering an Iranian blockade of the Strait of Hormuz — the passage for roughly 20% of global seaborne oil trade.
- 🛢️ Brent crude surged from ~$70 to over $126/bbl at peak, now above $110/bbl — first time above $100 in four years
- 🚢 At least 15 tankers targeted since Feb 28, severely disrupting oil and LNG flows
- 🇨🇳 China's oil imports via the Strait collapsed from 5.35M to ~1.22M bbl/day — a massive supply shock for EEM's largest country allocation
- 🇮🇳 ~60% of India's oil imports come from the Middle East — India is highly exposed
- 📉 J.P. Morgan estimates sustained elevated Brent could depress global GDP by 0.6% annualized in H1 2026
- 🇰🇷 CNBC flagged South Korea's concentrated energy import dependency as a specific EM risk
Federal Reserve March 18 Hawkish Hold 🏦
The Fed held rates steady at 3.50-3.75% yesterday and dialed back easing expectations sharply.
- 📊 Only one 25bp cut projected for the rest of 2026 — down from prior multi-cut expectations
- ⛽ Energy-driven inflation from the Iran war is threatening to keep CPI above the 2% target
- 💵 The DXY has fallen to a 4-year low below 97.0, which provides partial relief to EM currencies — but persistent U.S. rates remain a drag on dollar-denominated EM debt
Section 122 Tariff Uncertainty 📋
After the Supreme Court struck down IEEPA tariffs on February 20, the administration quickly replaced them with a 10% (now 15%) "temporary import surcharge" under Section 122, which expires July 24, 2026. Congress must act. The outcome matters significantly for EM export competitiveness to the U.S.
🚀 Upcoming Catalysts (Next 1-3 Months)
Tencent & Alibaba Q4 2025 Earnings - Late March 2026 📱
Both report in late March 2026 — combined ~6.5% of EEM weight. Tencent has been on a roll (gaming +23% YoY) and Alibaba's cloud is growing at 34% YoY. Good prints could boost EEM; any miss or guidance cut in the current oil-shock environment would weigh.
TSMC Q1 2026 Earnings - ~April 17, 2026 💻
The SINGLE most important catalyst for EEM in this timeframe — and the expiration date for this put trade. TSMC (13.43% of EEM) guided for +38% YoY revenue growth in Q1. February revenue came in at NT$317.66B (+22.2% YoY). AI chip revenue expected to grow at 60% CAGR through 2029. A beat here would be a major tailwind for EEM. A miss — or any commentary about Hormuz disruptions impacting their supply chains — would accelerate the downside these puts are positioned for.
Samsung Q1 2026 Earnings - Late April 2026 🔬
Samsung (5.13% of EEM) is spending $73.3B on CapEx and R&D in 2026. With Nvidia now manufacturing chips through Samsung, the AI memory angle is real. Combined with SK hynix (2.92%), the semiconductor theme accounts for over 20% of EEM.
Section 122 Tariff Expiration - July 24, 2026 ⚖️
The 150-day temporary tariff lapses on this date without Congressional action. Three paths: tariffs extended, modified down, or lapsed entirely. A lapse would be a significant positive catalyst for EM — and the market is not fully pricing this in yet.
Iran War Resolution / Ceasefire (Unknown Timing) 🕊️
A Hormuz ceasefire or partial reopening would likely trigger a sharp EM rally, particularly for energy-importing nations that dominate EEM. This is the single biggest upside wildcard between now and the April 17 expiration.
🎲 Price Targets & Probabilities
Using gamma levels, implied move ranges, and the current catalyst environment, here are the three scenarios through April 17, 2026 expiration:
📈 Bull Case (30% probability)
Target: $58 - $60
How we get there:
- 🕊️ Hormuz ceasefire news or meaningful re-opening reduces oil price shock
- 🇨🇳 China stimulus measures gain traction; GDP trajectory stabilizes above 4.5%
- 📱 Tencent and Alibaba late-March earnings beat on gaming and cloud growth, boosting China tech sentiment
- 💵 DXY continues falling below 97, providing EM currency relief
- 📊 TSMC pre-announces strong March revenue ahead of April 17 earnings
- 🟠 Gamma resistance at $58 caps initial move — need a genuine catalyst to punch through toward $59-$60
The puts expire nearly worthless. But the trader already knew this was portfolio insurance, not a lottery ticket.
Put P&L in Bull Case:
- $56 puts: lose most of the $1.36 paid (stock stays above $56)
- $53 puts: expire worthless (lose $0.59)
- Total loss: ~$3.4M (100% of premium) — the cost of insurance
🎯 Base Case (45% probability)
Target: $54 - $57 (Range-Bound Grind)
Most likely scenario:
- ✅ Iran situation stays in current stalemate — no escalation, no ceasefire, oil stays $95-115/bbl
- 📊 MSCI EM's 14x forward P/E valuation provides a floor (EM is still cheap vs. DM)
- 📈 Tencent/Alibaba earnings are fine but not spectacular given macro headwinds
- 💤 EEM trades between $55 gamma support and $58 gamma resistance in a choppy range
- 🎢 Tomorrow's quarterly triple witch (March 20 OPEX) creates short-term pinning near $57
- 📊 $19B January inflows provide demand support on dips
Put P&L in Base Case:
- EEM drifts to $55-$56 by April 17 → $56 puts worth $0-$1.00 (partial recovery)
- $53 puts expire worthless at $55+
- Net result: Partial loss on the total $3.4M position
📉 Bear Case (25% probability)
Target: $51 - $54 (Test the Put Strikes!)
What could go wrong:
- 😰 Iran war escalates — additional tanker attacks, SPR releases fail, Brent pushes toward $130/bbl
- 🇨🇳 China GDP trajectory falls below 3% as Hormuz closure chokes oil imports
- 📊 TSMC April 17 earnings disappoint or cuts guidance due to supply chain disruption — biggest single risk to EEM
- 🇮🇳 India current account crisis emerges from 60% Middle East oil dependency
- 💸 Fed forced to raise rates rather than cut (inflation breakout from energy) — EM currencies under pressure
- ⚖️ Section 122 tariff clarity turns out worse than expected for EM exporters
- 📉 Break below $56 gamma support triggers cascade — $55 gamma (184 GEX) the next key stop, then $53 area
Critical support levels:
- 🛡️ $56: First gamma defense (130.5 GEX) — this is where the near-the-money put kicks in
- 🛡️ $55: Strongest put gamma wall (184.1 GEX) — dealers buy aggressively here
- 🛡️ $53: Deeper OTM put strike — in play if $55 fails
Put P&L in Bear Case:
- EEM drops to $54 by April 17: $56 puts worth $2.00 (+$0.64/contract), $53 puts worth ~$0.15 (small recovery)
- EEM drops to $51 by April 17: $56 puts worth $5.00 (+$3.64/contract), $53 puts worth $2.00 (+$1.41/contract) — this is where the trade really pays off
- EEM drops to $48: Both puts deep ITM, combined position worth ~$12M+ on a $3.4M outlay
💡 Trading Ideas
🛡️ Conservative: Let It Breathe and Watch the $56 Level
Play: No new position yet — let tomorrow's triple witch (March 20) clear first, then watch $56 as your signal.
Why this works:
- 🎢 Tomorrow is quarterly options expiration — prices often "pin" near major strikes during OPEX, making moves less reliable
- 👀 If EEM closes above $57 post-OPEX with no Iran escalation news, the bull case gets more credible and puts get cheaper
- 📊 If EEM tests $56 and bounces with volume, you have confirmed support and a better entry for a directional play either way
- 🏦 Watching how institutional flows develop after the $3.4M put position was established gives you information for free
Action plan:
- Set a price alert at $56.00 and $58.00
- Monitor Iran ceasefire news daily — that's the single biggest swing factor
- Watch for TSMC and Samsung April earnings previews — analyst commentary in late March sets the tone
Risk level: Zero (observing) | Skill level: Beginner-friendly
⚖️ Balanced: Copy the Smart Money with a Put Spread ("The Layered Hedge")
Play: Buy the April 17 $56/$53 put spread on EEM — same strikes as the institutional trade, defined risk structure.
Structure: Buy $56 puts, Sell $53 puts — April 17, 2026 expiration
Why this works:
- 🤝 You're essentially replicating the institutional structure at retail scale with defined, capped risk
- 💰 Selling the $53 put against your $56 put purchase offsets a chunk of your premium cost
- 🎯 Maximum profit if EEM is at or below $53 by April 17 — captures the $3/spread range
- 📊 Breakeven roughly at $55.20-$55.50 (depending on mid-prices you get filled)
- ⏰ 29 days is enough time for a catalyst (good or bad on Hormuz/TSMC) to move EEM
Estimated P&L per spread (indicative):
- 💰 Net debit: ~$0.70-0.80 per spread ($70-80 per contract)
- 📈 Max profit: $3.00 per spread ($300 per contract) if EEM below $53 at expiration
- 📉 Max loss: $0.70-0.80 per spread (your entire debit) if EEM above $56 at expiration
- 🎯 Breakeven: ~$55.20-55.30
Position sizing: 2-5% of portfolio max. This is directional speculation, not a core holding.
Risk level: Moderate (defined risk, bearish directional) | Skill level: Intermediate
🚀 Aggressive: Buy the $53 Put Outright ("The Disaster Insurance Play")
Play: Buy the April 17 $53 puts outright — the deeper OTM leg that the whale just bought 27,200 contracts of.
Why this could work:
- 💥 Cheap at ~$0.59 — you're paying lottery-ticket prices for a genuine macro tail risk scenario (Iran war escalation)
- 🛢️ If Hormuz stays closed and oil pushes toward $130/bbl, EM equities could fall 8-12% fast — putting $53 well in play
- 🎰 Maximum asymmetry: risk $0.59, potential $3-5+ if EEM really falls apart
- 📅 The institutional trader bought this exact strike in the same expiry — they know something about the risk landscape
- 🐋 When 27,000 contracts of the same OTM put get bought at once, that's worth paying attention to
Why this could blow up:
- ⏰ Time decay is relentless: At $0.59 with 29 days left, theta eats ~$0.02/day if EEM stays flat
- 😱 Geopolitical timing is unknowable: A ceasefire tomorrow sends this to zero fast
- 📊 Market is only pricing a 3% implied move for April — $53 requires a 7% drop from $57
- 💸 If EEM stays rangebound between $55-$57 through expiration, you lose 100% of premium
Estimated P&L:
- 💰 Cost: ~$0.59 per contract ($59 per contract)
- 📈 Break-even: ~$52.41 at expiration (need >7.7% drop from $57)
- 🚀 EEM at $50 by April 17: puts worth $3.00 → 5x your money
- 💀 EEM stays at $55+ by April 17: entire premium gone
IMPORTANT WARNING: This is a low-probability, high-reward lottery ticket. Only deploy capital you can afford to lose entirely. This works maybe 1 in 4 times — which is exactly why the whale also bought the $56 puts (higher probability protection) alongside this.
Risk level: AGGRESSIVE (can lose 100% of premium) | Skill level: Advanced
⚠️ Risk Factors
What could go wrong — on both sides:
-
🛢️ Iran war is the wildcard that breaks every model: A ceasefire sends EEM sharply higher and puts worthless. An escalation (mine strikes, carrier group incidents, IRGC proxies attacking Saudi facilities) sends oil to $140+ and EEM potentially down 15-20%. Nobody knows which way this goes — that's the point.
-
🇨🇳 China's 25% weight is a double-edged sword: China is EEM's biggest exposure. Oil imports via Hormuz have collapsed from 5.35M to 1.22M bbl/day — that's a manufacturing and growth drag. But China's "moderately accommodative" monetary pivot and fiscal deficit at 4% of GDP provide a policy floor. Which force wins by April 17?
-
💻 TSMC is EEM's crown jewel — and the April 17 timing is intentional: At 13.43% weight, TSMC's Q1 2026 earnings (expected around April 17) can swing EEM ±2-3% on their own. A beat confirms the bull case; a miss or conservative guidance on Hormuz supply chain exposure could break the $55-56 support.
-
📉 Gamma resistance at $58 is a real ceiling: The 447 GEX at $58 is by far the largest gamma level in the structure. EEM has to fight through massive dealer selling to break upward. That keeps the upside capped near-term even in a positive scenario.
-
🏦 The Fed just signaled higher for longer: Only one cut projected for 2026, driven by energy-inflation concerns. Higher U.S. rates pressure EM currencies and make dollar-denominated EM debt more expensive to service — not ideal for the 25% of EEM exposed to this dynamic.
-
⚖️ Tariff overhang hasn't cleared: The Section 122 15% tariff on EM exports expires July 24 but political path is uncertain. 50% tariffs remain on Brazilian exports. Vietnam and other Southeast Asian exporters still face elevated rates. This isn't the clean tariff removal story some January inflow buyers were hoping for.
-
🎢 EM historical volatility is elevated: The 52-week range for EEM is $38.19 to $65.96 — a 73% spread. This thing can move. The 17.1% implied move for the full year (LEAPS) reflects real uncertainty about where EM equities land once the geopolitical fog clears.
-
📊 Concentration risk in semiconductors: TSMC + Samsung + SK hynix = roughly 21% of EEM. So EEM is partly an EM bet and partly a semiconductor AI play. If the AI trade has a bad few weeks, EEM goes with it regardless of macro EM fundamentals.
🎯 The Bottom Line
Real talk: Someone just paid $3.4M to hedge their EM exposure — in the same hour we learned the Fed is staying hawkish, while the Hormuz blockade continues squeezing China's oil supply and TSMC earnings loom on the April 17 expiration date. That's not a coincidence — the timing and structure of this trade is deliberate.
What this trade tells us:
- 🎯 The $56 put (near-the-money, 1.8% OTM) says they're worried about the NEAR TERM — a $56 test is not a crazy scenario, it's the first gamma support level
- 💰 The $53 put (7% OTM) says they're worried about a TAIL scenario — what if Hormuz gets worse, TSMC misses, and EM really sells off? They want protection all the way down
- ⏰ April 17 expiration captures TSMC Q1 2026 earnings — this is the most EEM-relevant catalyst in the next 30 days, and they wanted to be covered through it
- 🐋 Both trades hit with EXTREMELY UNUSUAL z-scores. We see z-scores of 8.6x maybe a handful of times per quarter for EEM — this isn't background noise
This is NOT a "sell all your EM exposure" signal — it's "someone big is buying insurance before a potentially bumpy 29 days."
If you own EEM or EM-heavy positions:
- ✅ Consider buying a small put spread ($56/$53 April) as a portfolio hedge — cheap at current implied vol
- 📊 Watch $56 as your mental line in the sand — below that, this institutional hedge starts paying off and momentum could accelerate
- ⏰ Mark Tencent/Alibaba late-March earnings and TSMC April 17 earnings on your calendar — those are the two biggest fundamental inflection points
- 🕊️ Stay alert to Iran ceasefire headlines — that single event would flip the whole EM narrative positive fast
If you're watching from the sidelines:
- 👀 Gamma resistance at $58 is strong — don't chase EEM above that level without a clear catalyst
- 🎯 A pullback to $55 with the $55 gamma wall holding (184 GEX) would be a more attractive entry for bulls with a clear defined-risk level to trade against
- 📊 EM valuations at 14x forward P/E with 21% consensus EPS growth are genuinely attractive — but macro timing matters
If you're bearish on EM:
- 📉 The $56 put spread is your cleanest, lowest-cost expression of the bearish case
- 🛡️ The gamma structure confirms the institutional hedge: $56 → $55 → $53 is the cascade path if selling accelerates
- ⏰ Focus on the April 17 TSMC catalyst as your thesis-test moment
Mark your calendar — Key dates:
- 📅 March 20 (Tomorrow) - Quarterly Triple Witch OPEX — expect short-term pinning, wait for clean price action afterward
- 📅 Late March 2026 - Tencent & Alibaba Q4 2025 earnings — 6.5% of EEM in play
- 📅 April 17, 2026 - Monthly OPEX + est. TSMC Q1 2026 earnings — this $3.4M trade expires here
- 📅 Late April 2026 - Samsung & SK hynix earnings — semiconductor weight (21%) in focus
- 📅 July 24, 2026 - Section 122 tariff expiration — biggest EM trade policy catalyst of H2 2026
- 📅 Ongoing - Iran war / Hormuz ceasefire headlines — the single largest unpriceable wildcard
Final verdict: EEM sits in an unusual position — fundamentally cheap EM valuations, strong tech tailwinds from TSMC and China tech, and record institutional inflows on one side; an active war disrupting global oil flows, a hawkish Fed, and binary earnings risk on the other. The $3.4M dual put hedge is a sensible, well-structured way to navigate that uncertainty. It's not panic — it's risk management from someone who knows how to position for an event-dense 29 days.
Sometimes the smartest trade is just buying the insurance.
Disclaimer: Options trading involves substantial risk of loss and is not suitable for all investors. This analysis is for educational and informational purposes only and does not constitute financial advice. Past performance does not guarantee future results. The unusual z-scores described reflect trade size relative to recent EEM option history — they do not imply the trades will be profitable or that you should replicate them. The described put strategies involve the risk of total loss of premium paid. ETF investing involves market risk including possible loss of principal. The geopolitical scenarios discussed (Iran war, Fed policy) are inherently uncertain and unpredictable. Always conduct your own research and consider consulting a licensed financial advisor before making investment decisions.
About iShares MSCI Emerging Markets ETF (EEM): EEM is a BlackRock iShares ETF providing exposure to large and mid-cap equities across 24 emerging market countries, with $28.2B in AUM and 1,282 holdings. Its largest positions are concentrated in Asian technology and semiconductor leaders, making it sensitive to both EM macro factors and global tech sentiment.