🌏 EEM Options Alert: $9.3M Bet Someone Is Buying Back Their Downside Protection
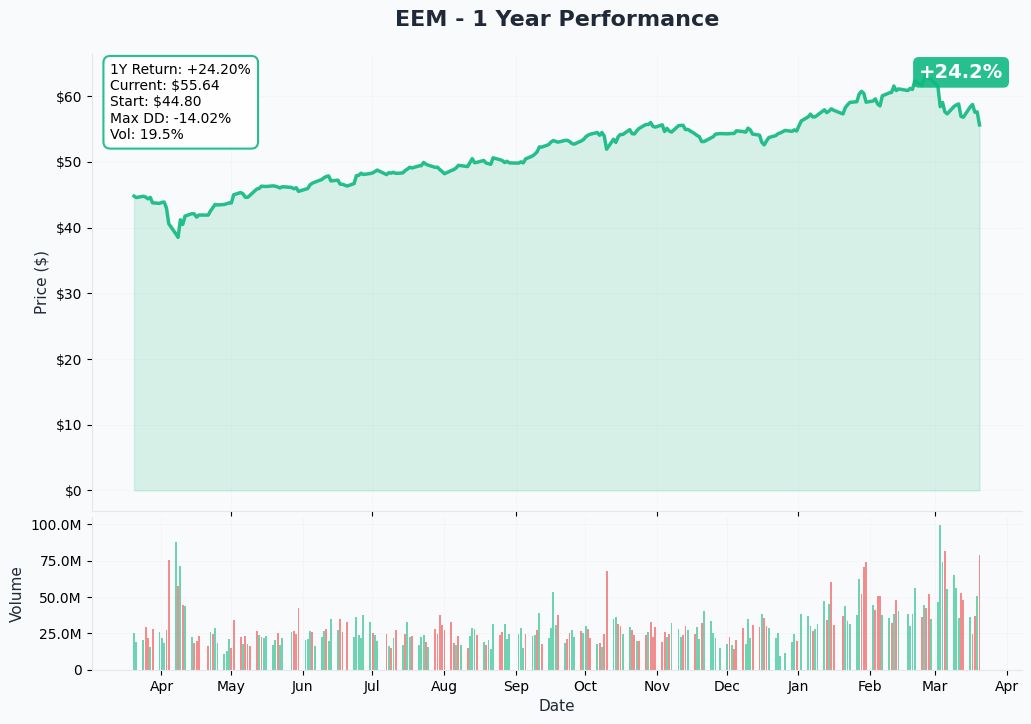
Date: March 20, 2026 ETF: iShares MSCI Emerging Markets ETF (EEM) Current Price: ~$56.08–$56.21
📋 The Trades at a Glance
| Field | Trade 1 | Trade 2 |
|---|---|---|
| Time | 12:28:30 | 12:36:24 |
| Symbol | EEM | EEM |
| Side | MID | MID |
| Direction | BUY | BUY |
| Type | PUT | PUT |
| Strike | $51 | $51 |
| Expiration | May 15, 2026 | May 15, 2026 |
| Contracts | 45,000 | 50,000 |
| Option Price | $0.97 | $0.97 |
| Premium | $4.4M | $4.9M |
| Spot Price | $56.21 | $56.08 |
| Open Interest | 3,800 | 3,800 |
| Volume | 45,000 | 100,000 |
| Option | EEM20260515P51 | EEM20260515P51 |
| Z-Score | 2.31 (HIGHLY UNUSUAL) | 5.38 (EXTREMELY UNUSUAL) |
Combined: 95,000 contracts | $9.3M total premium | $51 strike ~9% out-of-the-money
🔍 What's Actually Happening Here
At first glance, buying 95,000 put contracts on EEM looks like a massive bearish bet. But the structure tells a different story — this is almost certainly a Buy to Close (BTC) trade, meaning an institution is buying back puts they had previously sold.
Here is how to read the signal:
- Volume (145K) dwarfs Open Interest (3.8K) — there were only 3,800 contracts in existence before these trades hit. You cannot buy 95,000 contracts to open when the entire existing OI is 3,800. This volume is new contracts being created, which means a market maker is selling these puts to the institution as a fresh hedge against what the institution is closing elsewhere.
- MID execution — both trades executed at the mid-price, indicating a sophisticated institutional counterparty that negotiated the fill rather than lifting the ask.
- Same strike, same expiration, eight minutes apart — two tranches of the same position, likely split to manage market impact.
The interpretation: A large fund that had previously sold the EEM May $51 puts as an income or yield-enhancement trade is now paying $9.3M to get out of that position. They sold those puts expecting EEM to stay above $51. Now, with elevated macro uncertainty, they are willing to pay a premium to remove that obligation from their book.
This is defensive repositioning, not a fresh directional bet. The institution is reducing risk, not adding it.
📊 The Numbers That Stand Out
The z-score on the second trade — 5.38 — is striking. To put that in context:
- A z-score of 2.0 means the activity is in roughly the top 2-3% of historical volume readings for this contract
- A z-score of 5.38 means this is nearly six standard deviations above normal activity
- The first trade at 2.31 was already flagged as highly unusual
- Together, these two prints represent a coordinated institutional decision made within 8 minutes
The $51 strike is also not chosen arbitrarily. It sits approximately 9% below current spot, which represents a level the institution originally judged as a comfortable buffer for downside protection selling. The fact that they are exiting this position now suggests their comfort with that buffer has eroded.
🎯 The May 15 Implied Move: A Near-Perfect Coincidence
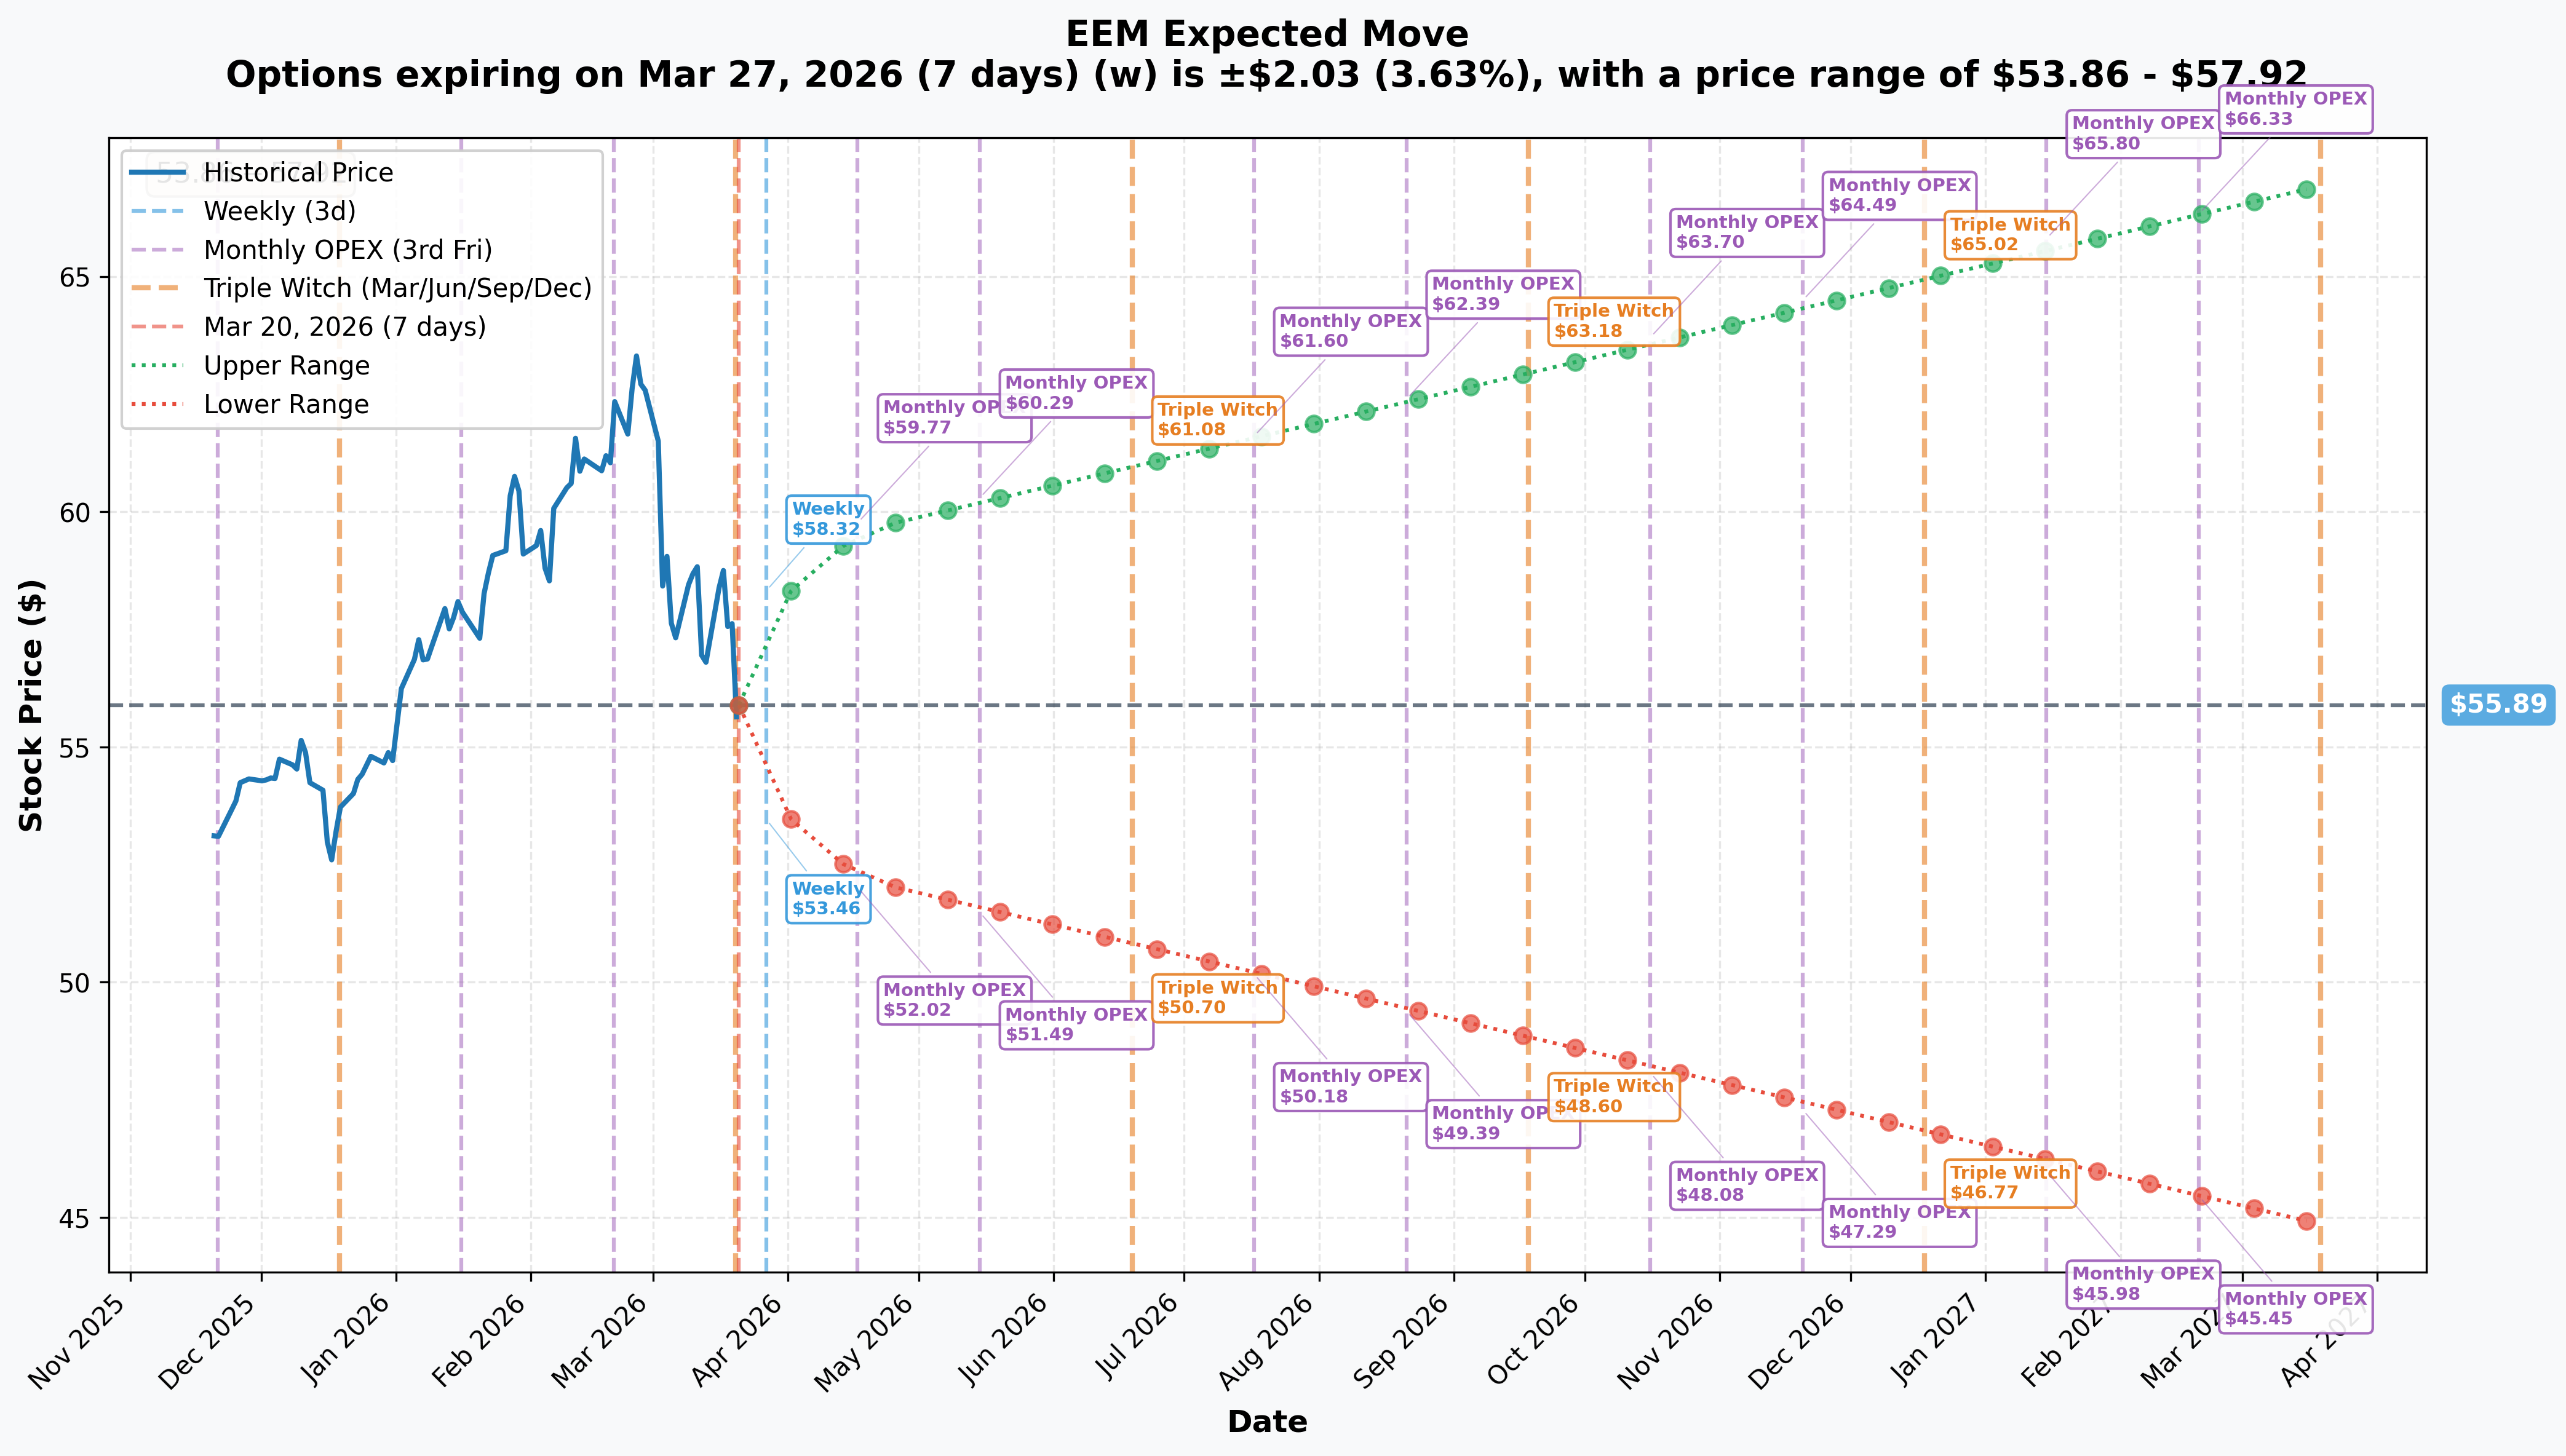
The options market is currently pricing the following implied moves for EEM:
| Expiry | Move | Range |
|---|---|---|
| Weekly (Mar 27) | ±3.63% ($2.03) | $53.86 – $57.92 |
| Monthly OPEX (Apr 17) | ±6.62% ($3.70) | $52.19 – $59.59 |
| May OPEX (May 15) | see below | Upper $60.29 / Lower $51.49 |
| Yearly LEAPS | ±19.77% | $44.84 – $66.94 |
The May 15 expiration — the exact expiry of these trades — has an options-implied lower bound of $51.49.
The strike being exited is $51.00.
That is a gap of just $0.49, or less than 1%. The options market itself is pricing the May $51 put as sitting right at the edge of what is considered a realistic downside scenario by expiration. The institution that sold these puts originally likely used exactly this logic: "The market says EEM will not fall more than ~9% by May, so selling these puts is a reasonable income trade."
The question now is: what changed?
🌍 The Macro Backdrop Driving This Decision
Several converging macro forces explain why an institution would pay $9.3M to exit a position that was previously considered safe:
Iran Conflict & Oil Shock The Strait of Hormuz closure that began February 28 sent crude oil from ~$70/bbl to over $110/bbl. EEM dropped 8.4% in a single week. A significant portion of EEM's holdings are energy importers (India, China, South Korea), and sustained high oil prices compress margins across the fund's largest geographic exposures. A fund short the $51 puts through that period would have watched their buffer shrink from comfortable to manageable — and they may now be concerned about a second leg.
Fed Hawkish Pivot The Federal Reserve held rates at 3.50–3.75% on March 18 with a hawkish tone, projecting only one cut for 2026. Elevated U.S. rates strengthen the dollar, which is historically negative for EM assets. Capital tends to flow back to dollar-denominated assets when U.S. yields remain elevated, creating a headwind for EEM regardless of underlying EM fundamentals.
China's Subdued Growth Target China set its lowest growth target in decades at 4.5–5% for 2026. With China at 27.1% of EEM's portfolio, a slowdown in the world's second-largest economy has an outsized impact on the fund. The DeepSeek AI rally brought the Hang Seng Tech Index up 17.88% in February and Goldman projects $200B in inflows, but that tailwind may already be priced in at current levels.
TSMC Earnings Risk TSMC represents 13.35% of EEM — the single largest holding. Q1 earnings are due April 16, before the May 15 expiration. Any semiconductor demand softness, geopolitical commentary regarding Taiwan, or guidance miss could move EEM meaningfully in either direction. An institution short puts through an earnings event of this magnitude faces asymmetric tail risk.
📈 Gamma & Support/Resistance Structure
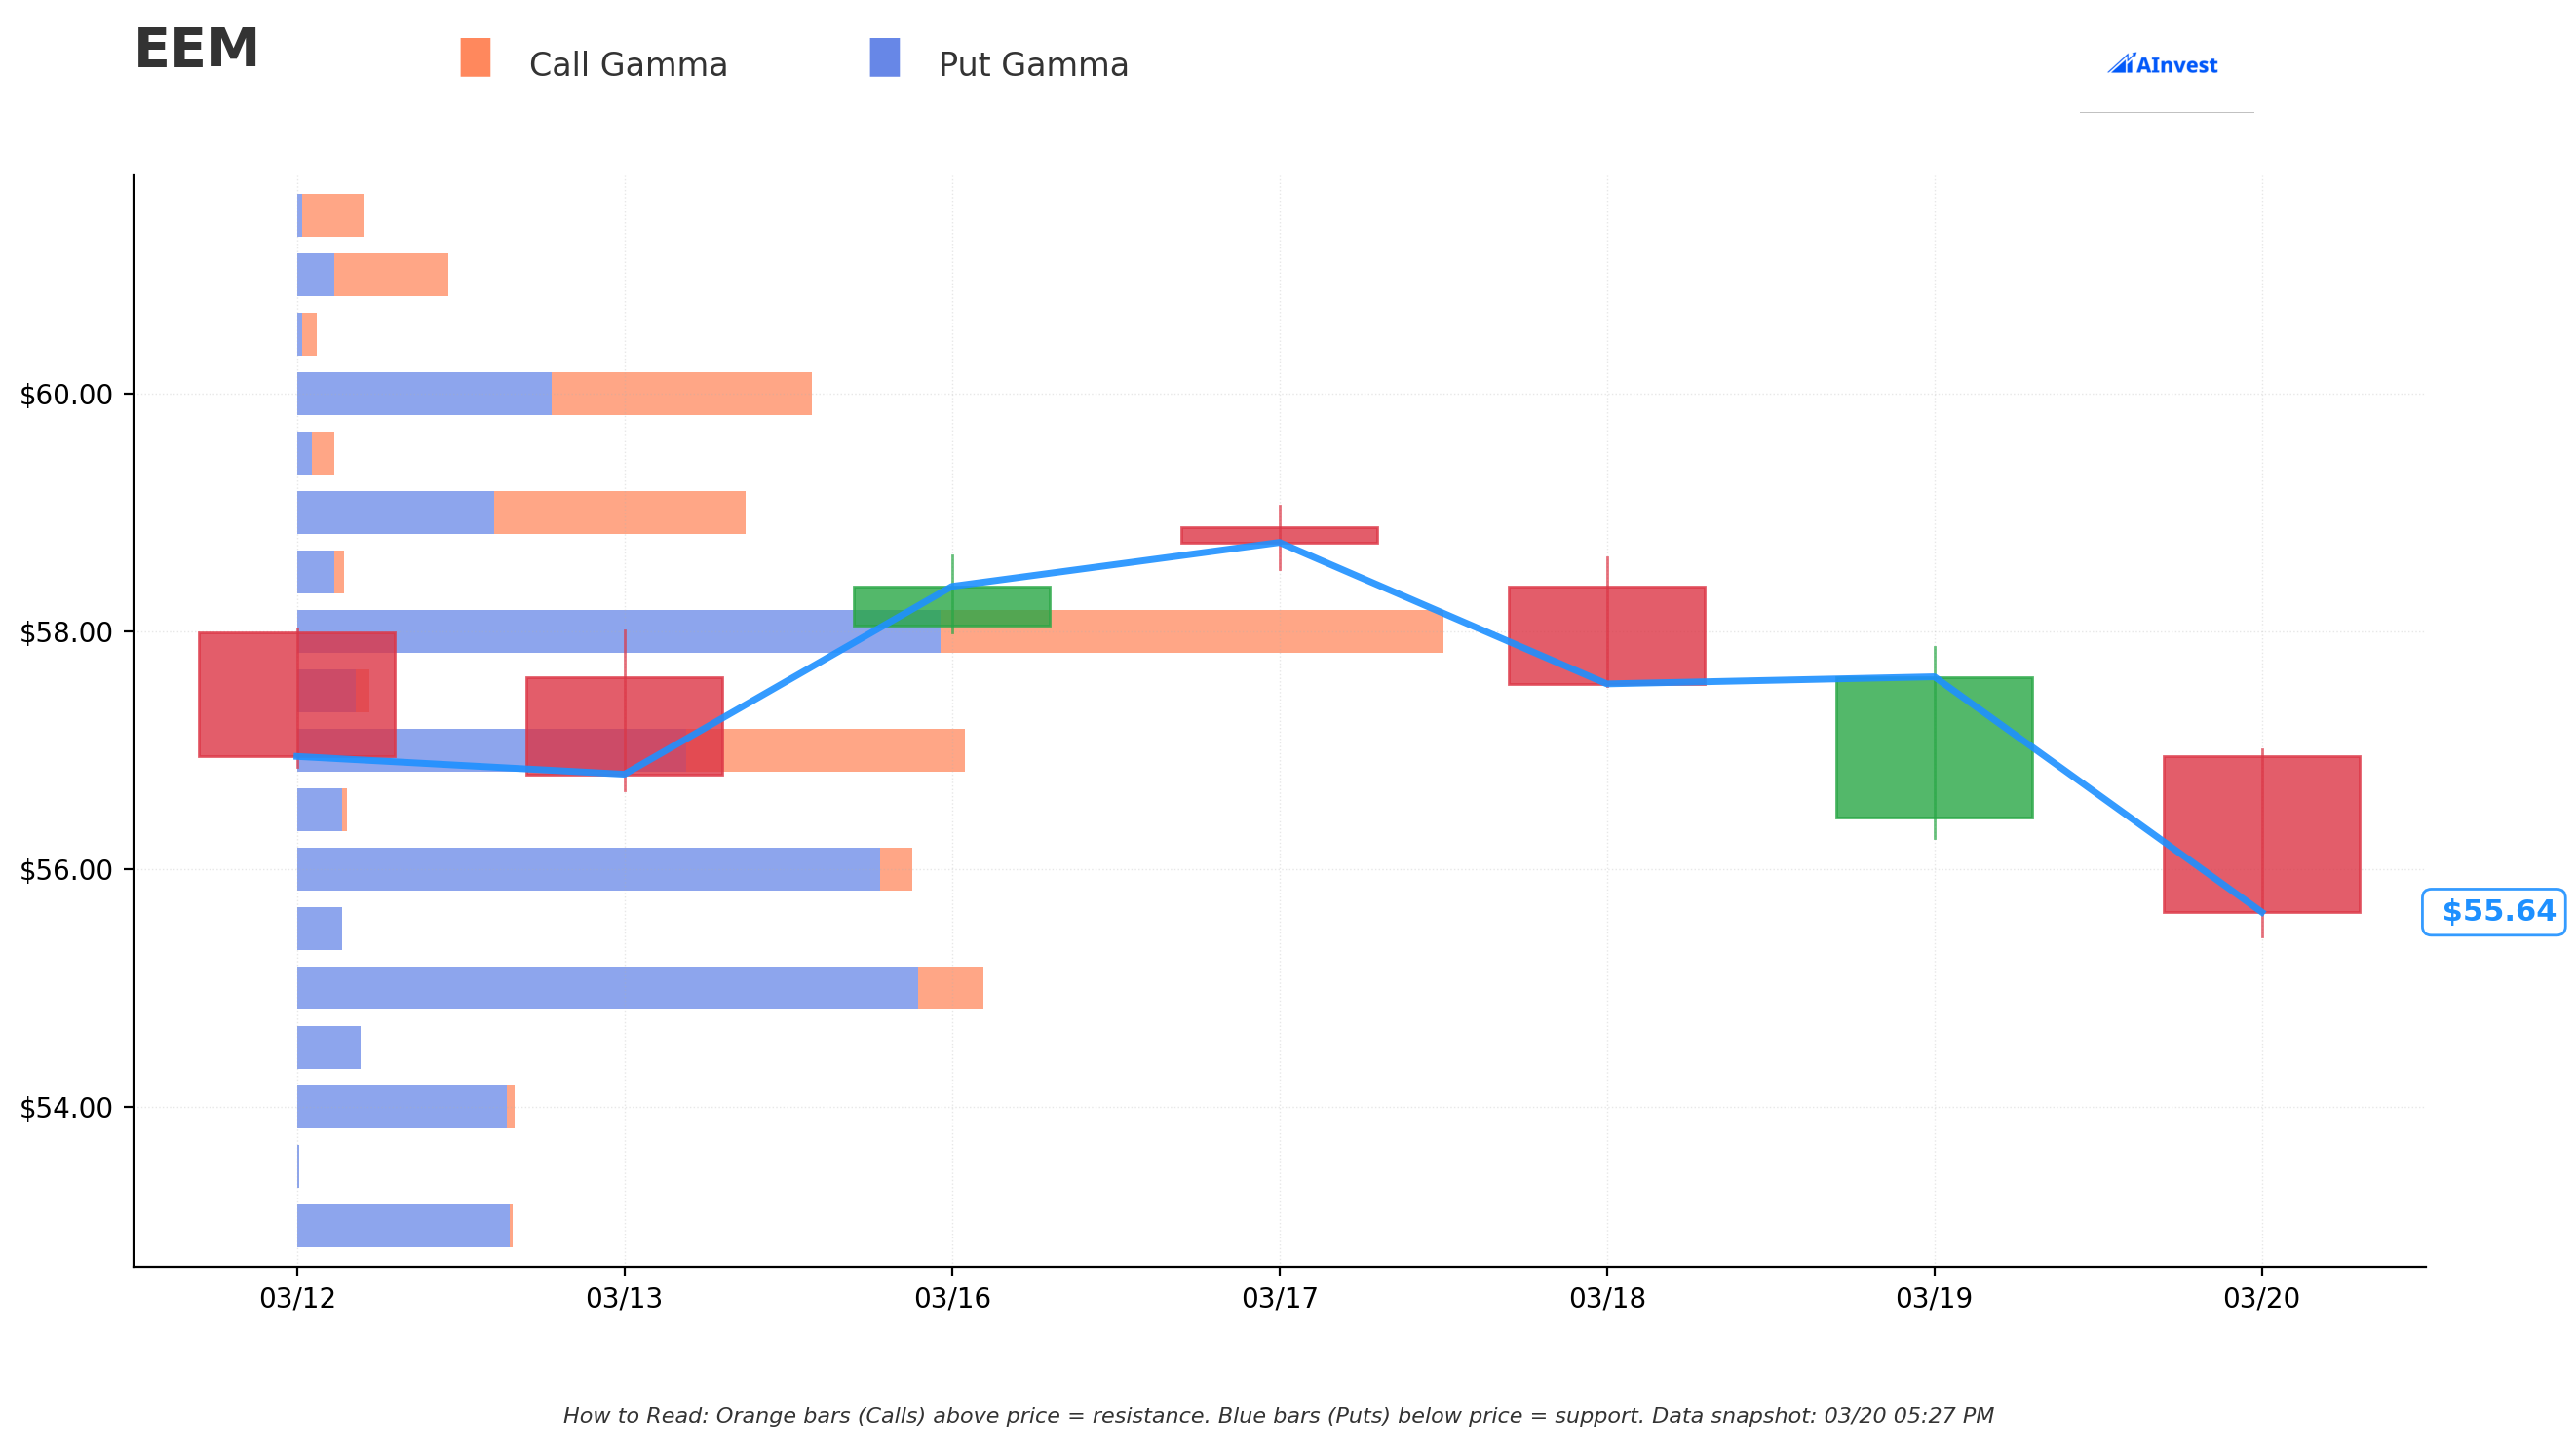
The current GEX (Gamma Exposure) profile for EEM reveals an important structural picture:
GEX Bias: Bearish (578B call vs. 896B put gamma)
Support Levels:
| Level | Gamma Support | Notes |
|---|---|---|
| $56 | 119.9B | Immediate — where EEM is sitting now |
| $55 | 133.7B | Strongest support on the board |
| $54 | 42.4B | Secondary support |
| $50 | 55.2B | Near the $51 strike — deep OTM anchor |
Resistance Levels:
| Level | Gamma Resistance | Notes |
|---|---|---|
| $57 | 130.2B | First resistance above |
| $58 | 223.3B | Massive wall — difficult to break |
| $59 | 87.5B | Extended resistance |
| $60 | 100.4B | Round number + gamma clustering |
EEM is currently pinned between $56 support and the $57–$58 resistance wall. With put gamma dominating the overall structure, market makers are net short gamma on the downside, which means a break below $56 support could accelerate, rather than cushion, a sell-off. The $55 gamma support level would be the next meaningful floor, and if that gives way, the path to $51–$52 opens more quickly than the implied move alone would suggest.
The $51 strike the institution is exiting sits near a gamma support anchor at $50 — which is actually part of why this strike was appealing to sell originally. If EEM were to reach $51, market makers would theoretically be providing support near that level. The problem is that support levels in high-volatility regimes can act as magnets rather than floors, particularly when macro catalysts override the structural gamma dynamics.
💡 Three Trade Ideas
These are analytical frameworks, not personalized financial advice. Options trading involves substantial risk and may not be suitable for all investors.
Idea 1: Bear Put Spread — Directional Downside with Defined Risk
The thesis: If the institution's decision to exit their short puts reflects genuine concern about a move toward $51–$52 by May, a bear put spread captures that scenario with capped risk.
Structure:
- Buy EEM May 15, 2026 $55 Put
- Sell EEM May 15, 2026 $51 Put (the same strike being exited)
Rationale: The $55/$51 spread covers the range between the strongest gamma support ($55) and the institutional strike being bought back ($51). You are betting that EEM breaks below its gamma support floor and drifts toward where the big money is covering.
Key levels:
- Max profit: At or below $51 at May expiration
- Breakeven: $55 minus net debit paid
- Max loss: Net debit (defined and limited)
- Risk factors: A China stimulus surprise, TSMC beat, or Iran resolution could push EEM above $57 and make this spread worthless
Idea 2: Long Call — Contrarian Bounce Play Off Support
The thesis: The $9.3M BTC trade suggests the institution believes risk has increased — but markets often overreact to institutional hedging activity. If EEM holds $55–$56 gamma support and macro headwinds ease, the path to $58 resistance (and potentially $60) reopens.
Structure:
- Buy EEM May 15, 2026 $57 or $58 Call (OTM, above resistance)
Rationale: With EEM between $56 support and the $58 resistance wall, a call positioned above the gamma ceiling captures a breakout scenario. The DeepSeek AI tailwind, strong fund flows ($4.67B 3-month net inflows), and potential Iran de-escalation are all potential upside catalysts.
Key levels:
- Entry: Only on a confirmed hold of $56 support with a catalyst
- Target: $58–$60 (aligns with gamma resistance clusters)
- Max loss: Full premium paid
- Risk factors: Fed hawkishness, oil sustained above $100, TSMC earnings miss
Idea 3: Strangle Ahead of TSMC Earnings
The thesis: TSMC reports April 16, well before the May 15 expiration. With TSMC at 13.35% of EEM, the earnings event introduces significant directional uncertainty. A strangle profits from a large move in either direction.
Structure:
- Buy EEM April 17 $59 Call (above resistance)
- Buy EEM April 17 $53 Put (below gamma support cluster)
Rationale: The April OPEX implied move already prices ±6.62%, giving a range of $52.19–$59.59. A strangle with wings slightly outside this range is expensive but positions for a TSMC-driven tail event. The combination of Fed uncertainty, oil prices, and TSMC guidance could easily produce a move at or beyond the implied range.
Key levels:
- Profit: EEM moves more than the combined premium cost beyond $59 or below $53
- Max loss: Full premium on both legs if EEM stays range-bound
- Risk factors: IV crush post-earnings if TSMC results are in-line; time decay is the primary enemy
⚠️ Key Risk Factors to Watch
Macro:
- Iran-Strait of Hormuz escalation or de-escalation — binary impact on oil and EM risk sentiment
- Fed signals at Apr 28–29 FOMC meeting — any hawkish surprise strengthens dollar, pressures EEM
- China April data releases — property sector, manufacturing PMI, retail sales
Technical:
- Loss of $56 gamma support — opens path to $55 and potentially $53–$54
- Break above $58 resistance — would invalidate bearish GEX bias and suggest momentum shift
- MSCI May 2026 Semi-Annual Rebalance — passive flows could move individual holdings including TSMC, Samsung
Company-Specific:
- TSMC Q1 earnings (April 16): 13.35% of EEM — single most important earnings event before May 15 expiry
- Samsung: 5.41% of EEM — memory chip demand outlook
- India elections/policy: 17% geographic weight, any political uncertainty could drag
- Alibaba: 2.71% — any regulatory headline from Beijing
📌 Summary
| Item | Detail |
|---|---|
| Strategy Detected | Closing Short Put |
| Total Premium Paid | $9.3M |
| Contracts | 95,000 |
| Strike | $51 (9% OTM) |
| Expiry | May 15, 2026 |
| Z-Scores | 2.31 and 5.38 |
| May Implied Lower Bound | $51.49 (nearly exactly the $51 strike) |
| GEX Bias | Bearish, EEM between $56 support and $58 wall |
| Read | Defensive repositioning, not fresh bearish bet |
The signal here is nuanced. An institution that was content collecting premium on EEM downside is no longer comfortable holding that exposure. They paid $9.3M today to remove a position that was presumably profitable when initiated. Whether that reflects Iran headline risk, TSMC earnings uncertainty, dollar strength concerns, or a combination — the message is that the risk/reward on the $51 put short has shifted enough to justify an expensive exit.
EEM continues to trade in a macro crossfire: China AI euphoria on one side, elevated oil prices and Fed hawkishness on the other. The gamma structure confirms the range-bound tension, with meaningful support at $55 and a formidable resistance wall at $58. The institution's decision to close at the May implied move lower boundary is the clearest statement of where institutional risk tolerance currently sits.
Options trading involves substantial risk and may not be suitable for all investors. This analysis is for informational purposes only and does not constitute personalized financial advice. Always conduct your own due diligence before trading.