🔓 IGV — Someone Just Unlocked a $12.8M Short Call Bet on Software… Then Bought It Back!
📅 March 13, 2026 | 🔥 Unusual Activity Detected
🎯 The Quick Take
A single institutional player just spent $12.8 million buying back $90 call contracts they had previously sold on IGV — the premier software sector ETF — two fills, 27,500 contracts each. This is a Close Short Call (STC) trade, meaning someone who had capped their upside at $90 is now removing that cap entirely. When a call-writer pays to escape their own position, it's a loud signal: they think the software sector is going higher than they originally bet.
📊 ETF Overview
iShares Expanded Tech-Software Sector ETF (IGV) tracks the S&P North American Expanded Technology Software Index, giving you one-click access to 119 U.S. software companies. Think of it as a bet on the entire enterprise software complex:
- 📌 Top Holdings: Microsoft (9.20%), Palantir (8.77%), Oracle (7.95%), Salesforce (7.25%), Palo Alto Networks (5.24%)
- 📌 Concentration: Top 10 holdings = 61% of fund assets — this ETF moves with its mega-cap names
- 📌 Expense Ratio: 0.40% | Holdings: 119 stocks
- 📌 52-Week Range: $76.26 – $117.99 | Current Price (Mar 13): ~$84
- 📌 Sector: Software & Technology Services — per iShares' ETF profile
The big picture: IGV is down nearly 29% from its September 2025 peak of $117.99, caught in the "SaaSpocalypse" — the market's fear that AI agents will cannibalize traditional software. That backstory is CRITICAL to understanding today's trade.
💰 The Option Flow Breakdown
📊 The Tape — March 13, 2026
| Time | Symbol | Side | Buy/Sell | Type | Expiration | Premium | Strike | Volume | OI | Size | Spot | Option Price |
|---|---|---|---|---|---|---|---|---|---|---|---|---|
| MID | IGV | MID | SELL | CALL $90 | 2026-05-15 | $6.4M | $90 | 28K | 68K | 27,500 | $83.84 | $2.32 |
| MID | IGV | MID | SELL | CALL $90 | 2026-05-15 | $6.4M | $90 | 55K | 68K | 27,500 | $83.84 | $2.32 |
Two fills, same contract, same price. Total: ~55,000 contracts closed, ~$12.8M in premiums exchanged.
🤓 What This Actually Means
Real talk: The "SELL" on the tape looks bearish at first glance — but the context flips everything. This is a Close Short Call (STC) trade. Here's how to decode it:
The life of this position:
- 🔁 Step 1 (weeks/months ago): An institution sold 55,000 IGV May $90 calls — collecting premium and agreeing to sell IGV shares at $90 if the ETF rallied there. They were capping their upside and betting software stayed below $90.
- 🔁 Step 2 (today): That same institution buys back those exact calls, paying $2.32 per share × 55,000 contracts × 100 = $12.8M to escape that obligation.
Why does this matter? When a call-writer buys back their sold position, they are saying: "I no longer want to be short the $90 strike." The cap on their upside is gone. They are removing their own ceiling on IGV.
🔑 The key signal: Volume of ~83K contracts vs. OI of just 68K confirms this is closing activity — volume exceeding OI is the fingerprint of a trader exiting. This isn't new speculation. This is cleanup from an existing short position.
💡 Translation for regular folks: Imagine you bet your neighbor that your house wouldn't sell above $90 per share. Now you're paying $12.8 million to tear up that bet. You'd only do that if you thought the house is about to sell well above $90.
📈 Technical Setup / Chart Check-Up
YTD Performance Chart
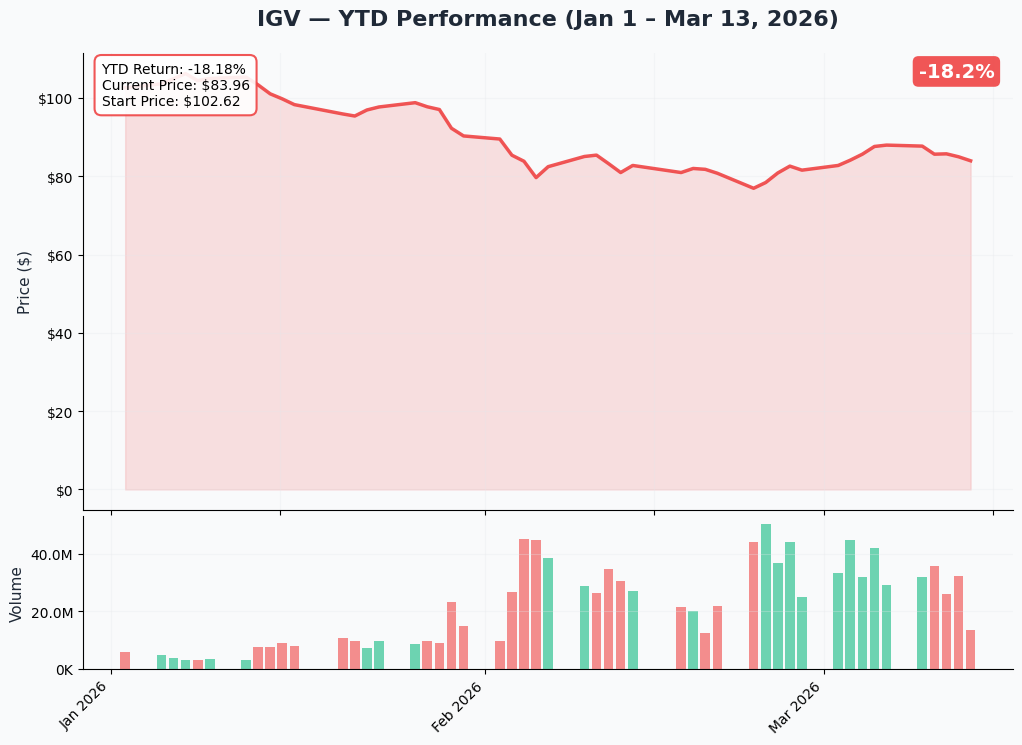
IGV entered 2026 in full meltdown mode — falling from $117.99 in September 2025 to a low near $76 before bouncing. Current price ~$84 represents a 29% haircut from peak, driven entirely by the "SaaSpocalypse" narrative (AI disrupting traditional SaaS). The YTD chart is a story of a sector that got crushed and is now attempting to build a base.
Key chart observations:
- 📉 The waterfall: Sep 2025 to Jan 2026 was a near-vertical drop — panic selling, not fundamental repricing
- 📈 The base: Price has been consolidating between $76 and $86 for several weeks — classic bottoming pattern
- 🎢 52-week range: $76.26 low vs. $117.99 high — massive range that tells you exactly how much pain the software sector absorbed
- 👀 Where we are now: $84 puts IGV right in the middle of near-term gamma battleground
🔵🟠 Gamma-Based Support & Resistance Analysis
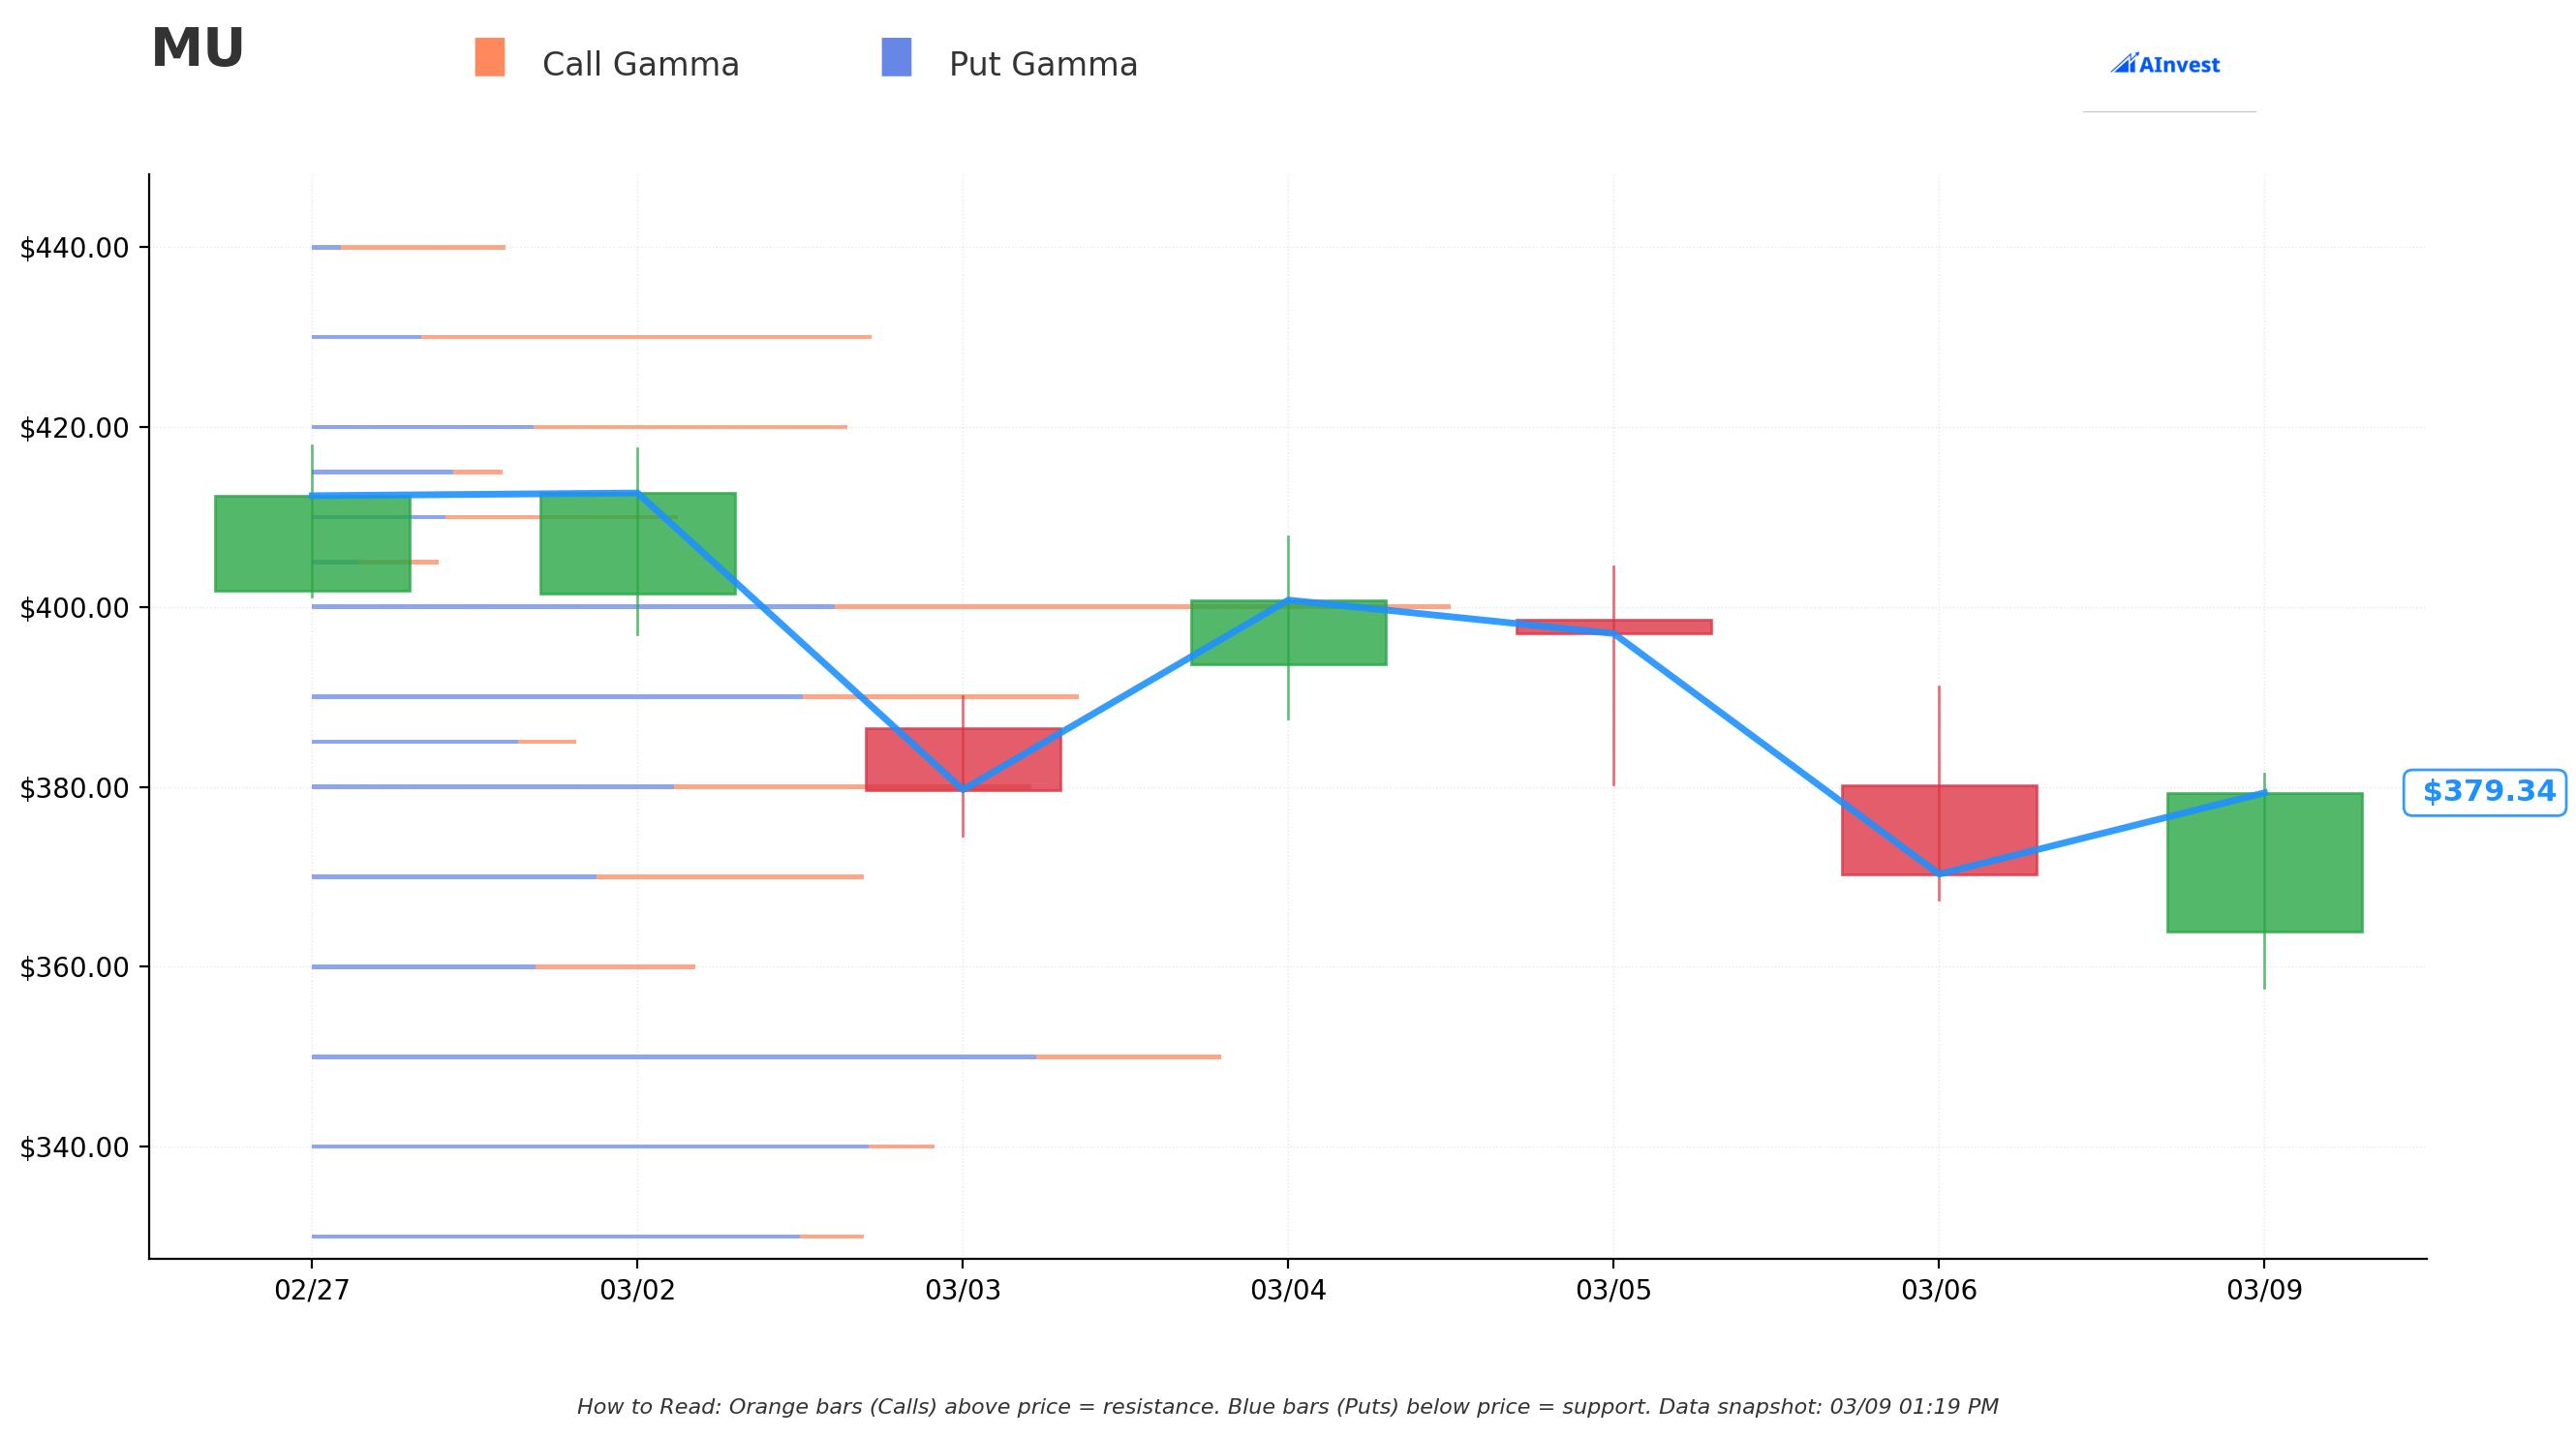
Current Price: $84.13
Reading the gamma exposure (GEX) data tells us where market makers are most heavily positioned — and where price tends to gravitate or bounce:
🔵 Support Levels (Put Gamma — Price Floors):
| Strike | Total GEX | Distance | What It Means |
|---|---|---|---|
| $84 | 36.3 | 0.15% | Immediate floor — strongest nearby support! |
| $82 | 10.9 | 2.5% | Secondary cushion if $84 breaks |
| $80 | 26.9 | 4.9% | Major support wall — big put positioning here |
| $75 | 9.2 | 10.8% | Deep floor, disaster-scenario support |
The $84 strike is remarkable — with 36.3 total GEX and only 0.15% from current price, it's acting as a gravitational anchor. Market makers are aggressively defending this level. Then $80 is the next major line in the sand — 26.9 GEX makes it a structural floor.
🟠 Resistance Levels (Call Gamma — Ceilings):
| Strike | Total GEX | Distance | What It Means |
|---|---|---|---|
| $85 | 49.5 | 1.0% | Immediate ceiling — STRONGEST resistance! |
| $87 | 21.6 | 3.4% | Secondary resistance |
| $88 | 10.5 | 4.6% | Modest friction zone |
| $90 | 57.2 | 7.0% | THE STRIKE — Heaviest call gamma on the board! |
| $100 | 9.5 | 18.9% | Long-term target if $90 breaks |
Plot twist: The $90 strike that was just closed out has 57.2 total GEX — the single heaviest call gamma level across the entire board. That's not a coincidence. This is exactly the level where market makers have maximum hedging exposure, and it's the same strike our institutional trader just stopped being short. They paid $12.8M to remove themselves from the most gamma-dense level on the chart.
Net GEX Bias: Bullish (207.4 call GEX vs. 127.3 put GEX) — Overall positioning tilts bullish, but IGV needs to clear $85 first.
📐 Implied Move Analysis
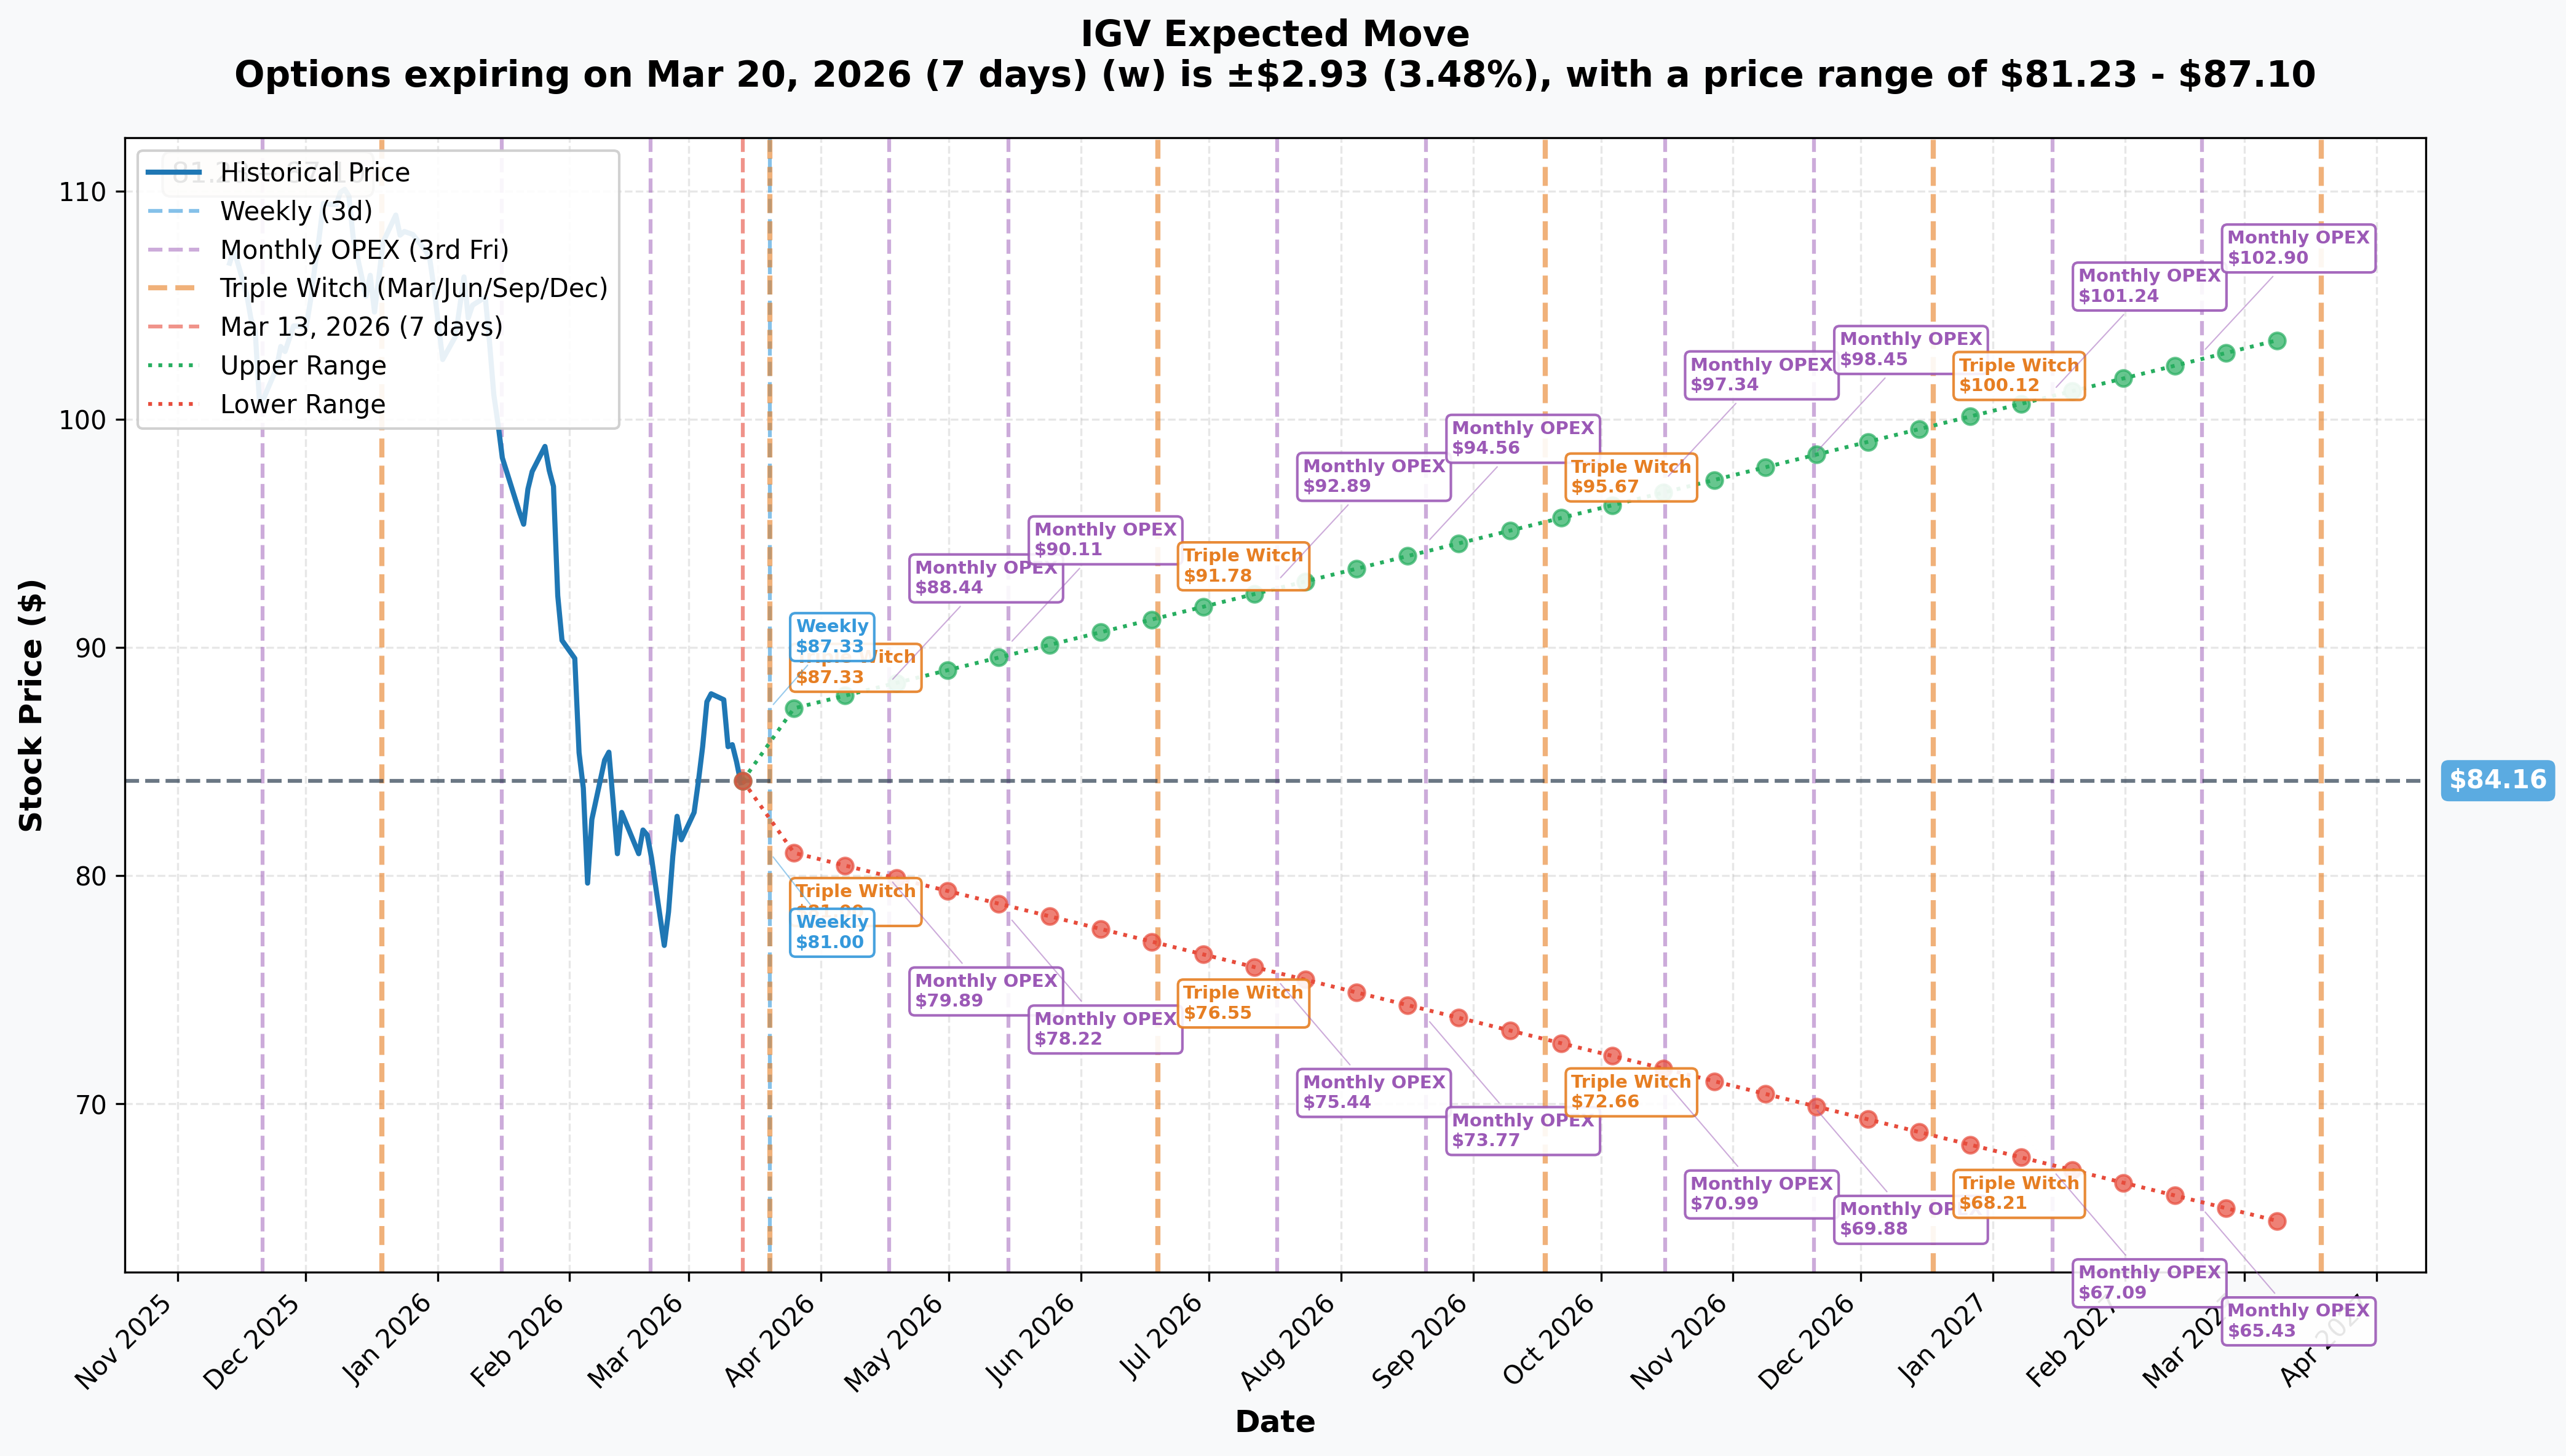
What options traders are pricing in:
| Timeframe | Expiry | Days | Implied Move | Range |
|---|---|---|---|---|
| 📅 Weekly / Mar OPEX | 2026-03-20 | 7 | ±$2.93 (±3.5%) | $81.23 – $87.10 |
| 📅 May OPEX (THIS TRADE!) | 2026-05-15 | ~63 | — | $78.22 – $90.11 |
| 📅 June Triple Witch | 2026-06-19 | ~98 | — | $76.55 – $91.78 |
| 📅 1-Year LEAPS | 2027-03-19 | 371 | ±$19.80 (±23.5%) | $64.36 – $103.97 |
The most important number here: The May 2026 OPEX upper range is $90.11 — essentially dead-on the $90 strike. The options market is saying there is a mathematically non-trivial chance that IGV hits $90 by May 15. The institution that was short those calls clearly saw the same thing. That's exactly why they closed.
Weekly context: The 7-day implied move is ±3.5% ($2.93). That puts next week's range at $81.23 – $87.10, with $85 as the key level to watch this week before any attempt at $87+.
🎪 Catalysts
🔥 Upcoming Catalysts (Mar – May 2026)
Microsoft Build Conference — May 2026 🤖
Microsoft's annual developer conference, typically in May, is the single biggest near-term catalyst for IGV. Announcements around Copilot monetization and Azure AI services directly move the ETF's largest holding (9.20% weight). A strong Build could act as the catalyst that pushes IGV from $84 through the $85 gamma wall toward the $90 target. This event lands right in the window of the May 15 expiration — exactly why the institution closed their short.
Salesforce Q1 FY2027 Earnings — Late May/Early June 2026 📊
Salesforce (7.25% of IGV) reports Q1 FY2027 earnings in late May. The Agentforce AI platform adoption rate is the market's litmus test: strong traction = sector relief rally; weak traction = "SaaSpocalypse" deepens. This earnings print arrives right around the May 15 expiration, making it a direct binary catalyst for whether IGV is above or below $90 at expiration.
Oracle Cloud Backlog Conversion — Ongoing 💾
Oracle (7.95% of IGV) entered 2026 with a $130+ billion remaining performance obligation — record backlog driven by AI cloud infrastructure contracts. Each quarterly earnings confirming backlog conversion is a steady, compounding positive for IGV. Oracle's Q4 FY2026 results in June 2026 will be the next read.
AI Agent Deployment — The Pivotal 2026 Narrative 🤝
The deployment of enterprise AI agents (Salesforce Agentforce, Microsoft Copilot Agents, ServiceNow AI) is the storyline that either resurrects or buries the software sector. Q1 2026 earnings commentary from the major holdings will set the tone. J.P. Morgan has identified 19 software stocks positioned to rebound as AI becomes a revenue enhancer, not a displacer.
Fed Policy & Rate Sensitivity 📉
IGV is a high-multiple growth sector — deeply sensitive to interest rates. Any Fed rate cut or dovish pivot directly re-rates software valuations higher. With the Fed in focus in March and May 2026, a single dovish surprise could be the spark that runs IGV from $84 to $90+.
📜 Past Catalysts (Already Happened)
The "SaaSpocalypse" Selloff (Sep 2025 – Mar 2026)
IGV peaked at $117.99 in September 2025 and fell ~29% to ~$84 on fears that AI agents (GitHub Copilot, Cursor, Devin, OpenAI Codex) would displace traditional SaaS applications. Even high-quality names like Microsoft, Oracle, and Salesforce were sold indiscriminately. This is the macro backdrop that made the original short call position look smart — until now.
Analyst Rebuttals to AI Disruption Fears
Dan Ives (Wedbush) called the software selloff a "major buying opportunity," arguing fears of AI replacing software are overblown. His thesis: AI expands the software TAM, it doesn't shrink it. This narrative shift appears to be gaining traction — and may be the reason our institutional player is closing their short.
Palantir Surge — New #2 Holding
Palantir became the #2 holding in IGV (8.77% weight) as its stock surged on U.S. government AI contracts — the AIP platform and MAVEN smart system. Palantir's rise fundamentally changed IGV's character from "enterprise SaaS" to "AI-native software," adding another dimension to the bull case.
🎲 Price Targets & Probabilities
Using the gamma exposure data, implied move framework, and catalyst calendar, here are three scenarios through the May 15, 2026 expiration:
📈 Bull Case (30% probability)
Target: $90 – $92
How we get there:
- 🚀 Microsoft Build in May delivers strong Copilot monetization data — triggers sector rerating
- ✅ Salesforce Q1 FY2027 shows Agentforce traction is additive, not cannibalizing
- 📈 Fed cuts rates or signals cuts, expanding growth stock multiples
- 🔑 IGV clears $85 gamma resistance (49.5 GEX), then $87, then $90
- 🎯 Why $90 specifically: That's both the upper range of the May implied move ($90.11) AND the heaviest call gamma level (57.2 GEX) — a natural target/ceiling
- 💡 The call-writer bought back $12.8M worth of the $90 strike because they now believe this scenario is real
This is the STC trade's thesis in a single sentence: Someone just paid $12.8M to remove the cap on their profit if software recovers.
🎯 Base Case (45% probability)
Target: $82 – $88 (range-bound chop)
Most likely scenario:
- 📊 Earnings season shows mixed AI impact — some companies benefit, some don't
- ⚖️ IGV oscillates between $82 and $88 as bulls and bears fight over the "SaaSpocalypse" narrative
- 🔄 $84 gamma support (36.3 GEX) and $85 resistance (49.5 GEX) create a tight trading band
- 😐 No Fed catalyst, no blockbuster conference headline, just slow grinding
- 🤔 The closed short position expires worthless — the institution broke even or locked in a small profit on the buyback
What range-bound means for the STC: If IGV stays between $82–$88 through May 15, the $90 calls expire worthless anyway. The institution spent $12.8M not necessarily to profit on the buyback, but to remove the tail risk of a sudden rally through $90.
📉 Bear Case (25% probability)
Target: $78 – $82 (retest of lows)
What breaks the base:
- 😰 Q1 2026 earnings from MSFT, CRM, or ORCL show actual seat erosion from AI — "SaaSpocalypse" is confirmed
- 📉 Macro deterioration: recession fears force enterprise IT budget cuts
- ❗ Microsoft Build disappoints — no major AI monetization announcement
- 🔻 IGV breaks $84 gamma support (triggering cascade toward $80 major support at 26.9 GEX)
- 🛡️ $80 is the next major floor — that's where the structural put gamma wall sits
- 💔 If $80 breaks, $75 is the deep support level
Critical note on the STC: Even in the bear case, the institution still made the right decision closing their short calls — those calls would have declined in value alongside IGV anyway, and they'd have exited for a profit on the original short. The STC close was smart risk management either way.
💡 Trading Ideas
🛡️ Conservative: "Sleep Well" — Sell Cash-Secured Puts at Support
Play: Sell IGV May $80 puts
Why this works:
- 💰 Collect premium while targeting the $80 major gamma support level (26.9 GEX) as your "floor"
- 📊 $80 represents 4.9% downside from current price — a reasonable buffer
- 🎯 Aligns with the gamma data showing strong put positioning that should catch sellers
- 🤝 You're essentially getting paid to agree to buy IGV at a level where market makers have massive support
- ⏰ May 15 expiration = ~63 days, capturing the earnings/conference catalyst window
Estimated P&L:
- 💵 Collect ~$1.00–$1.50 per share in premium
- 📈 If IGV stays above $80: Keep full premium (best case)
- 📉 If IGV drops below $80: You own shares at effective cost of ~$78.50–$79.00
Risk level: Low-Moderate (defined outcome) | Skill level: Intermediate | Probability of profit: ~75%
⚖️ Balanced: "Follow the Whale" — Bull Call Spread at the Gamma Levels
Play: Buy IGV May $85 call / Sell IGV May $90 call
Why this works:
- 🐋 You're essentially replicating the directional bet of the institution that closed their short — you're now long $85/$90
- 📊 The $85/$90 spread captures the exact range the gamma data and implied move suggest as the bull target
- 💸 Defined risk — you can't lose more than the debit paid, no matter how bad it gets
- 🎯 Max profit if IGV lands at or above $90 at May expiration (where the implied move ceiling sits at $90.11)
- ⚡ Breakeven somewhere around $86.50–$87 depending on premium
Estimated P&L (approximate):
- 💵 Cost: ~$1.00–$1.50 net debit per spread
- 📈 Max profit: $3.50–$4.00 if IGV at $90+ at expiration (~250–300% ROI)
- 📉 Max loss: $1.00–$1.50 (lose the debit if IGV stays below $85)
- 🎯 Breakeven: ~$86.50
Risk level: Moderate (defined risk, directional) | Skill level: Intermediate | Probability of profit: ~35–40%
🚀 Aggressive: "YOLO with a Map" — Long May $87 Calls
Play: Buy IGV May 2026 $87 calls
Why this could work:
- 💥 If Microsoft Build in May + Salesforce earnings both beat, IGV could gap from $84 to $88–$92 quickly
- 🔥 $87 is the secondary resistance level (21.6 GEX) — a breakout above here opens the path to $90
- 📅 May expiration captures ALL the major catalysts: Build conference, Salesforce earnings, Fed meeting
- 🤖 The "SaaSpocalypse" reversal narrative is gaining momentum — Dan Ives, J.P. Morgan both calling for a rebound
- ⚡ If the $90.11 implied move upper range is hit, $87 calls go from out-of-the-money to deeply in-the-money
Serious risks (read this):
- ⚠️ This is an OTM call — you can lose 100% of premium if IGV stays below $87
- 💸 Theta burns daily — don't buy too early or you'll watch your premium decay while waiting for catalysts
- ❗ If earnings disappoint or Build is a dud, these calls go to zero fast
- 🎢 IGV has 23.5% annualized implied volatility — this thing can swing hard in either direction
Estimated P&L:
- 💵 Cost: ~$1.50–$2.00 per contract
- 🚀 If IGV reaches $90: ~$1.00–$1.50 intrinsic + time value (50–100% ROI)
- 💀 If IGV stays below $87: Full premium lost
Risk level: HIGH (can lose 100%) | Skill level: Advanced | Probability of profit: ~25–30%
⚠️ Risk Factors
Don't step in front of these potential landmines:
-
😰 "SaaSpocalypse" gets confirmed: The biggest risk to any long software trade is Q1 2026 earnings season revealing actual seat erosion. If Microsoft, Salesforce, or Oracle guidance shows AI agents are genuinely displacing software seats, IGV could retest the $76 low with no natural floor until $75 gamma support.
-
🎢 $85 gamma wall is real and thick: With 49.5 total GEX at $85, market makers will mechanically sell into any IGV rally that approaches this level. Breaking above $85 requires sustained institutional buying — it won't happen on light volume. Watch this level carefully.
-
🌍 Rate sensitivity cuts both ways: IGV is a high-multiple growth sector. A surprise Fed hike, hot CPI print, or "higher for longer" language could re-crush software multiples just as they're recovering. The same rate sensitivity that will propel IGV higher if the Fed cuts can pull it back fast if they don't.
-
📊 Concentration risk from Palantir: Palantir is now the #2 holding at 8.77%. If PLTR reverses from its government AI contract surge — either from budget cuts, contract disputes, or valuation compression — IGV takes the hit disproportionately. Palantir is not a typical SaaS stock and its presence changes the risk profile.
-
🤔 The STC doesn't mean "buy now": The institution closing their short is bullish context, but they may have simply been managing risk at a neutral-to-slightly-bullish read, not necessarily predicting a moonshot. The close of a short call is NOT the same as buying calls. Don't over-extrapolate.
-
❗ Vol at $90 strike remains elevated: The $90 strike has the highest call gamma on the entire board (57.2 GEX). Even with the short closed, there's still 68K open interest here. Market maker hedging at $90 will create mechanical resistance if IGV approaches — it will take real force to get through.
-
💰 Macro deterioration wildcard: IGV holds 119 companies across the full software spectrum. A hard economic landing in 2026 would hit enterprise IT budgets broadly — no single strong holding saves the fund from a sector-wide spending slowdown.
🎯 The Bottom Line
Here's the deal: Someone just paid $12.8 million to buy freedom. They had been capping their upside on software at $90 — betting the "SaaSpocalypse" would keep IGV down through May. Today, they paid $2.32 per share to tear up that bet.
What changed their mind?
- 📅 Microsoft Build conference is in May — right at expiration
- 📊 Salesforce earnings in late May — same window
- 🧠 Analyst community shifting from "AI kills software" to "AI monetizes software"
- 📐 The May implied move upper range ($90.11) puts $90 squarely in play
- 🔑 IGV's 29% selloff may have been overdone — and the smartest money on the board just bet on that reversal
If you own IGV or related software names:
- ✅ The STC trade is a bullish signal — don't panic out of existing positions
- 📊 Watch the $85 gamma wall next — that's the first hurdle
- ⏰ The real test is Microsoft Build in May. Mark your calendar.
If you're watching from the sidelines:
- 🎯 Look for a pullback toward $82–$84 gamma support as a lower-risk entry
- 📅 The bull call spread ($85/$90) is the cleanest way to express the same directional view as the closing institution — defined risk, bounded reward
- ⚠️ Don't chase a breakout above $85 without a clear catalyst — the gamma resistance is real
If you're bearish:
- 📉 $80 is the critical gamma support (26.9 GEX). Below that, the next floor is $75.
- 🎯 Only get short on a confirmed break below $84 with volume — don't fight the tape before earnings
Key dates to watch:
- 📅 March 20 — Weekly/Triple Witch OPEX (±$2.93 implied move this week)
- 📅 April 17 — Monthly OPEX ($79.89 – $88.44 range)
- 📅 May 2026 — Microsoft Build Conference (exact date TBD)
- 📅 May 15, 2026 — Monthly OPEX / Expiration of the $90 calls that were just closed
- 📅 Late May/Early June 2026 — Salesforce Q1 FY2027 earnings
Final take: The institution paying $12.8M to escape their $90 short cap is a rare, high-conviction signal that someone believes the "SaaSpocalypse" is fading. They didn't close because they were wrong — they closed because they saw the future and didn't want to miss it. That's the trade story here. 💪
Disclaimer: Options trading involves substantial risk of loss and is not suitable for all investors. This analysis is for educational and informational purposes only and does not constitute financial advice or a recommendation to buy or sell any security. The unusual activity described reflects one institution's risk management decisions, which may differ materially from the needs of retail traders. Past unusual options activity does not guarantee future price movement. ETFs like IGV can lose value and there is no guarantee of principal. Always conduct your own due diligence and consider consulting a licensed financial advisor before making investment decisions. The STC (close short call) classification is based on volume-to-OI analysis and represents the most probable interpretation; actual trader intent cannot be confirmed with certainty.
About iShares Expanded Tech-Software Sector ETF (IGV): IGV provides targeted exposure to 119 U.S. software companies, tracking the S&P North American Expanded Technology Software Index. Top holdings include Microsoft, Palantir, Oracle, Salesforce, and Palo Alto Networks, with an expense ratio of 0.40%. The fund is managed by BlackRock's iShares and is one of the most widely traded software sector ETFs.