🇮🇳 INDA Whale Sells $1.6M in Calls — A Giant India Holder Just Put a Ceiling on Their Position!
📅 March 10, 2026 | 🔥 Unusual Activity Detected
🎯 The Quick Take
Someone with a massive INDA position just collected $1.6 MILLION in premium this morning by selling 10,939 call contracts at the $52 strike expiring June 18th — and the fact that the prior open interest at that strike was only 24 contracts tells you everything. This isn't a random bet — this is a large institutional INDA holder capping their upside at $52 while pocketing income on a position they fully own. Translation: A big fish thinks INDA is going to grind sideways-to-slightly-higher, and they're getting paid to wait.
📊 Company Overview
INDA — iShares MSCI India ETF is BlackRock's flagship India equity fund — the go-to vehicle for institutional and retail investors wanting exposure to the world's fastest-growing major economy:
- AUM: >$9 billion (largest and most liquid India-focused ETF in the US)
- Expense Ratio: 0.61%
- Index Tracked: MSCI India — ~65 large/mid-cap Indian companies
- Current Price: ~$50.05 (down -8.3% YTD from $54.56 start-of-year)
- Industry: Diversified India Equity ETF
Top Holdings:
- 🏦 HDFC Bank Ltd (~7.99%) — India's dominant private bank
- ⚡ Reliance Industries (~6.78%) — India's largest conglomerate (telecom, retail, energy)
- 🏦 ICICI Bank Ltd (~5.03%) — #2 private bank
- 📡 Bharti Airtel (~3.83%) — Major telecom operator
- 💻 Infosys (~3.81%) — Global IT services giant
Sector breakdown: Financials dominate at 29.45%, followed by Consumer Discretionary (13.34%), IT (9.34%), Industrials (9.13%), and Energy (8.70%).
💰 The Option Flow Breakdown
📊 The Tape (March 10, 2026)
| Date | Time | Symbol | Buy/Sell | Call/Put | Expiration | Strike | Volume | OI | Size | Spot | Option Price | Premium | Option Symbol |
|---|---|---|---|---|---|---|---|---|---|---|---|---|---|
| 2026-03-10 | 09:56:02 | INDA | SELL | CALL | 2026-06-18 | $52 | 11K | 193 | 10,939 | $49.95 | $1.44 | $1.6M | INDA20260618C52 |
🤓 What This Actually Means
Let me break this down because the details here are WILD:
- 🐋 Z-score: 460.22 (EXTREMELY UNUSUAL) — That's roughly 460 standard deviations above normal. A trade this size shows up maybe a few times a year in INDA options.
- 📊 Volume vs OI: 10,939 contracts vs. 24 prior open interest — The $52 strike had essentially ZERO activity before this morning. Someone opened a completely fresh 11K-contract covered call position in one shot.
- 💸 $1.6M collected upfront: At $1.44 per contract × 10,939 contracts × 100 shares = $1,575,216 in premium received immediately.
- 📅 100 days to June expiration: Long enough to collect meaningful premium while keeping duration manageable through the next wave of India catalysts.
- 🎯 Strike 4% above spot: The $52 strike is ~4% above today's $49.95 — they're capping their upside there while collecting income on the ride.
What's really happening here:
This is a covered call (buy-write) income overlay on a large existing INDA position. The seller already owns (or is simultaneously buying) millions of dollars worth of INDA shares, and they're layering on this call sale to generate income while they hold. It's the same strategy a retiree might use on Apple stock — except this is institutional-scale. Think of it like renting out a room in your house: you're still in the house (long INDA), but you're collecting rent ($1.6M) and agreeing to let the renter buy your house at $52 if they want to.
The fact that the $52 OI was 24 contracts (representing just 2,400 shares) before this trade means NO ONE was positioned at that strike — this whale picked a clean, unleveraged strike to anchor their income strategy. With INDA at $50.05 and the $52 strike, they're saying: "I'm fine holding through June. If INDA runs to $52, I'll happily sell my shares there. In the meantime, I'll pocket $1.6M." That's not bearish. That's confident and income-driven.
Unusual Score: 🔥 EXTREME (460x z-score) — The raw Volume/OI ratio here is 455:1 at a strike with near-zero prior positioning. This happens a few times a year in INDA options and almost always signals a large holder executing a systematic income program on their book.
📈 Technical Setup / Chart Check-Up
YTD Performance Chart
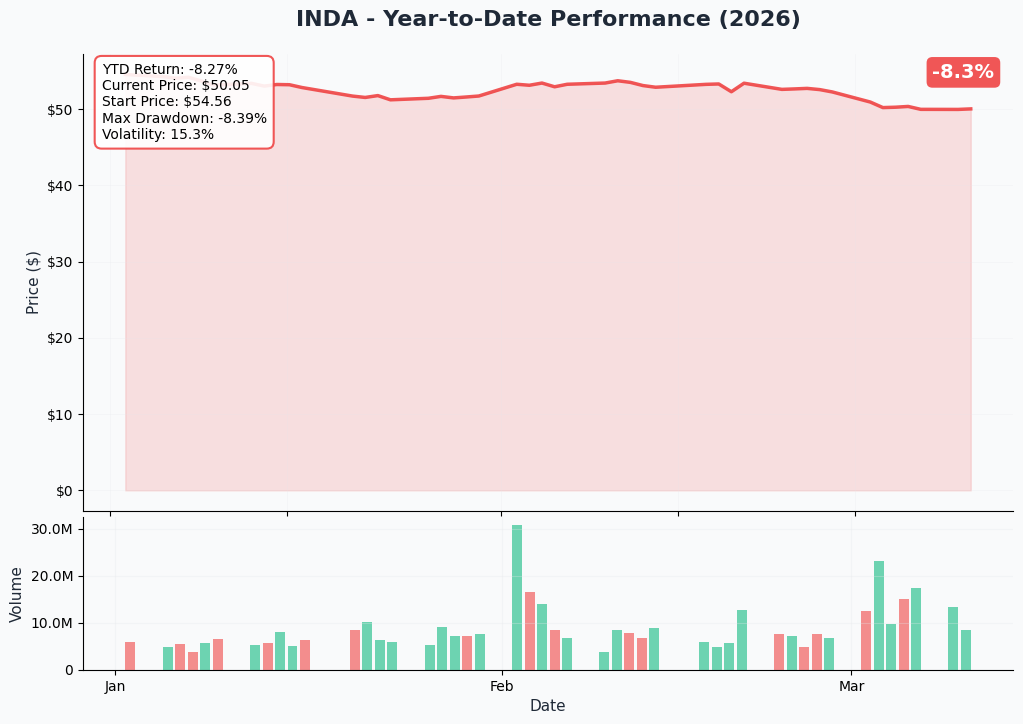
INDA opened 2026 at $54.56 and has steadily ground lower, sitting at $50.05 today — a -8.3% YTD decline with a max drawdown of -8.39%. The chart shows a clear distribution pattern: INDA peaked around $54-$55 in late January/early February (likely the initial pop from the US-India trade deal announced January 27), then sold off as global risk-off pressures and EM outflows reasserted themselves through February and into March.
Key observations from the chart:
- 📉 Steady bleed, not a crash: Price has drifted lower gradually — 15.3% annualized volatility is modest for an EM ETF, which means this isn't panic selling
- 📊 Volume spikes in February: Large green volume bars around early February correspond to the US-India trade deal reaction (Nifty 50 +2.5%) — the smart money bought the announcement
- 📈 March volume picking up: Green volume bars are increasing again in early March, suggesting buyers are stepping back in near current levels
- 🎯 $50 is the battleground: Price has been consolidating right around the $50 psychological level — today's covered call at $52 confirms the seller thinks we stay in this $49-$52 range through June
Gamma-Based Support & Resistance Analysis
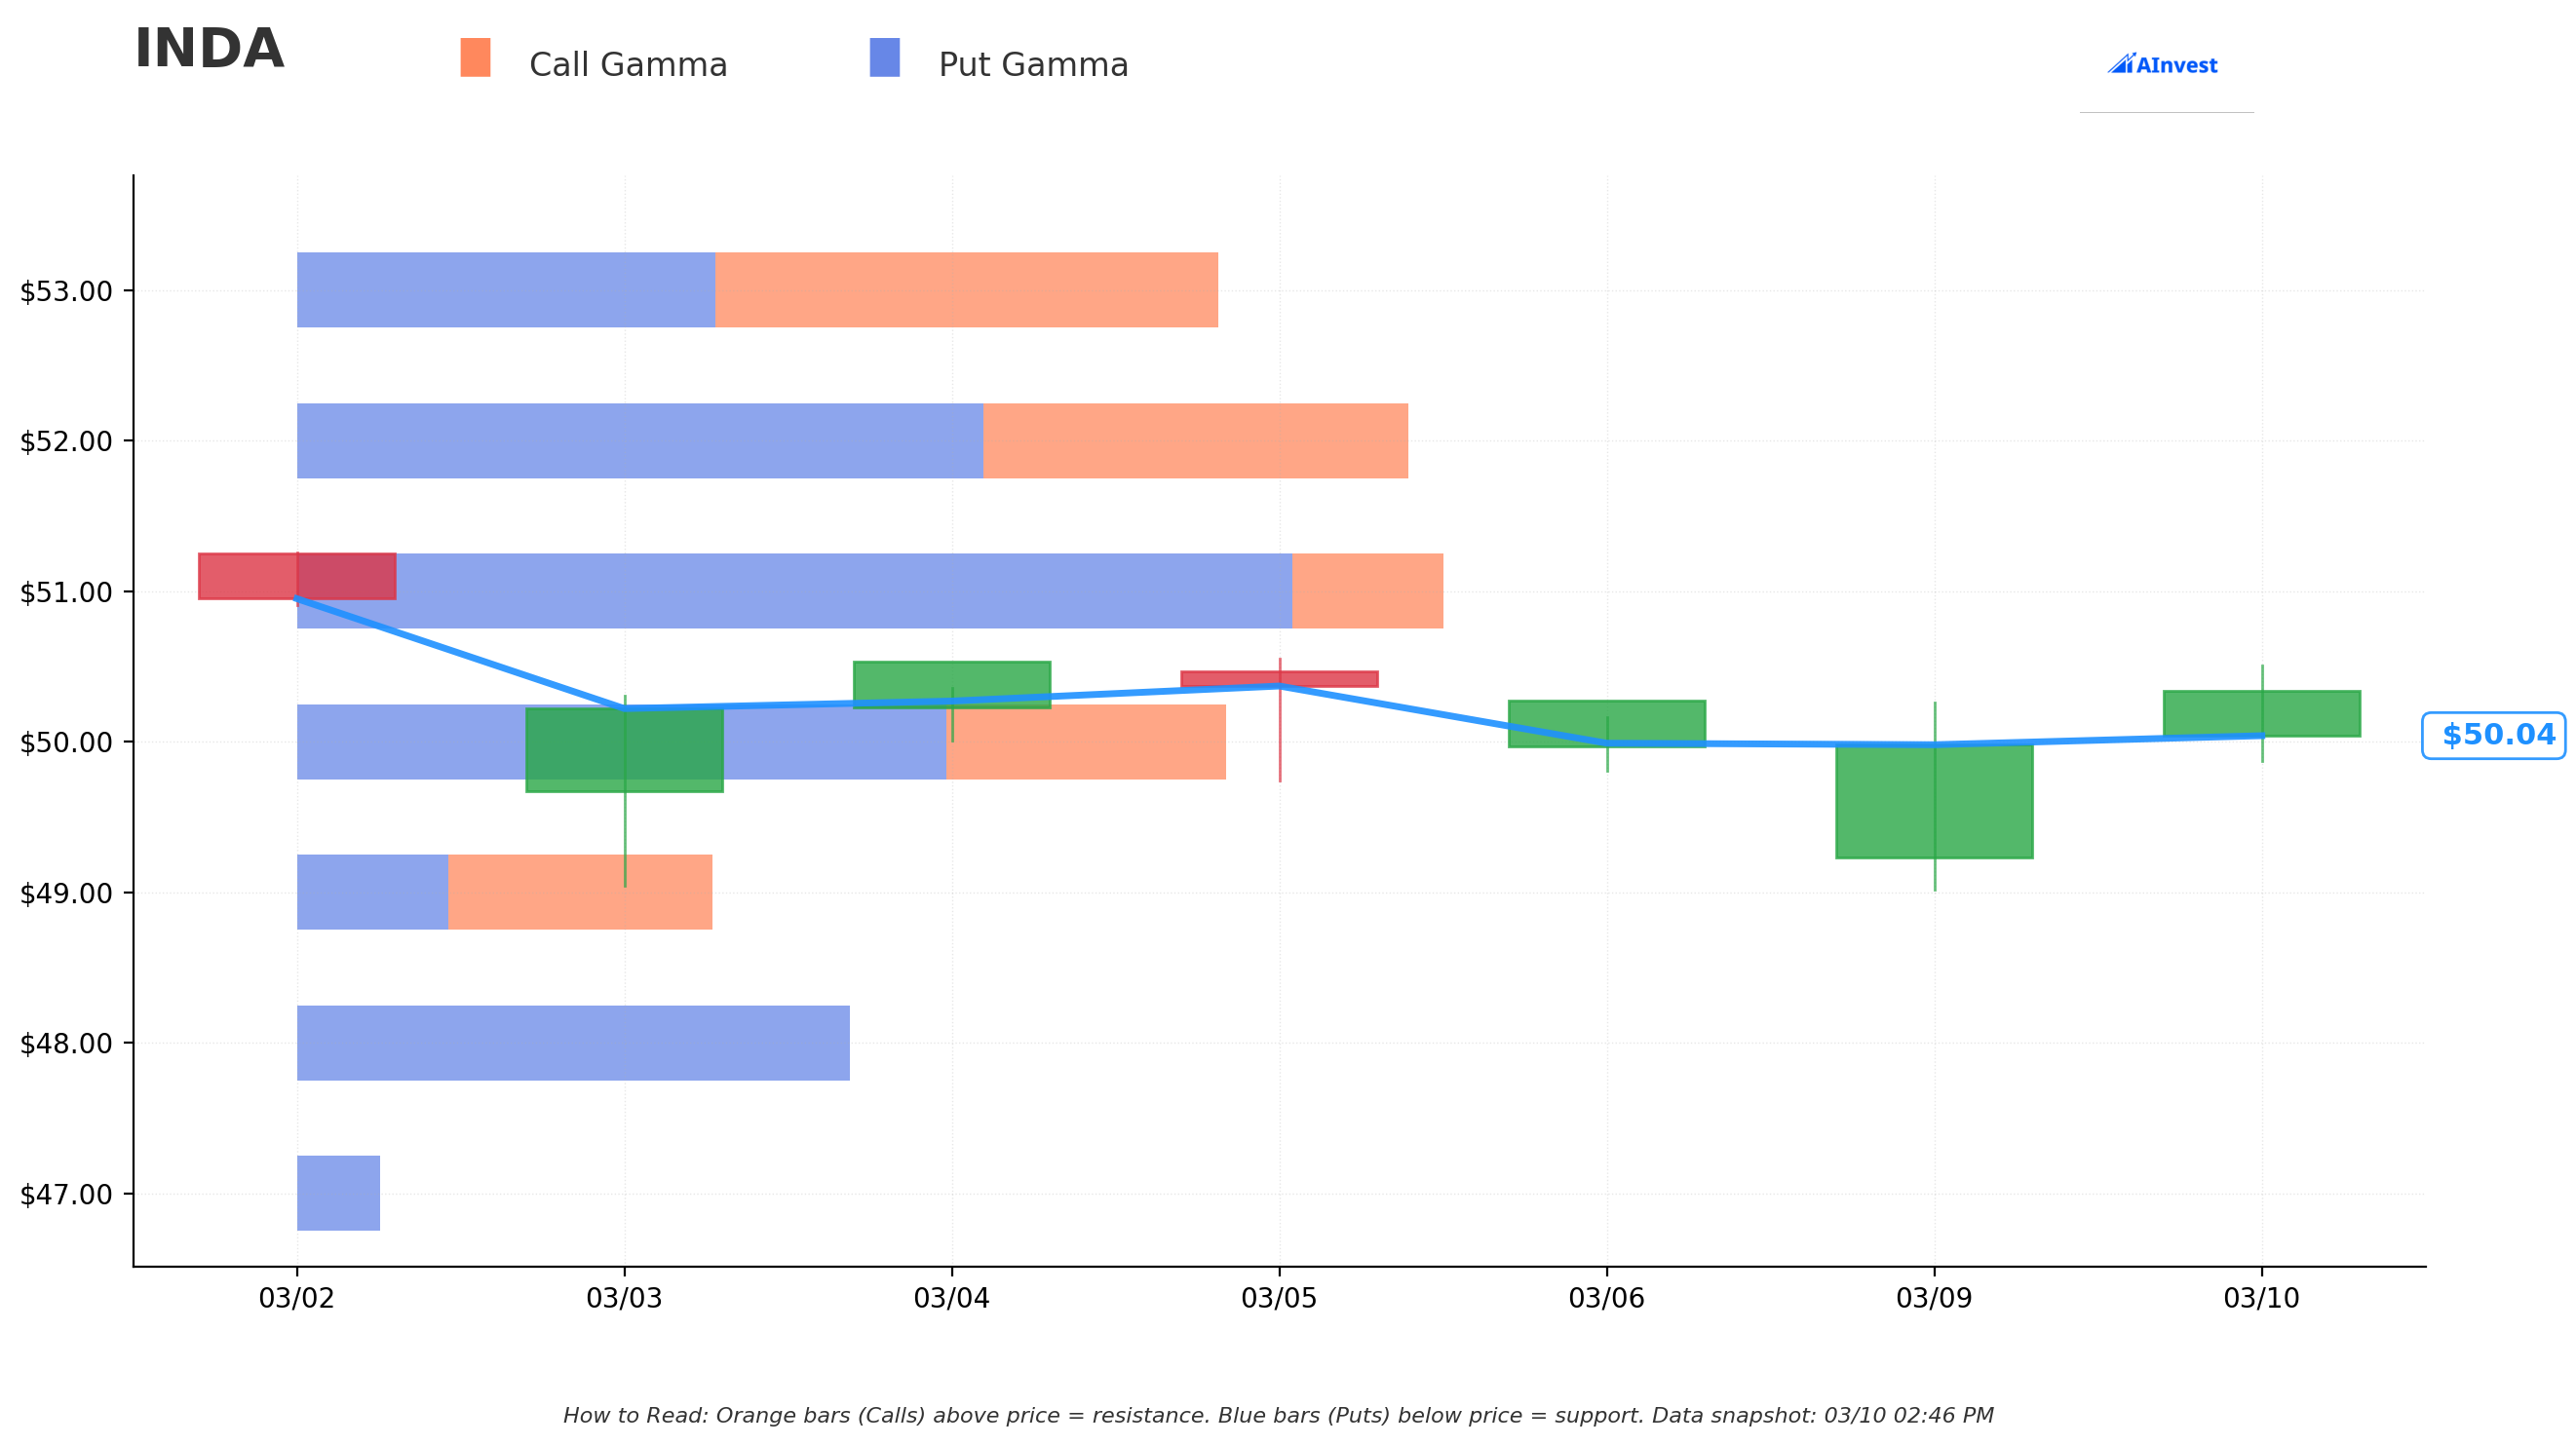
Current Price: $50.04
The gamma exposure map reveals exactly where market makers have concentrated options inventory — and it paints a tight, well-defined trading range:
🔵 Support Levels (Put Gamma Below Current Price):
- $50 — Major immediate support with significant put gamma (dealers must buy shares here if price dips, creating a natural floor)
- $49 — Secondary support level with meaningful put exposure
- $48 — Substantial put gamma acting as a deeper demand zone (one of the largest blue bars on the chart)
- $47 — Extended support at the lower range boundary
🟠 Resistance Levels (Call Gamma Above Current Price):
- $51 — First overhead resistance; meaningful call gamma concentration means dealers will sell into rallies here
- $52 — CRITICAL level — the largest call gamma bar on the entire chart, and now FRESHLY reinforced by today's 10,939-contract sale. This strike just became the dominant pin zone for June expiration.
- $53 — Additional resistance with mixed call/put gamma above
What this means in plain English:
INDA is essentially pinned in a $50-$52 box right now. The $50 strike has dense put gamma underneath providing buying support if the ETF dips, and the $52 strike — just massively reinforced by today's whale trade — creates a hard ceiling from call gamma selling pressure above. Today's covered call sale didn't just reflect the current levels — it created them. When a single trader sells nearly 11,000 contracts at one strike, market makers who bought those calls will now actively sell INDA shares as the price approaches $52 to stay delta-neutral. That's a self-fulfilling resistance level.
Net GEX Bias: Bullish — Overall gamma positioning favors upside stability. The $50 put support floor is structural. Price is likely to oscillate in the $50-$52 corridor into OPEX.
Implied Move Analysis
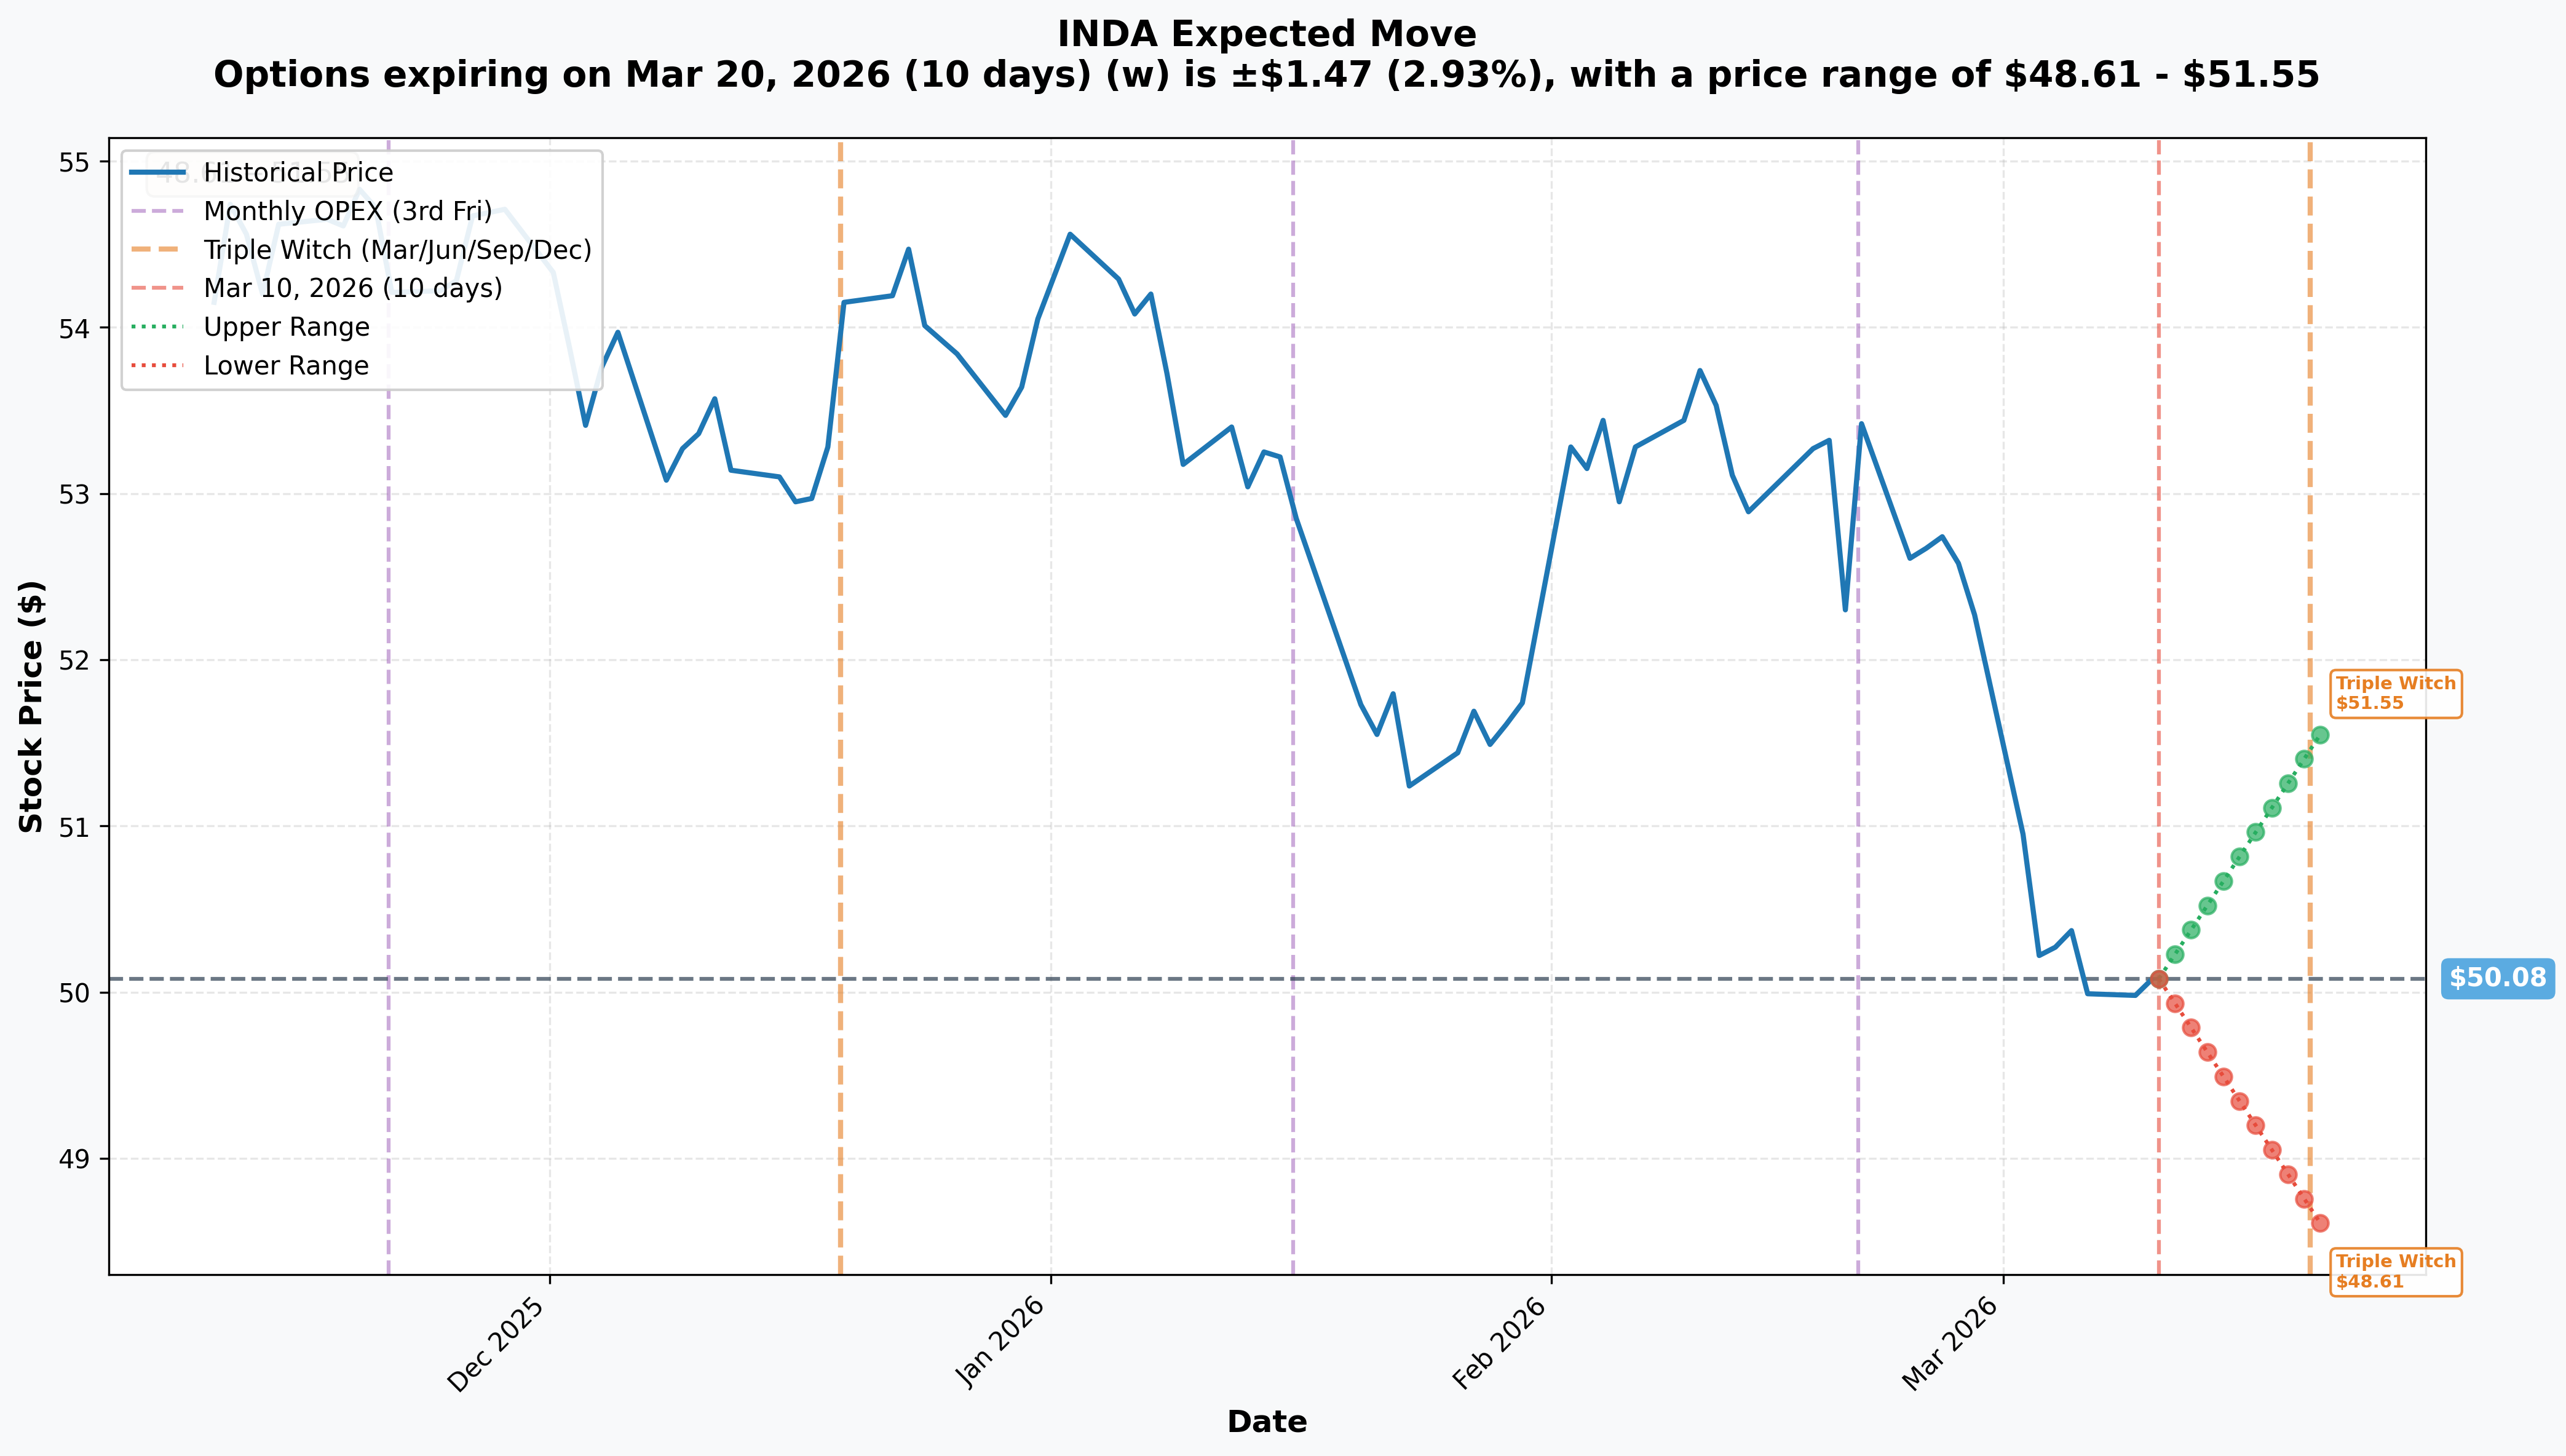
Options market pricing for upcoming expirations:
- 📅 Monthly OPEX (March 20 — 10 days): ±$1.47 (±2.93%) → Range: $48.61 - $51.55
Translation for regular folks:
The market is expecting INDA to stay within a $48.61 to $51.55 band through next Friday's March 20th options expiration. That's about a 3% move in either direction over the next 10 days. Given INDA's current 15.3% annualized volatility, this is a pretty well-behaved expected range — nothing explosive is priced in for the immediate term.
What's notable: the upper implied move boundary ($51.55) is almost exactly at the $52 strike where our whale just sold all those calls. They're positioned to collect full premium if INDA stays below $52 through June — and even the options market only expects a maximum ~3% upside move over the next 10 days. The June expiration gives them 100 days of runway with a 4% buffer above current price. This is methodical premium collection, not a panic hedge.
🎪 Catalysts
🔥 Past Catalysts (Already Happened — Repricing the Story)
US-India Trade Deal Finalized — January 27, 2026 🇺🇸🤝🇮🇳
The blockbuster catalyst: the US cut reciprocal tariffs on Indian goods from 25%+ down to 18%, completing a bilateral trade framework. India's Nifty 50 surged 2.5% on February 3rd in direct reaction, with Adani Enterprises +10.6%, Adani Ports +9.2%, Jio Financial +8.1%. This makes India meaningfully more competitive vs. China (25%+ tariff) for US-bound manufacturing exports — a structural multi-year tailwind for INDA's industrials and consumer holdings.
EU-India Free Trade Agreement — January 27, 2026 🇪🇺
India and the EU simultaneously finalized a long-negotiated free trade agreement on the same day as the US deal. Per Seeking Alpha's coverage, reduced EU tariffs on Indian manufactured goods and IT services provides an additional export demand channel. The dual US+EU trade deal arrival represents an extraordinary positive double-catalyst that has been partly priced in but not fully digested by the market.
RBI Rate Cut Cycle — Ongoing
The Reserve Bank of India cut its repo rate to 5.25% in December 2025 and paused in February 2026. Per ING Think's analysis, markets are pricing another 25-50 bps of cuts in 2026. With India's CPI inflation at a record-low 1.33% (well below the 4% RBI target), the easing cycle has room to continue — a direct tailwind for INDA's 29.45% financials weight (HDFC Bank, ICICI Bank benefit from falling funding costs and NIM expansion).
India GDP Growth 8.2% — Q2 FY2026
India's real GDP grew 8.2% in July-September 2025, with the RBI projecting 7.4% full-year FY2026 growth. India is the world's fastest-growing major economy — and the 2025 underperformance in INDA (-4.29% vs. MSCI EM +33.57%) has created a wide gap between fundamentals and price that institutions are starting to arbitrage.
🚀 Upcoming Catalysts (Next 90 Days)
RBI MPC Meeting — Expected ~April 9, 2026 📊
The next Reserve Bank of India Monetary Policy Committee meeting is the most actionable near-term catalyst. With inflation at 1.33% and trade deals boosting the export outlook, ING Think models another 25 bps cut (to 5.00%) as the base case. A rate cut would directly lift INDA's dominant financial sector holdings and reduce borrowing costs for India's consumer and infrastructure companies.
India-US Trade Deal Implementation Details — March–June 2026 🏭
The January 27 framework is now being converted into actual tariff schedules and sector-specific rules. Per India Briefing, any positive announcement on electronics (Apple/Foxconn iPhone production), pharmaceuticals, or textiles implementation timing could trigger a quick pop in INDA. These announcements are unpredictable but directionally positive.
Reliance Industries Q4 FY2026 Earnings — ~April 2026 💰
Reliance (6.78% of INDA) reports quarterly results around April. With Jio's 490M+ subscriber 5G monetization ramp, Reliance Retail's expansion, and the green energy buildout tracking toward 100GW targets, a strong Reliance quarter would directly lift INDA's NAV. The covered call seller is likely aware that Reliance earnings fall comfortably within their June 18th expiration window — one more reason they priced the $52 strike rather than $51.
MSCI India Index Semi-Annual Review — May 2026 📈
MSCI's May semi-annual review may increase India's weight in the MSCI EM index (currently ~12.5%). Any weight increase triggers automatic passive buying from every EM-tracking ETF and fund globally — a mechanical, non-discretionary inflow that would bid INDA shares directly. Per Goldman Sachs' India 2026 outlook, India's long-term structural case for increased index weight remains strong.
India GDP Q3 FY2026 Advance Estimate — ~March 2026 📊
India's National Statistical Office is expected to release October-December 2025 GDP data soon. A print above 7.4% would reinforce the growth narrative and attract fresh FII inflows back to Indian equities — precisely the tailwind that would lift INDA toward and above the $52 call strike where our whale is now positioned.
🎲 Price Targets & Probabilities
Using gamma levels, the March implied move band, and the catalyst calendar, here's how we see INDA through the June 18th expiration:
📈 Bull Case — 30% probability
Target: $52–$54
How we get there:
- 💪 RBI cuts again in April (25 bps to 5.00%) → banking sector re-rates higher
- 🏭 US-India trade deal sector specifics announced → electronics/pharma export stocks surge
- 🐉 MSCI weight increase in May triggers passive inflows
- 📊 Reliance Q4 beats expectations with strong Jio/Retail metrics
- 🌍 FII outflows reverse as India-EM rotation accelerates
- 📈 Break above $51 gamma resistance triggers momentum toward $52 (the gamma wall / call strike)
Catch: The covered call caps gains at $52. The whale collects $1.44 × 10,939 = $1.6M and sells their shares at $52. That's still a great outcome for them — they bought INDA lower. For everyone else, $52 is the likely ceiling until June 18th given the gamma pressure.
🎯 Base Case — 50% probability
Target: $49–$52 (RANGE-BOUND)
Most likely scenario:
- ✅ INDA drifts in the $49-$52 corridor — exactly within the implied move band
- 📊 Gamma support at $50 holds; gamma resistance at $51-52 limits rallies
- 🌐 Global macro backdrop stays choppy (tariff noise, EM sentiment volatile)
- 📅 Rupee stable, FII flows mixed — no strong directional catalyst to break the range
- 💤 Covered call expires worthless or near-worthless at June OPEX, seller pockets the $1.6M in full
- 🏦 India's fundamentals remain solid but market waits for April RBI meeting and MSCI review as confirmation
This is EXACTLY what the covered call seller is counting on. INDA stays in the range, they collect full premium, they continue holding their long position. Classic income overlay execution.
📉 Bear Case — 20% probability
Target: $47–$49 (RETEST LOWS)
What could go wrong:
- 😰 Global EM selloff intensifies — dollar strengthens, all EM assets get hit
- 💱 Indian Rupee depreciates sharply, reducing USD returns for INDA holders
- 🇨🇳 Geopolitical escalation (India-China border, India-Pakistan tensions) triggers risk premium
- 📊 US-India trade deal implementation disappoints — sectors get narrower tariff relief than expected
- 🏦 FII outflows accelerate as India's 22-24x forward P/E premium becomes untenable in a risk-off environment
- 📉 Break below $49 put support → $48 next, then $47 (the gamma floor visible on the chart)
For the covered call seller: The bear case actually still works for them — they collected $1.6M upfront and their calls expire worthless. Their only pain is the underlying stock position falling, which they'd have with or without the covered call. The option trade is a net positive in ANY scenario except a strong rally above $52 where they miss the upside.
💡 Trading Ideas
🛡️ Conservative: The "Sleeping Bear" Cash-Secured Put at $49
The Play: Sell the INDA June 20, 2026 $49 put for approximately $1.00-$1.20 per contract
Why this works:
- 🎯 The whale just demonstrated institutional conviction on INDA — they own it large and are running an income overlay on it
- 💰 You collect income at a strike that aligns with major put gamma support ($48-$49 zone)
- 🛡️ If INDA drops to $49, you buy a fundamentally strong ETF at a 2% discount from today AND collected premium
- 📊 India's 7.4% GDP growth and RBI rate cuts provide fundamental floor — you're not catching a falling knife
- 🤝 You're essentially "copying" the whale's thesis (INDA stays supported above $49) but with less capital commitment
Numbers:
- 📈 Premium collected: ~$1.00-$1.20 per contract
- 🎯 Effective buy price if assigned: $47.80-$48.00
- 📉 Break-even: $48.00 (about 4% below today's price)
- ⏰ Time frame: 100 days (June OPEX)
Risk level: Moderate (you must be willing to own INDA at $47.80) | Skill level: Beginner-friendly | Strategy Name: "Buy India at a Discount"
⚖️ Balanced: The $50/$48 Bull Put Spread (Defined Risk)
The Play: Sell the INDA June $50 put and buy the INDA June $48 put as a spread
Why this works:
- 🎯 Targets the exact $48-$50 gamma support zone — you're selling at the "floor" the options market has established
- 💰 Collect net credit ~$0.60-$0.80 on a $2.00 wide spread
- 🛡️ Defined max loss of $1.20-$1.40 even if India completely falls apart
- 📈 No upside cap — if INDA rallies to $52 you keep full credit and benefit from any additional INDA exposure you hold
- ⚖️ Aligns with the implied move band — market says $48.61 is the lower boundary, and you're positioned to profit from exactly that scenario
Numbers:
- 💰 Net credit: ~$0.65 (example)
- 📈 Max profit: $65 per spread (if INDA above $50 at June expiration)
- 📉 Max loss: $135 per spread (if INDA below $48 — defined, capped loss)
- 🎯 Breakeven: $49.35 (~1.3% below current price)
- 📊 Probability of max profit: ~65%
Risk level: Moderate (defined risk) | Skill level: Intermediate | Strategy Name: "India Cushion Trade"
🚀 Aggressive: The $51/$53 Bull Call Spread (OPEX Momentum Play)
The Play: Buy the INDA April 17 $51 call and sell the INDA April 17 $53 call
Why this could work:
- 🚀 Bet that India's April catalysts (RBI cut, trade deal details, Reliance earnings) break INDA out of the $50-$52 range before the big covered call ceiling takes hold at June OPEX
- 💥 If INDA pops to $52-$53 on a surprise RBI cut or strong trade deal news, this spread doubles or triples
- 🎯 The whale capped June at $52 — but April has no such constraint yet
- 📊 You're positioned for the "early catalyst pop" before June's mechanical gamma ceiling kicks in
- ⏰ April 17th gives you 5 weeks to catch the RBI meeting and trade deal announcement cycle
Numbers:
- 💰 Net debit: ~$0.25-$0.35 per spread (cheap, limited loss)
- 📈 Max profit: $1.65-$1.75 per spread if INDA at $53 by April 17 (400-500%+ ROI)
- 📉 Max loss: Your $0.35 debit (defined, small)
- 🎯 Break-even: ~$51.35
- ⚠️ This requires a 2.5%+ move in INDA within 5 weeks — not guaranteed!
Risk level: High (likely expires worthless unless catalyst fires) | Skill level: Intermediate-Advanced | Strategy Name: "India Breakout Lottery Ticket"
IMPORTANT WARNING: Only size this 1-2% of portfolio. The base case is INDA stays range-bound and this spread expires worthless. This is a low-probability, high-reward satellite position — not a core holding.
⚠️ Risk Factors
Don't let the whale's confidence fool you — here's what could go wrong:
-
💱 Rupee risk is the silent killer: INDA's USD returns depend on USD/INR stability. The Rupee has been under pressure in 2025-2026 from FII outflows and dollar strength. Per ETFdb, a 3-4% rupee depreciation can completely wipe out INDA's local market gains for US investors. Watch USD/INR closely — it's the hidden variable the charts don't show.
-
🌍 FII outflows can overwhelm great fundamentals: Foreign Institutional Investors have been net sellers of Indian equities in late 2025 and early 2026 despite stellar GDP data. In EM markets, global risk appetite and dollar strength often matter more than local fundamentals in the short run. If the dollar spikes or global recession fears accelerate, INDA gets hit regardless of India's 7.4% growth rate.
-
🏷️ Premium valuation is an Achilles heel: India's Nifty 50 trades at 22-24x forward P/E vs. 12-13x for the broader MSCI EM universe. That's nearly a 2x premium. If global multiple compression hits (rising rates, recession), India's premium market gets hit hardest. INDA doesn't have the "cheap enough to ignore" defense that makes China or Brazil easier to hold through drawdowns.
-
📋 Trade deal implementation risk: The January 27 US-India and EU-India deals are frameworks — the detailed tariff schedules, rules of origin, and sector specifics are still being negotiated through the spring. Per India Briefing, if implementation proves narrower or slower than the initial announcement implied, the re-rating thesis fades and institutional buyers who loaded up in February become sellers.
-
🌏 Geopolitical tail risk: India has active border disputes with both China (Ladakh) and Pakistan. A serious flare-up in either theater would trigger immediate risk-off selling in Indian equities. These events are impossible to predict and tend to create sharp 5-10% dislocations in a single session. The covered call premium ($1.6M) looks small if INDA gaps down 10% on a geopolitical shock.
-
⚙️ The $52 ceiling is now structural: Today's covered call trade has created a significant mechanical headwind above $52. Nearly 11,000 contracts means market makers who are long those calls will delta-hedge by selling INDA shares as the price approaches $52. This creates a self-reinforcing ceiling that retail traders buying calls above $52 will be fighting against. The gamma chart confirmed it — $52 is now the dominant call gamma level on the board.
🎯 The Bottom Line
Real talk: A large institutional investor just told you exactly what they think about INDA through their actions today. They own a massive position, they're not selling it, and they're collecting $1.6M in premium by agreeing to sell at $52 in June. That's a confident "hold and collect" call, not a panic exit.
What this trade tells us:
- 🎯 The seller expects INDA to stay in the $49-$52 range through June 18th — and the gamma data confirms that's exactly where the options market sees the price anchored
- 💰 They're being paid to wait while India's macro catalysts (RBI cuts, MSCI rebalance, trade deal implementation) play out over the next 100 days
- 📊 The $52 strike is a deliberate ceiling — 4% OTM, above the near-term implied move, but within reach if April catalysts fire
- 🌏 Long-term, the US-India trade deal plus RBI easing cycle plus Goldman's India structural growth thesis give this position real fundamental legs
If you already own INDA:
- ✅ Consider running a similar covered call at $52 on your own shares — you're collecting income at the exact level a whale just validated as a reasonable ceiling
- 📊 Set your watch for April 9 RBI meeting and May MSCI review — those are the next two catalysts that could break this range upward
- 🛡️ Watch the $49-$50 gamma support zone — that's your line in the sand; if INDA cracks $48.61 (lower implied move boundary), reassess your thesis
If you're watching from the sidelines:
- 📅 The April 9 RBI meeting is your entry signal — a rate cut confirmation into the pullback gives you a fundamental catalyst to enter INDA on the way up
- 🎯 The $49-$50 zone (current gamma support + implied move base) is a reasonable accumulation area with defined downside to $47-$48
- ⏰ June 18th is not a hard deadline — the iShares MSCI India ETF structure continues indefinitely; the covered call just sets the near-term ceiling
If you're bearish:
- 🎯 The $48.61 lower implied move boundary is your first target; $48 gamma support is the next; $47 is the deeper floor visible on the gamma chart
- ⚠️ Shorting or buying puts against INDA into a confirmed rate cut cycle with dual US+EU trade deals is fighting multiple positive catalysts — make sure your macro thesis is solid before leaning against this one
Mark your calendar — Key dates:
- 📅 March 20, 2026 — Monthly OPEX (±2.93% implied move window closes)
- 📅 ~April 9, 2026 — RBI MPC Meeting (rate cut decision)
- 📅 ~April 2026 — Reliance Industries Q4 FY2026 earnings
- 📅 May 2026 — MSCI India Semi-Annual Index Review
- 📅 June 18, 2026 — Expiration of today's 10,939-contract covered call position
Final verdict: This is a high-conviction, income-driven institutional hold on INDA into a loaded catalyst calendar. The whale isn't betting India crashes — they're betting India grinds sideways-to-higher and they get paid $1.6M for their patience. That's a reasonable trade. India's fundamentals are genuinely strong; the near-term price action is being suppressed by global macro, not by anything broken in the India story. When the iShares fact sheet data shows 7.4% GDP growth, a rate cut cycle, and fresh trade deals — and the stock is down 8% YTD — the question isn't IF it recovers, it's WHEN.
The whale thinks when is after June 18th. Until then, $50-$52 is the range, and they're getting paid to wait. 🇮🇳
Disclaimer: Options trading involves substantial risk of loss and is not suitable for all investors. This analysis is for educational and informational purposes only and does not constitute financial advice, investment recommendations, or a solicitation to buy or sell any security. Past unusual options activity does not guarantee future price movement. The Z-score and unusual score metrics reflect this specific trade's size relative to historical INDA options activity — they do not imply the trade will be profitable or that retail traders should follow the same strategy. Covered calls limit upside but do not eliminate downside risk on the underlying position. Always conduct your own research and consider consulting a licensed financial advisor before trading options. ETF investments involve market risk including possible loss of principal. India-specific risks including currency (USD/INR), geopolitical, and emerging market volatility may cause significant price fluctuations.
About iShares MSCI India ETF (INDA): BlackRock's iShares MSCI India ETF is the largest and most liquid India-focused equity ETF in the United States, tracking approximately 65 large and mid-cap Indian companies across the MSCI India Index. With over $9 billion in AUM and a 0.61% expense ratio, INDA serves as the institutional benchmark for US-based investors seeking exposure to India's fast-growing economy — the world's most populous nation with projected 7%+ annual GDP growth through the late 2020s.