🐋 IWM $5M LEAP Call Sell -- Someone Is Capping Their Upside at $300!
📅 March 4, 2026 | 🔥 Unusual Activity Detected
🎯 The Quick Take
Someone just sold 2,500 IWM December 2027 $300 calls and collected $5M in premium -- right as tariffs officially hit and small caps are testing key support. The volume (2,500 contracts) actually exceeds existing open interest (2,300), giving this trade an extremely unusual z-score of 12.63. This is a classic institutional covered call overlay on a massive Russell 2000 position -- they're willing to cap gains at $300 (~14.5% upside) in exchange for $5M in cash cushion right now.
💰 The Option Flow Breakdown
📊 What Just Happened
| Detail | Value |
|---|---|
| 🕐 Time | 10:23:16 ET |
| 📍 Symbol | IWM |
| 📊 Side / Direction | MID / SELL |
| 📞 Contract | CALL $300 strike |
| 📅 Expiration | 2027-12-17 (~21 months out) |
| 📦 Size | 2,500 contracts |
| 💵 Premium Collected | $5M ($20.04 per contract) |
| 📈 Spot Price | $261.97 |
| 🔢 Volume vs. OI | 2,500 vs. 2,300 (108.7% ratio) |
| 🔥 Z-Score | 12.63 -- EXTREMELY UNUSUAL |
| 🏷️ Strategy | Short Call (new position -- STO) |

🤓 What This Actually Means
Let me break this down. This trader sold LEAP calls 21 months out at a $300 strike -- that is 14.5% above where IWM is trading right now. Here is why this matters:
🐋 This is almost certainly a covered call overlay. The notional underlying exposure is ~$65.5M (2,500 contracts x 100 shares x $262). That lines up with an institutional portfolio manager -- think pension fund, endowment, or large RIA -- who holds a big IWM position and is monetizing the elevated implied volatility (currently at the 76th percentile).
💰 $5M in collected premium = a 7.6% cushion. By selling these calls at $20.04 each, the seller effectively lowers their cost basis by ~$20 per share. That means IWM could drop to ~$242 before they start losing money on the combined position. For context, the 200-day moving average sits around $243-248 -- so they have built-in protection right down to major support.
📈 The $300 cap is not aggressive. IWM hit an all-time high of $269.79 on January 22. Getting to $300 would require a 14.5% rally from here. That is achievable over 21 months, but the seller is betting that small caps will not rip that hard -- or they are happy to get called away at $300 and keep the $5M.
🎯 Why now? The timing is deliberate. Tariffs on Canada, Mexico, and China just went into effect today, and IV is elevated at the 76th percentile. Selling calls when options are expensive is textbook premium harvesting. This trader is turning uncertainty into income.
📈 Technical Setup / Chart Check-Up
YTD Price Action
IWM has had quite the year so far. The ETF surged to an all-time high of $269.79 in January on the "Great Rotation" into small caps, then pulled back ~5-6% on tariff fears. As of this morning, it is trading around $262 -- right at the 50-day moving average.
The chart tells the story clearly: a strong uptrend over the past year (up from ~$180 to $262), but the recent pullback from the January highs is testing whether buyers will step up.
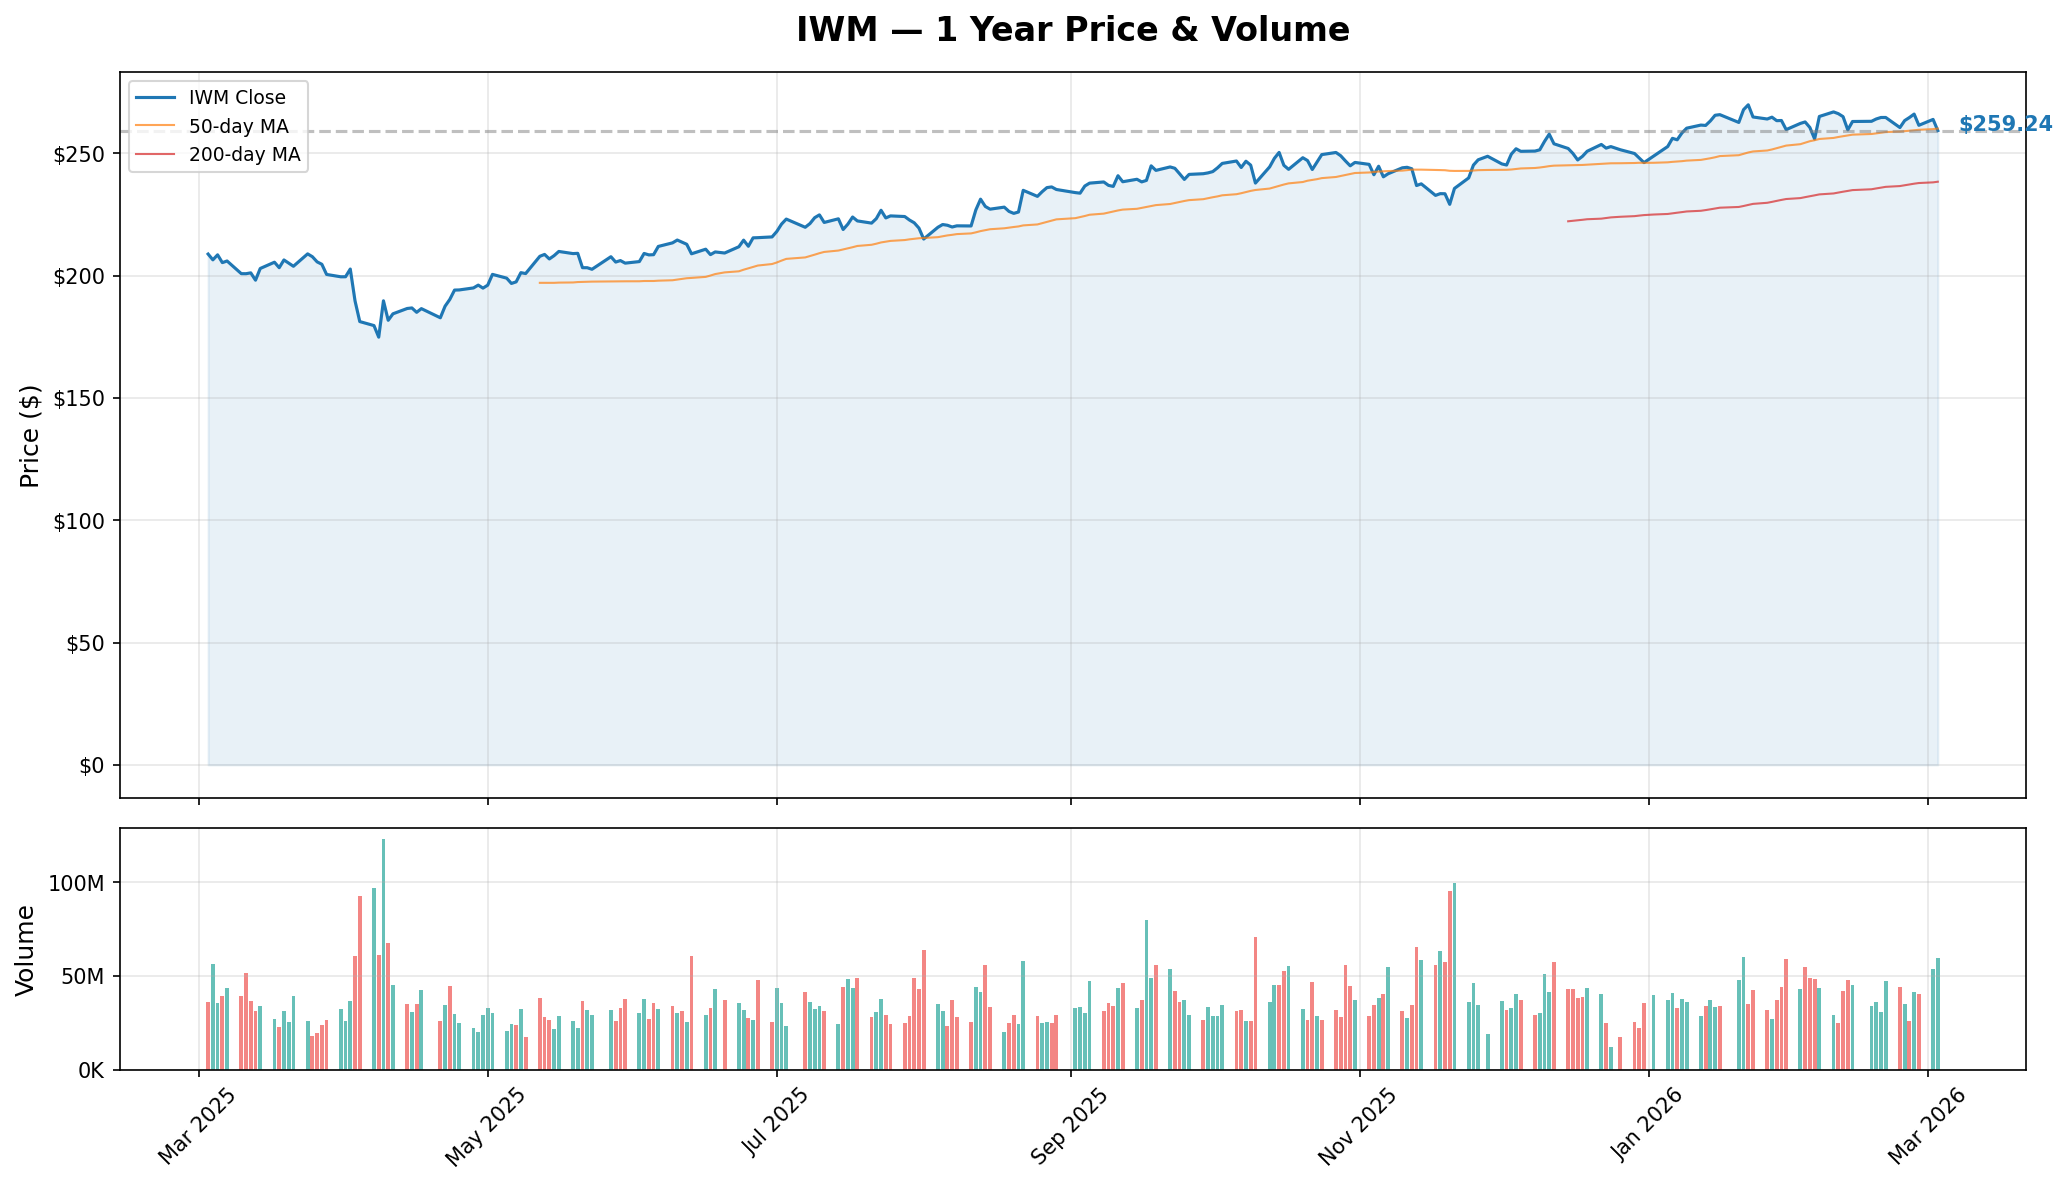
Key Levels to Watch:
- 🟢 50-day MA (~$258-262): IWM is sitting right on this level. A hold here keeps the intermediate uptrend intact
- 🟢 200-day MA (~$243-248): The "line in the sand." A break below this level shifts the narrative from "buy the dip" to "risk-off"
- 🔴 All-time high ($269.79): First major resistance overhead. A break above reignites the rotation trade
📊 Gamma-Based Support & Resistance Analysis
The gamma chart shows where the biggest options positioning sits -- think of these as magnets that can pull or push price.
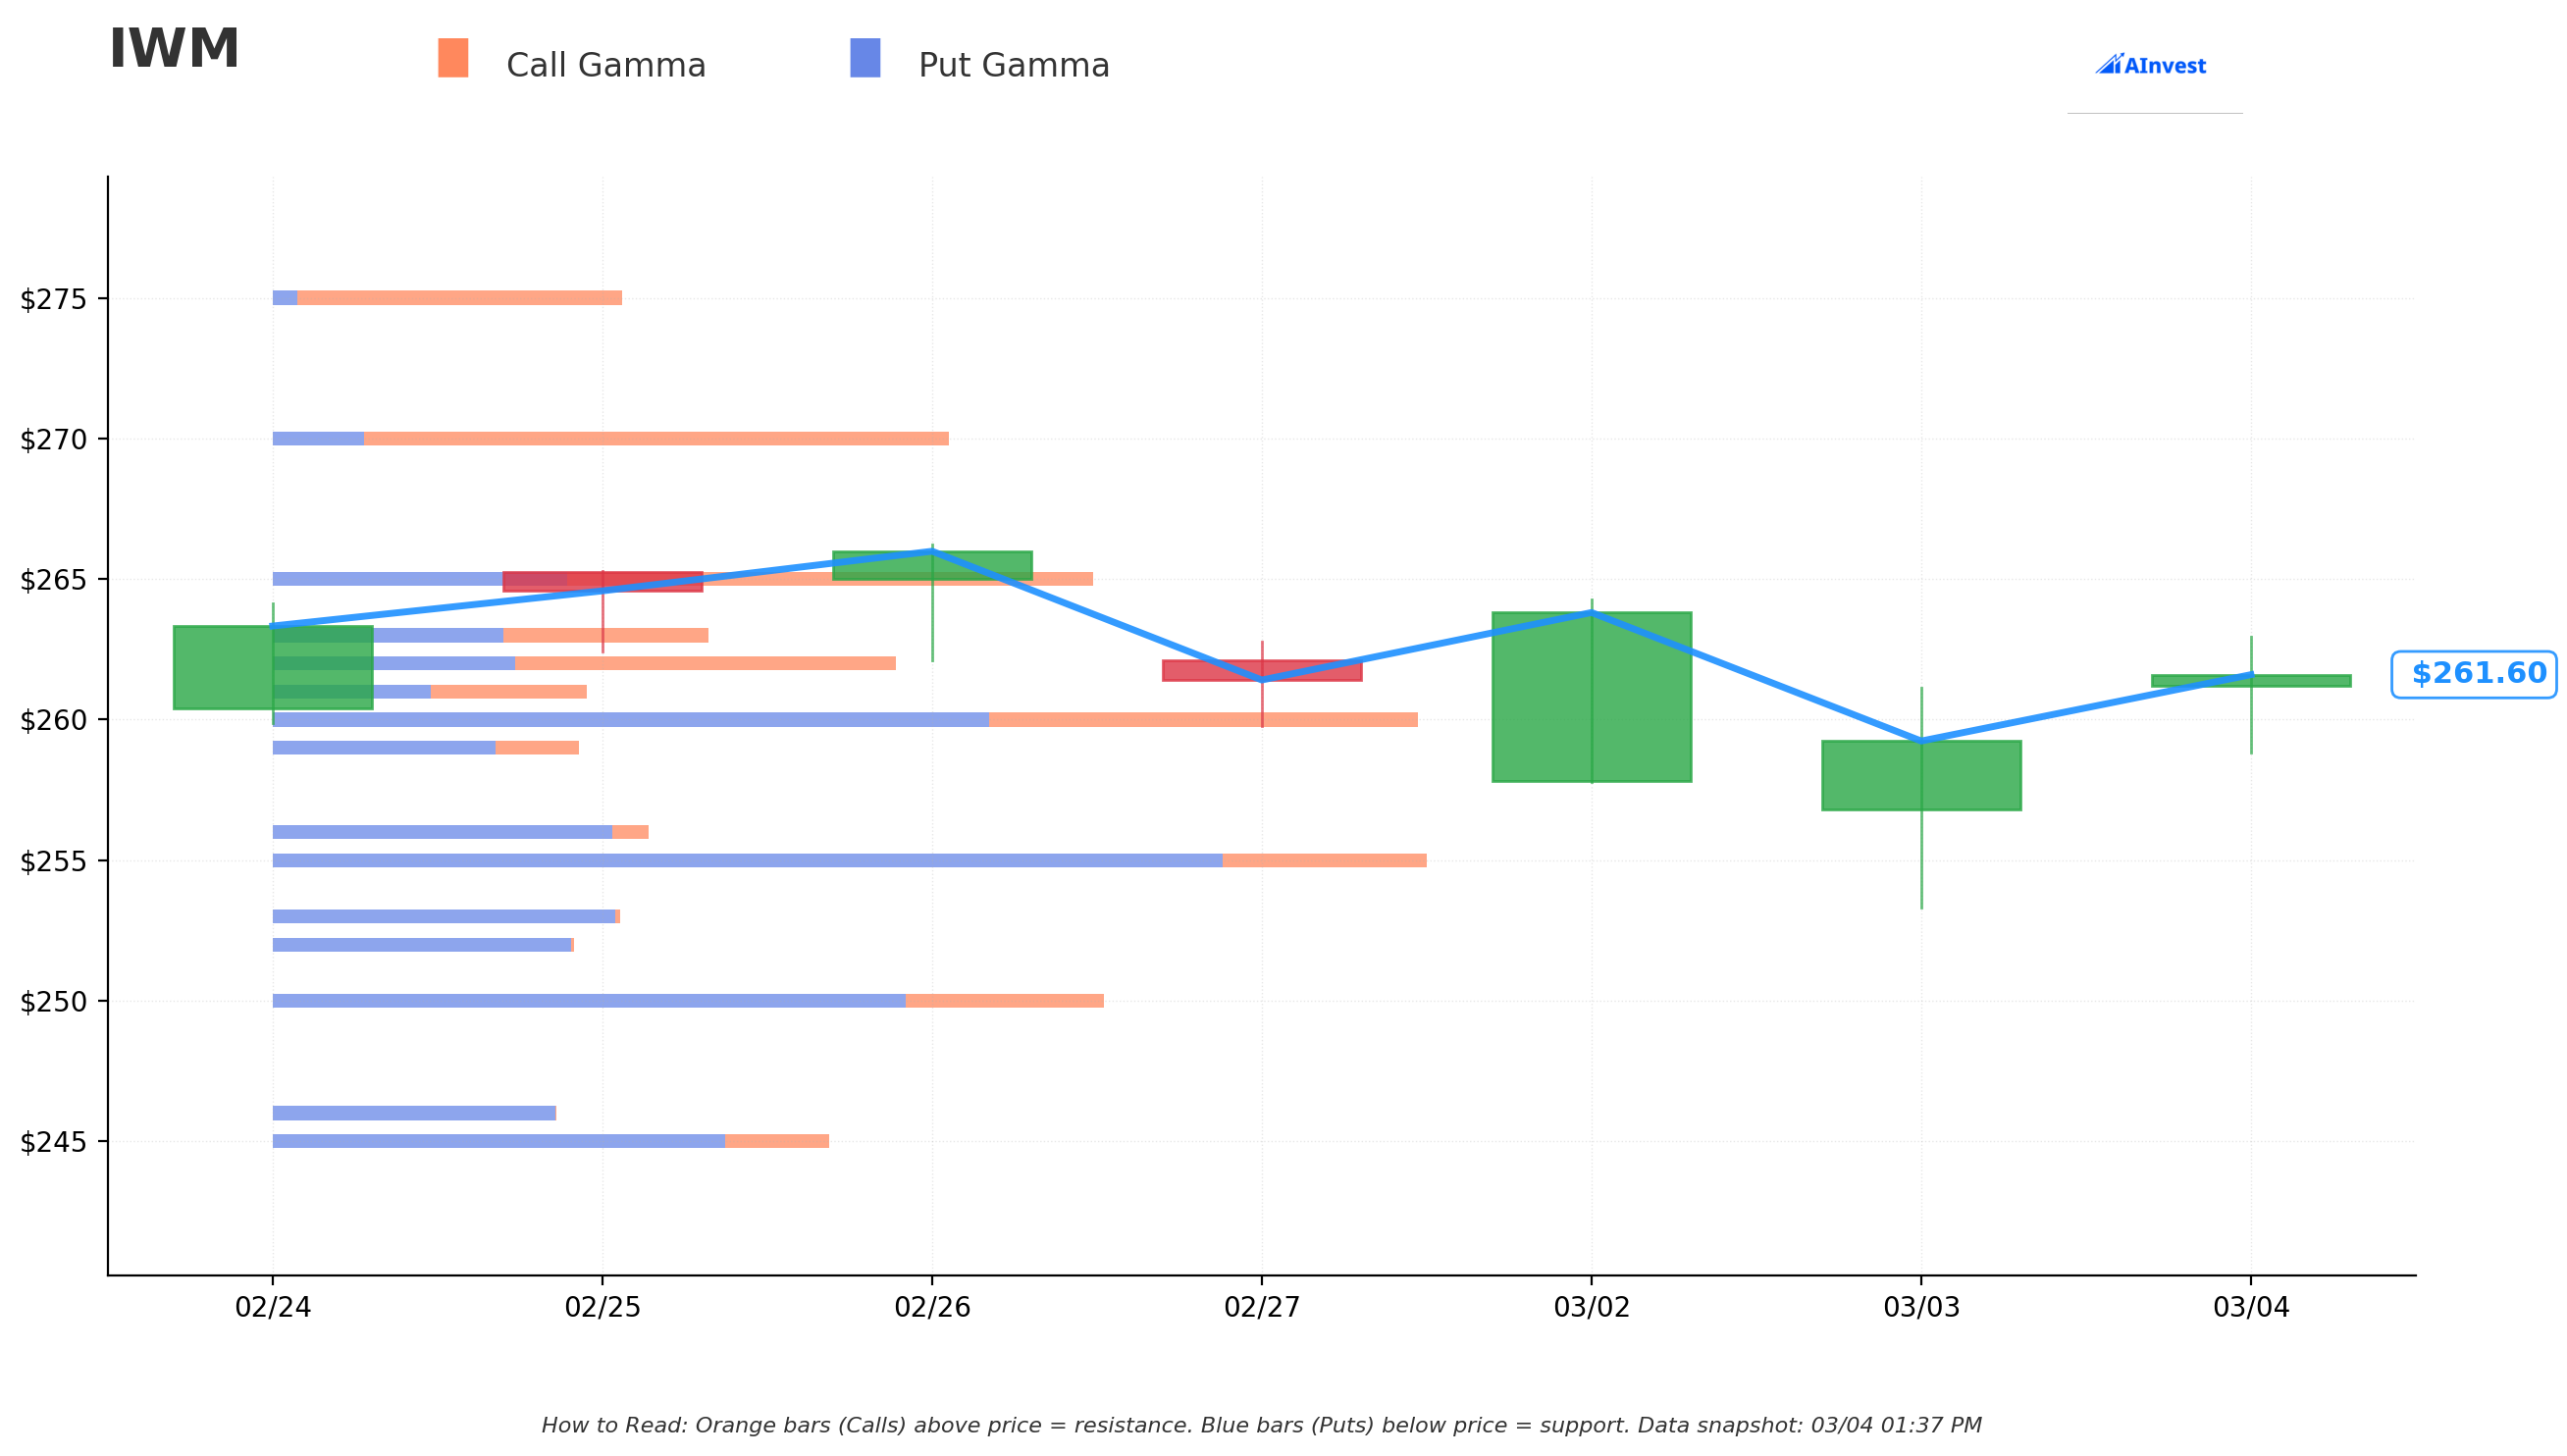
Reading the Chart:
- 🔵 Blue bars (Put Gamma) = Support levels below current price. These act as floors where selling pressure gets absorbed by market maker hedging
- 🟠 Orange bars (Call Gamma) = Resistance levels above current price. These act as ceilings where buying pressure gets absorbed
What the Gamma Data Tells Us:
- The $265 strike is the max gamma level -- the single biggest concentration of options positioning. This acts as the primary gravitational center
- Heavy put gamma clusters at $245, $250, and $255 create a layered support zone below. If IWM sells off, expect each of these to slow the decline
- Call gamma at $270 and $275 creates resistance overhead. The all-time high zone has sellers waiting
- IWM at $261.60 is currently sitting below the max gamma strike at $265, suggesting a mild pull toward that level
📊 Implied Move Analysis
The options market is pricing in the following expected moves for IWM:
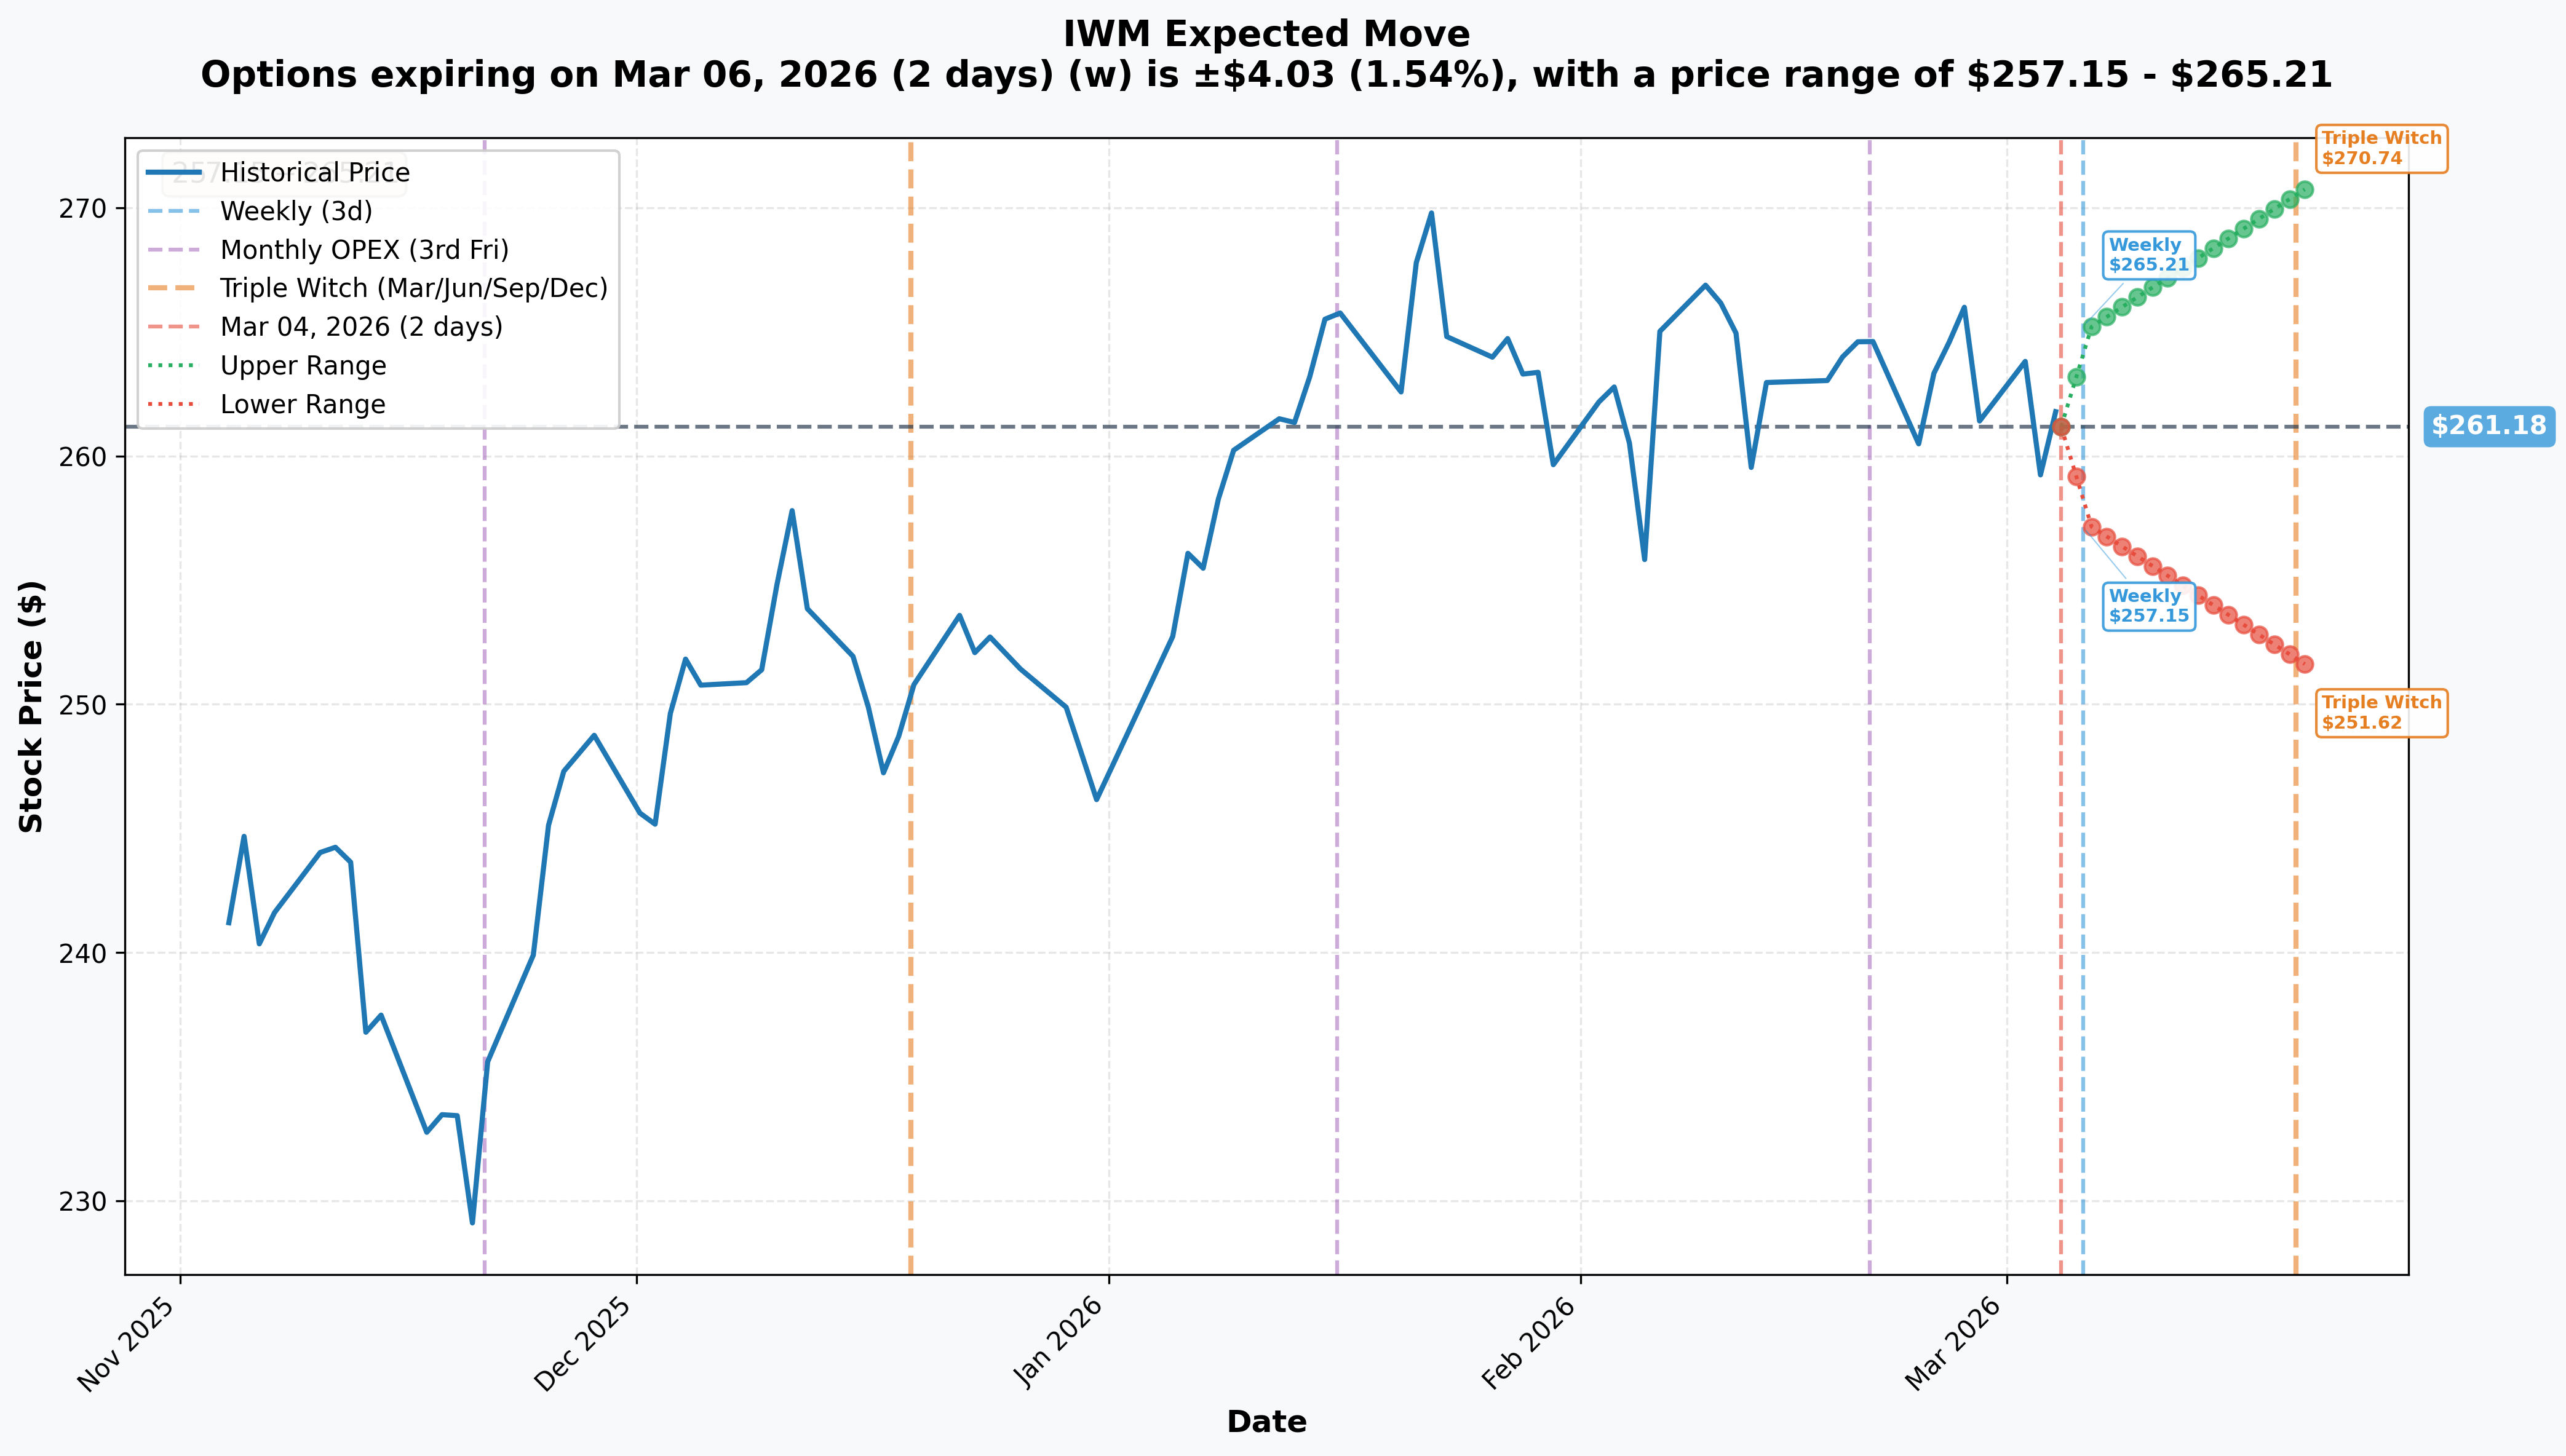
| Timeframe | Expiry | Expected Move | Range |
|---|---|---|---|
| 📅 Weekly (2 days) | March 6 | +/-1.54% ($4.03) | $257.15 - $265.21 |
| 📅 Monthly OpEx | March 20 | +/-3.66% ($9.56) | $251.62 - $270.74 |
| 📅 Triple Witch | March 20 | +/-3.66% ($9.56) | $251.62 - $270.74 |
What This Means:
- By Friday, IWM could move roughly $4 in either direction. The upper weekly bound at $265.21 lines up almost perfectly with the max gamma strike at $265 -- that is a strong ceiling for this week
- By March OpEx (March 20), the range widens to $251.62 - $270.74. The lower bound at $251.62 is near the $250 put gamma support zone, while the upper bound at $270.74 would challenge the all-time high
- The March 20 expiry is also the Triple Witch (quarterly options expiration), so expect amplified gamma effects and potential pinning around major strikes
🎪 Catalysts
🔴 Already Happened (Priced In)
- 📅 March 4: 25% tariffs on Canada/Mexico, 20% on China now in effect. IWM actually outperformed Nasdaq by ~9% over the past 30 days as investors rotated into domestic small caps
- 📊 March 2: ISM Manufacturing PMI at 52.4 -- second consecutive month of expansion. New orders at 55.8. This is a direct tailwind for IWM's ~16.7% industrials weighting
- 📈 January CPI: +0.2% MoM, +2.4% YoY -- cooling inflation sparked a small-cap rally on February 13
- 🏛️ OBBBA Tailwinds: The One Big Beautiful Bill Act permanently sets 21% corporate tax, 100% bonus depreciation, and expanded QSBS benefits -- all structural positives for small caps
🟢 Upcoming (Not Yet Priced In)
- 📅 March 5-6 -- February Jobs Report: Consensus +50K jobs. A weak print boosts rate-cut odds and is bullish for IWM's floating-rate-sensitive holdings
- 📅 March 6 -- Tariff exemptions expected: Trump expected to exempt USMCA-compliant goods and lower some tariffs -- potential relief rally
- 📅 March 11 -- February CPI (HIGH IMPACT): If this prints at or below 2.3%, rate-cut probability for March spikes above 50%
- 📅 March 18 -- FOMC Rate Decision + Dot Plot (HIGHEST IMPACT): Fed funds at 3.50-3.75%. The updated dot plot is the single most important catalyst -- if it shows 2+ cuts in 2026, IWM could rally hard. Remember: ~45% of Russell 2000 debt is floating-rate -- every 25bp cut directly boosts small-cap balance sheets
- 📅 March 21 -- Monthly Options Expiration (OpEx): Expect elevated gamma pinning around $255-265 strikes
- 📅 April 2 -- USMCA tariff exemption deadline: Potential re-escalation if exemptions are not extended
- 📅 Mid-April -- Q1 2026 earnings season: Small-cap earnings growth projected at 18-22% YoY -- critical to validate the rotation thesis
🎲 Price Targets & Probabilities
Using the gamma levels, implied move data, and catalyst calendar:
🐂 Bull Case -- $270-$275 (25% probability by March OpEx)
What gets us here: February CPI comes in below 2.3% on March 11, FOMC dot plot signals 2+ cuts on March 18, and tariff exemptions provide relief. IWM rallies back to the all-time high zone.
- 📊 $265 (max gamma strike) is the first stop -- then the $270 implied move upper bound
- 📊 $275 call gamma resistance is the stretch target
- 💡 The all-time high of $269.79 is the psychological barrier. A break above opens $270-275
⚖️ Base Case -- $257-$265 (50% probability by March OpEx)
What gets us here: Mixed data. Jobs report roughly in line, CPI does not surprise, FOMC holds steady with cautious language. IWM grinds sideways between the 50-day MA and the max gamma strike.
- 📊 Price gravitates toward the $265 max gamma level from below
- 📊 The $257-$265 implied move weekly range acts as a natural corridor
- 💡 This is the "theta decay" zone -- premium sellers win if we stay here
🐻 Bear Case -- $248-$255 (25% probability by March OpEx)
What gets us here: Hot CPI above 2.5%, hawkish FOMC dot plot signaling "higher for longer," tariff escalation past April 2, or a surprisingly weak jobs report that shifts the narrative to recession risk.
- 📊 $255 put gamma support is the first floor, followed by $250
- 📊 The 200-day MA at ~$243-248 is the ultimate line in the sand
- 💡 The put/call OI ratio of 2.61 shows the market is already positioned for this. Heavy hedging is in place
💡 Trading Ideas
🛡️ Conservative -- "The Income Overlay" (Follow the Whale)
Strategy: Sell covered calls on IWM shares you already own, mimicking today's institutional trade but at a closer strike and shorter duration.
- 📞 Sell IWM April 17, 2026 $270 calls (~$3.50-4.00 per contract)
- 💵 Premium collected: ~$350-$400 per contract
- 🎯 Max profit: Stock at or above $270 at expiry (you keep premium + appreciation to $270)
- 🛡️ Breakeven cushion: ~1.5% downside protection from premium collected
- 💡 Why this works: You are doing exactly what today's whale did -- collecting premium while IV is at the 76th percentile. The $270 strike is right at the all-time high, so you are saying "I am happy to sell at the highs." If IWM stays below $270, you keep the premium and your shares. Rinse and repeat
⚖️ Balanced -- "The FOMC Straddle Crusher"
Strategy: Sell an iron condor around the March OpEx to harvest the IV crush after the FOMC meeting on March 18.
- 📉 Sell IWM March 20, 2026 $250/$255 put spread (collect ~$1.20)
- 📈 Sell IWM March 20, 2026 $270/$275 call spread (collect ~$0.80)
- 💵 Total premium collected: ~$2.00 per iron condor ($200 per contract)
- 🎯 Max profit: IWM between $255-$270 at March 20 expiry -- which is the implied move range
- ❗ Max risk: $3.00 per spread ($300 per contract)
- 💡 Why this works: March 20 is Triple Witch AND two days after FOMC. IV will likely crush hard after the event passes. Your short strikes at $255 and $270 are right at the put/call gamma boundaries. The gamma chart shows heavy positioning at exactly these levels, meaning market makers will help pin price in your range
🚀 Aggressive -- "The Rate Cut Lottery Ticket"
Strategy: Buy a call spread targeting the earnings renaissance and potential rate cut catalysts over the next 2-3 months.
- 📈 Buy IWM June 19, 2026 $265 call (~$9.00)
- 📈 Sell IWM June 19, 2026 $285 call (~$3.50)
- 💵 Net debit: ~$5.50 ($550 per spread)
- 🎯 Max profit: $14.50 ($1,450 per spread) if IWM above $285 by June
- 📊 Break-even: $270.50 (just above the all-time high)
- 💡 Why this works: You are betting on the same thesis as the "Great Rotation" crowd -- that small caps rally on rate cuts and strong earnings. June expiry gives you three FOMC meetings (March, May, June), the Q1 earnings season, and the Russell Reconstitution. If the 18-22% earnings growth projections pan out and the Fed cuts once or twice, IWM has a real shot at $280+. The spread structure keeps your cost controlled despite elevated IV
⚠️ Risk Factors
- 🔴 Tariff escalation: If USMCA exemptions expire on April 2 without renewal, or retaliatory measures intensify, small-cap consumer discretionary and manufacturing margins get squeezed further
- 🔴 Sticky inflation: If February CPI comes in above 2.5%, rate-cut expectations collapse. With 45% floating-rate debt exposure, IWM is a leveraged bet on rate direction
- 🔴 Recession scare: A very weak jobs report (below 35K) could shift the narrative from "rate cuts are coming" to "recession is coming" -- bad for cyclical small caps even if it is rate-positive
- 🔴 Federal layoffs / DOGE impact: January saw government job losses. Accelerating federal cuts create localized demand destruction for small businesses with government contracts
- 🔴 200-day MA breakdown: If IWM breaks below ~$248, the technical character changes. Systematic selling could accelerate toward $240 or lower
- 🔴 Covered call risk for followers: If you sell calls and IWM rips above your strike, you cap your upside. That is the explicit tradeoff this whale is making at $300 -- make sure you are comfortable with it
🎯 The Bottom Line
Here is the deal: a large institutional player just locked in $5M in premium income on their IWM position by selling 2,500 LEAP calls at the $300 strike. This is not a panic move -- it is a disciplined income play from someone who is bullish enough to hold ~$65.5M in small-cap exposure but realistic enough to cap their upside at 14.5%.
If you are bullish on IWM: The covered call approach (Conservative idea) makes a ton of sense right now. IV is elevated at the 76th percentile, which means you get paid more for selling calls than usual. Follow the whale, just use shorter durations so you can reassess after FOMC.
If you are watching from the sidelines: Mark your calendar for March 11 (CPI) and March 18 (FOMC). These two events will determine whether IWM breaks back toward its all-time high of $270 or tests the 200-day MA at $248. The iron condor (Balanced idea) lets you profit from the resolution of uncertainty without picking a direction.
If you are bearish: The put/call OI ratio of 2.61 tells you the hedging crowd is already heavily positioned for downside. That makes cheap put protection hard to find. Consider put spreads instead of outright puts to manage the elevated IV cost.
The next two weeks are make-or-break for small caps. The tariff news is here, but the real question is what the Fed does on March 18. Trade accordingly. 💪
Disclaimer: Options involve significant risk of loss and are not suitable for all investors. The analysis above reflects unusual options activity observed in the market and should not be considered investment advice. Always do your own research and consider your risk tolerance before trading. Past unusual activity is not indicative of future price movement.
Data provided by Ainvest Labs | IWM on Ainvest | March 4, 2026