🐋 JD: Massive $28.5M Options Straddle Signals Major Move Ahead!
📅 September 19, 2025 | 🔥 Unusual Activity Detected
🎯 The Quick Take
Someone just placed a $28.5 MILLION options straddle on JD - simultaneously buying 40,000 November calls and selling 40,000 November puts! This whale is positioning for JD to stay above $30 while potentially exploding higher, perfectly timed ahead of Q3 earnings on November 12-13.
🏢 Company Overview
JD.com Inc is China's third-largest e-commerce platform:
- Market Cap: $50.17 billion
- Industry: E-commerce & Supply Chain Technology
- Core Business: Online retail (87.7%), logistics, and technology services
- Headquarters: Beijing, China
- YTD Performance: +3.90% (currently $35.56)
💰 The Option Flow Breakdown
📊 What Just Happened
| Time | Symbol | Side | Buy/Sell | C/P | Expiration | Premium | Strike | Volume | OI | Size | Spot | Option Price |
|---|---|---|---|---|---|---|---|---|---|---|---|---|
| 14:39:52 | JD | MID | BUY | CALL | 2025-11-21 | $26M | $30 | 40K | 1.6K | 40,000 | $35.63 | $6.50 |
| 14:39:52 | JD | MID | SELL | PUT | 2025-11-21 | $2.5M | $30 | 40K | 2.7K | 40,000 | $35.63 | $0.62 |
Option Symbols:
- Long: JD+20251121+C+00030000 - View Option Chart
- Short: JD+20251121+P+00030000 - View Option Chart
🤓 What This Actually Means
Real talk: This is a risk reversal strategy that screams institutional confidence! Let me break this down:
- 💰 Net Debit: $23.5M ($6.50 - $0.62 = $5.88 per share)
- 🎯 Breakeven: $35.88 at expiration (just 0.9% upside needed)
- 🐋 Position Size: Controls 4 million shares worth $142.5 million
- 🔥 Volume vs OI: Call volume 25x open interest, Put volume 15x open interest
- ⏰ Time to Expiry: 63 days (perfectly captures Q3 earnings)
Translation for us regular folks: This whale is so confident JD won't drop below $30, they're willing to be assigned 4 million shares if it does! Meanwhile, they're betting big on upside beyond $36. That's like buying insurance on your house while simultaneously betting it will appreciate - you only do this when you're REALLY confident!
📈 Technical Setup / Chart Check-Up
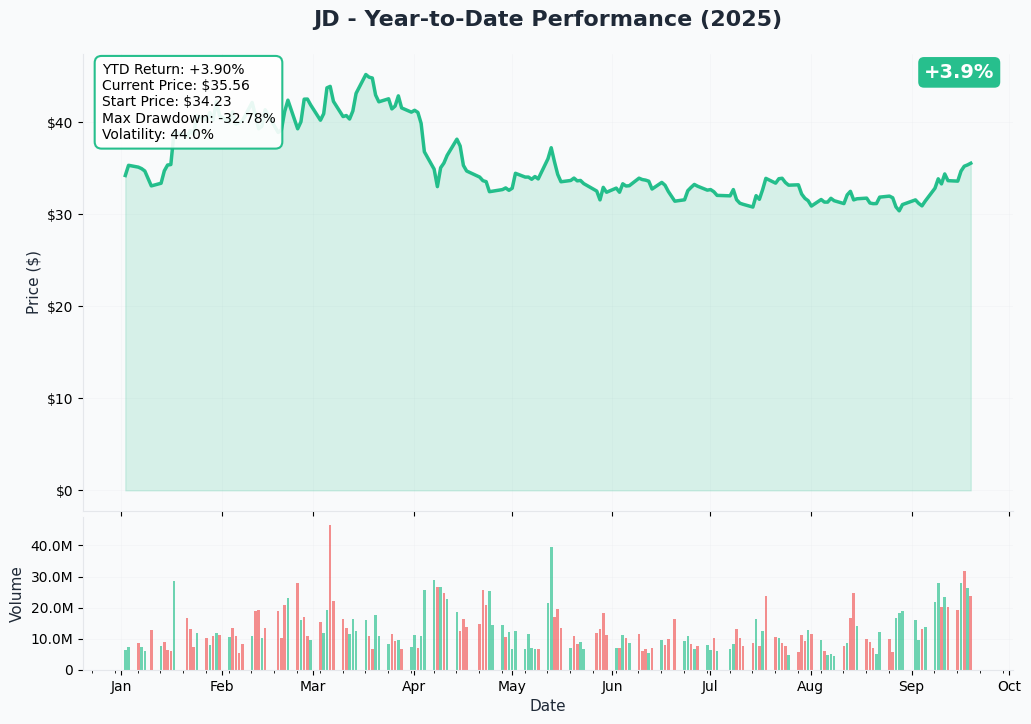
Looking at the YTD chart, JD has shown resilience:
- YTD Return: +3.90% (outperforming many Chinese ADRs)
- Key Support: $30-31 (tested multiple times and held)
- Current Level: $35.56 - middle of recent range
- Max Drawdown: -32.78% (from early year highs)
- Volatility: 44.0% (elevated for potential big moves)
The stock has been consolidating between $30-37 for the past 3 months, building energy for a breakout. Volume spikes in early September suggest accumulation phase is underway.
🎪 Catalysts
📅 Upcoming Events
- November 12-13, 2025: Q3 2025 Earnings - Analysts expect EPS of $0.44
- November 11, 2025: Singles' Day shopping festival results
- Q4 2025: Holiday season performance update
- 2026: European expansion through €2.2B Ceconomy acquisition
🔥 Recent Developments
- Q2 2025: Revenue grew 22.4% YoY to $49.8B - strongest growth since 2021
- Food Delivery: Surpassed 25M daily orders during 618 festival
- 618 Festival: Record-breaking 2.2B orders, doubled shopper count YoY
- Share Buyback: $3.5B remaining in $5B program through 2027
- Government Stimulus: Benefiting from RMB 200B "export to domestic" program
🎲 Price Targets & Probabilities
Based on the options positioning and analyst consensus:
🚀 Bull Case ($42+ by November) - 30% chance
- Q3 earnings beat with margin expansion
- Food delivery achieves profitability milestone
- Government stimulus drives consumer spending surge
- Singles' Day breaks all records
- Option Payoff: $6+ profit per contract (+100% return)
😐 Base Case ($36-40) - 45% chance
- Steady growth continues at 15-20% pace
- Food delivery losses moderate but persist
- In-line Q3 earnings with maintained guidance
- Option Payoff: $0-4 profit per contract (0-68% return)
😰 Bear Case ($30-35) - 25% chance
- Intense price war with Alibaba and PDD pressures margins
- Food delivery losses expand beyond $10B estimate
- China macro concerns resurface
- Option Payoff: Loss up to $5.88 per contract if below $30
💡 Trading Ideas
🛡️ Conservative: "Follow the Floor"
Sell JD Nov $30 Puts (currently ~$0.62)
- Collect premium like the whale is doing
- Only risk is assignment at $30 (15% below current)
- Monthly return: 2% on cash-secured basis
- Why it works: Strong support at $30, whale protection
⚖️ Balanced: "Earnings Momentum Play"
Buy JD Nov $37.50 Calls (currently ~$2.00)
- Lower capital requirement than whale trade
- Breakeven at $39.50 (11% upside needed)
- Risk only $200 per contract
- Captures earnings catalyst with defined risk
🚀 Aggressive: "YOLO the Breakout"
Buy JD Oct $36/$40 Call Spread (~$1.20 debit)
- Maximum profit: $2.80 per spread (233% return)
- Breakeven: $37.20 (4.6% move needed)
- Shorter timeframe for quicker profits
- Perfect for pre-earnings momentum trade
⚠️ Risk Factors
Let's keep it real - here's what could go wrong:
- 📉 Food Delivery Bleeding: Already lost ~$10B RMB, could worsen
- 🐉 Competition: Alibaba and PDD fighting dirty with price wars
- 🇨🇳 China Risk: Regulatory changes, geopolitical tensions always lurking
- 💸 Profitability Pressure: Net income down 50% YoY despite revenue growth
- 📊 Valuation: Trading at discount for a reason - execution risk is real
🎯 The Bottom Line
Here's the deal: When someone drops $23.5 million on a bullish options strategy with just 63 days to expiration, they're not gambling - they're positioning with conviction. This whale is essentially saying "I'll take 4 million shares at $30 if you're selling, but I think we're going way higher."
The Action Plan:
✅ If you own JD: Hold tight and consider selling calls above $40 for extra income
✅ If you're watching: The November $37.50 calls offer better risk/reward than copying the whale trade exactly
✅ If you're bearish: Respect the $30 support - this whale will defend it with $120M of buying power
Mark your calendar for November 12-13 - that's when Q3 earnings will either validate this massive bet or teach someone an expensive lesson. With revenue growing 22.4%, aggressive buybacks underway, and government stimulus flowing, this whale might be onto something big.
Remember: Options can expire worthless. This whale can afford to lose $23.5M - make sure your position size matches YOUR risk tolerance, not theirs! Trade smart, not hard! 💪
Options involve risk and are not suitable for all investors. This analysis is for educational purposes only and not investment advice. Always do your own research and consult with a financial advisor.