🔬 LRCX: $30.7M in Option Bets Signal Chipmaking Equipment Boom Ahead!
📅 December 22, 2025 | 🔥 Unusual Activity Detected
🎯 The Quick Take
Big money just placed $30.7 million worth of strategic options bets on Lam Research (LRCX), the semiconductor equipment powerhouse riding three major tech inflections: AI-driven HBM memory, 3D NAND transitions, and next-gen gate-all-around chips. With the stock at all-time highs near $175 and Q2 earnings dropping January 28, traders are positioning for volatility as analysts pile on upgrades with price targets hitting $200-$210. These aren't random retail trades - this is institutional money making calculated moves on a company with 80%+ market share in advanced chip etching.
💰 The Option Flow Breakdown
📊 What Just Happened
Today's unusual activity totaling $30.7M in premium shows sophisticated positioning ahead of key catalysts:
| Time | Type | Strike | Expiration | Premium | Volume | Strategy | Chart |
|---|---|---|---|---|---|---|---|
| 10:00 AM | 🔴 BUY PUT | $160 | 2026-03-20 | $2.1M | 20,000 | Long Put | View Chart |
| 10:00 AM | 🟢 SELL PUT | $150 | 2026-02-20 | $8.6M | 25,000 | Short Put | View Chart |
| 12:05 PM | 🟢 SELL CALL | $78 | 2027-01-15 | $20.0M | 2,000 | Short Call | View Chart |
Total Premium Deployed: $30.7 Million
🤓 What This Actually Means
Let me break down what's happening here in plain English:
The $20M Deep ITM Call Sale (Most Interesting): Someone sold 2,000 deep in-the-money calls at the $78 strike expiring January 2027. This is classic institutional position unwinding - they're likely locking in massive gains on shares they own around $175 (that's nearly $100 profit per share). Translation: Smart money is taking some chips off the table after the run to all-time highs, but they're doing it two years out, suggesting they still expect upside near-term.
The Put Spread Play: The simultaneous $160 put buy ($2.1M) and $150 put sale ($8.6M) creates a bearish spread structure. This trader is hedging downside risk through March 2026 but capping losses at $150. They're basically saying "protect me if we drop 10%, but I don't think we're crashing below $150."
What It Tells Us: This flow shows mixed positioning - institutions locking in profits on long positions while simultaneously buying downside insurance. Not panic selling, but definitely risk management mode after the stock hit fresh highs. The timing right before earnings (January 28) and with 43% China revenue exposure tells us smart money wants protection.
📈 Technical Setup
YTD Chart Analysis
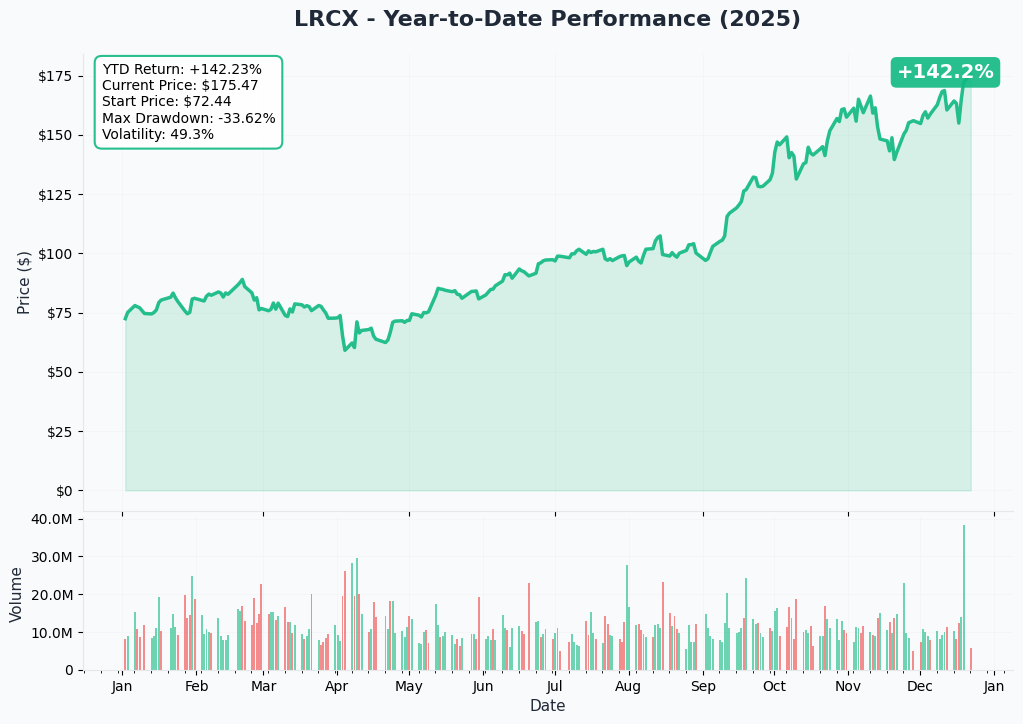
LRCX has been on an absolute tear in 2025, hitting all-time highs near $172 on December 19 after a wave of analyst upgrades pushed price targets to $195-$210. The stock is currently trading at $175.39, up significantly from $163 just a week ago. The recent surge was fueled by Jefferies upgrading to $200, followed by Deutsche Bank, B. Riley, and Mizuho all raising targets to $195-$200 on December 18.
The momentum is backed by real fundamentals: Q4 calendar 2024 results beat expectations with $4.38B revenue (vs $4.31B consensus) and the company raised its 2025 WFE outlook to approximately $105B from prior $100B estimate. But here's the thing - we're at all-time highs with insiders selling $6M+ in November, which explains why big money is taking some risk off.
Gamma-Based Support & Resistance Analysis
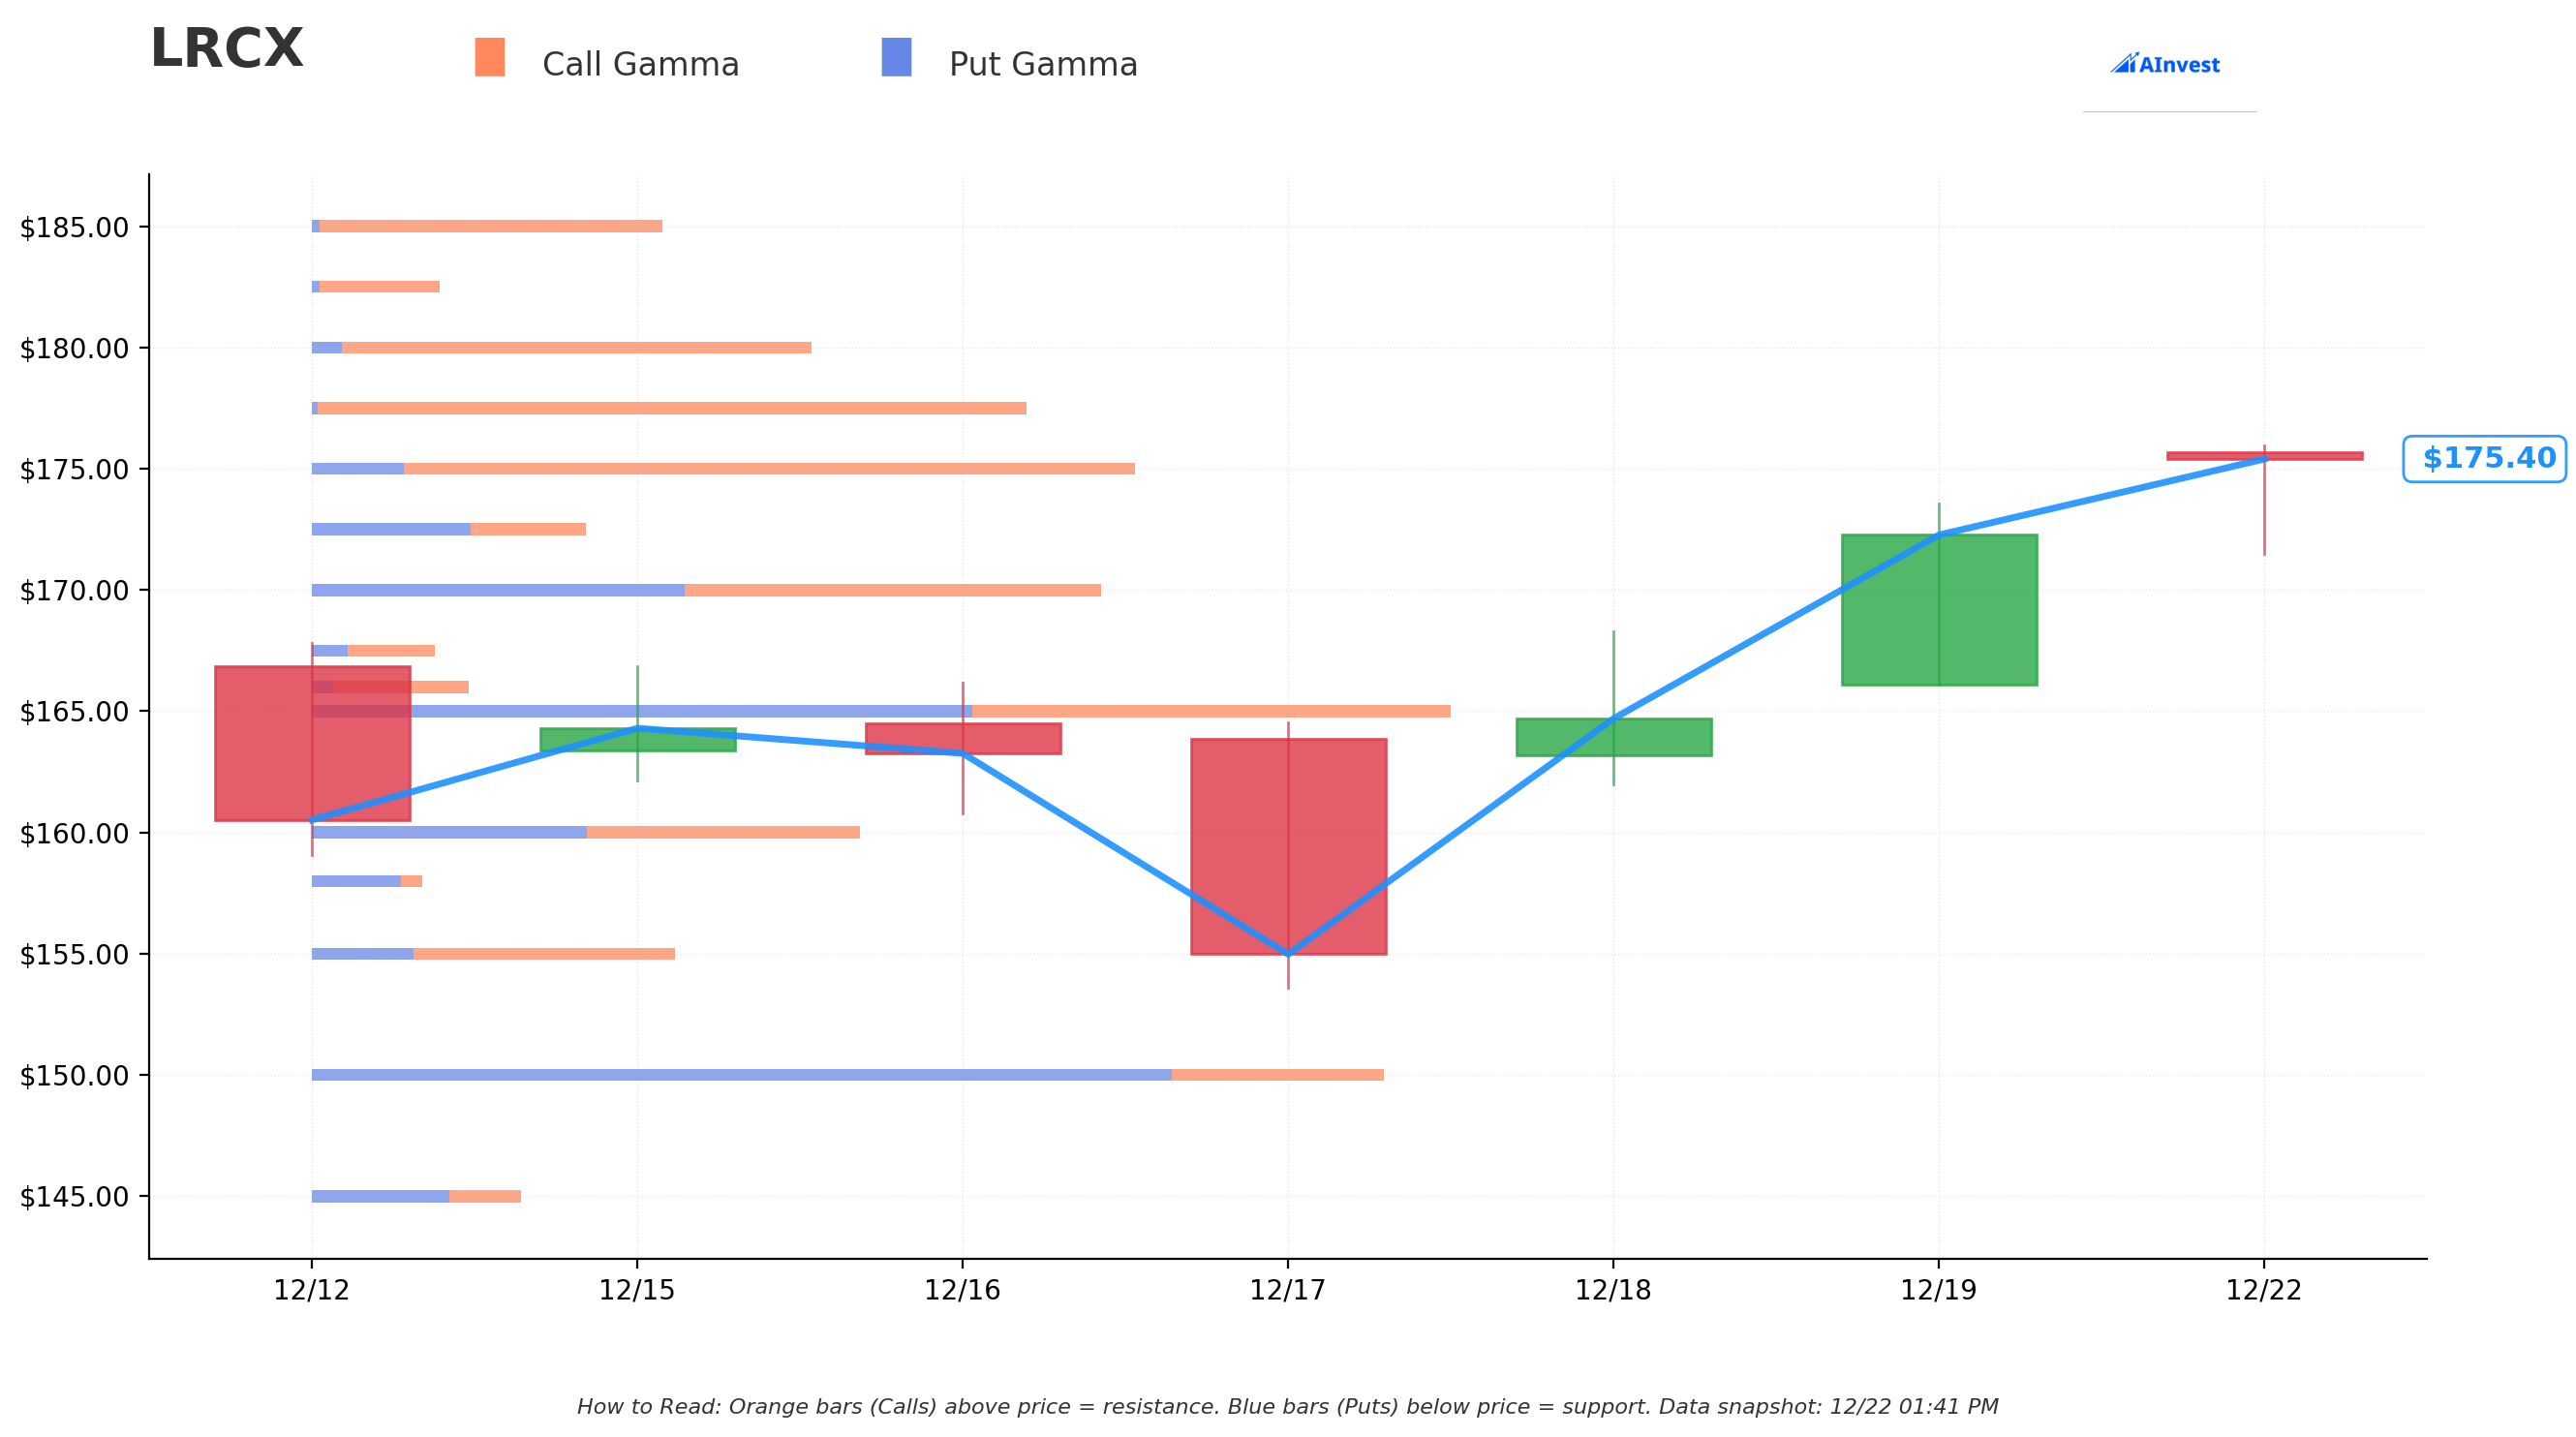
The gamma exposure map is absolutely critical here - it's showing us where market makers will defend price levels:
Resistance Levels (Orange Bars Above Price):
- 🔴 $177.50 (Strongest Resistance): Massive call gamma wall with 3.33M GEX - this is where dealers are short tons of calls and will fight price appreciation. Currently just 1.2% above current price.
- 🔴 $180.00: Another significant barrier at 2.20M GEX, sitting 2.6% higher
- 🔴 $185.00: Major level at 1.61M GEX if we break through $180
Support Levels (Blue Bars Below Price):
- 🟢 $175.00 (Immediate Support): Strong support at 2.99M net GEX, literally right at current price (0.2% away). This is your "line in the sand" - break this and we could see quick downside.
- 🟢 $170.00: Secondary support at 3.70M total GEX, about 3% down
- 🟢 $165.00: Major put wall with 5.33M total GEX (strongest support), 5.9% below current price
- 🟢 $150.00: Deep support at 5.02M total GEX - notice this lines up perfectly with the $150 put sale from our option flow!
What This Means for Traders: The stock is sitting right on top of major support at $175 with the strongest resistance just $2.50 higher at $177.50. This creates a tight 1.4% range where price action will likely consolidate unless we get a major catalyst. The gamma profile suggests limited upside to $177.50 before hitting a brick wall, but strong support down to $165 if bulls lose $175.
Implied Move Analysis
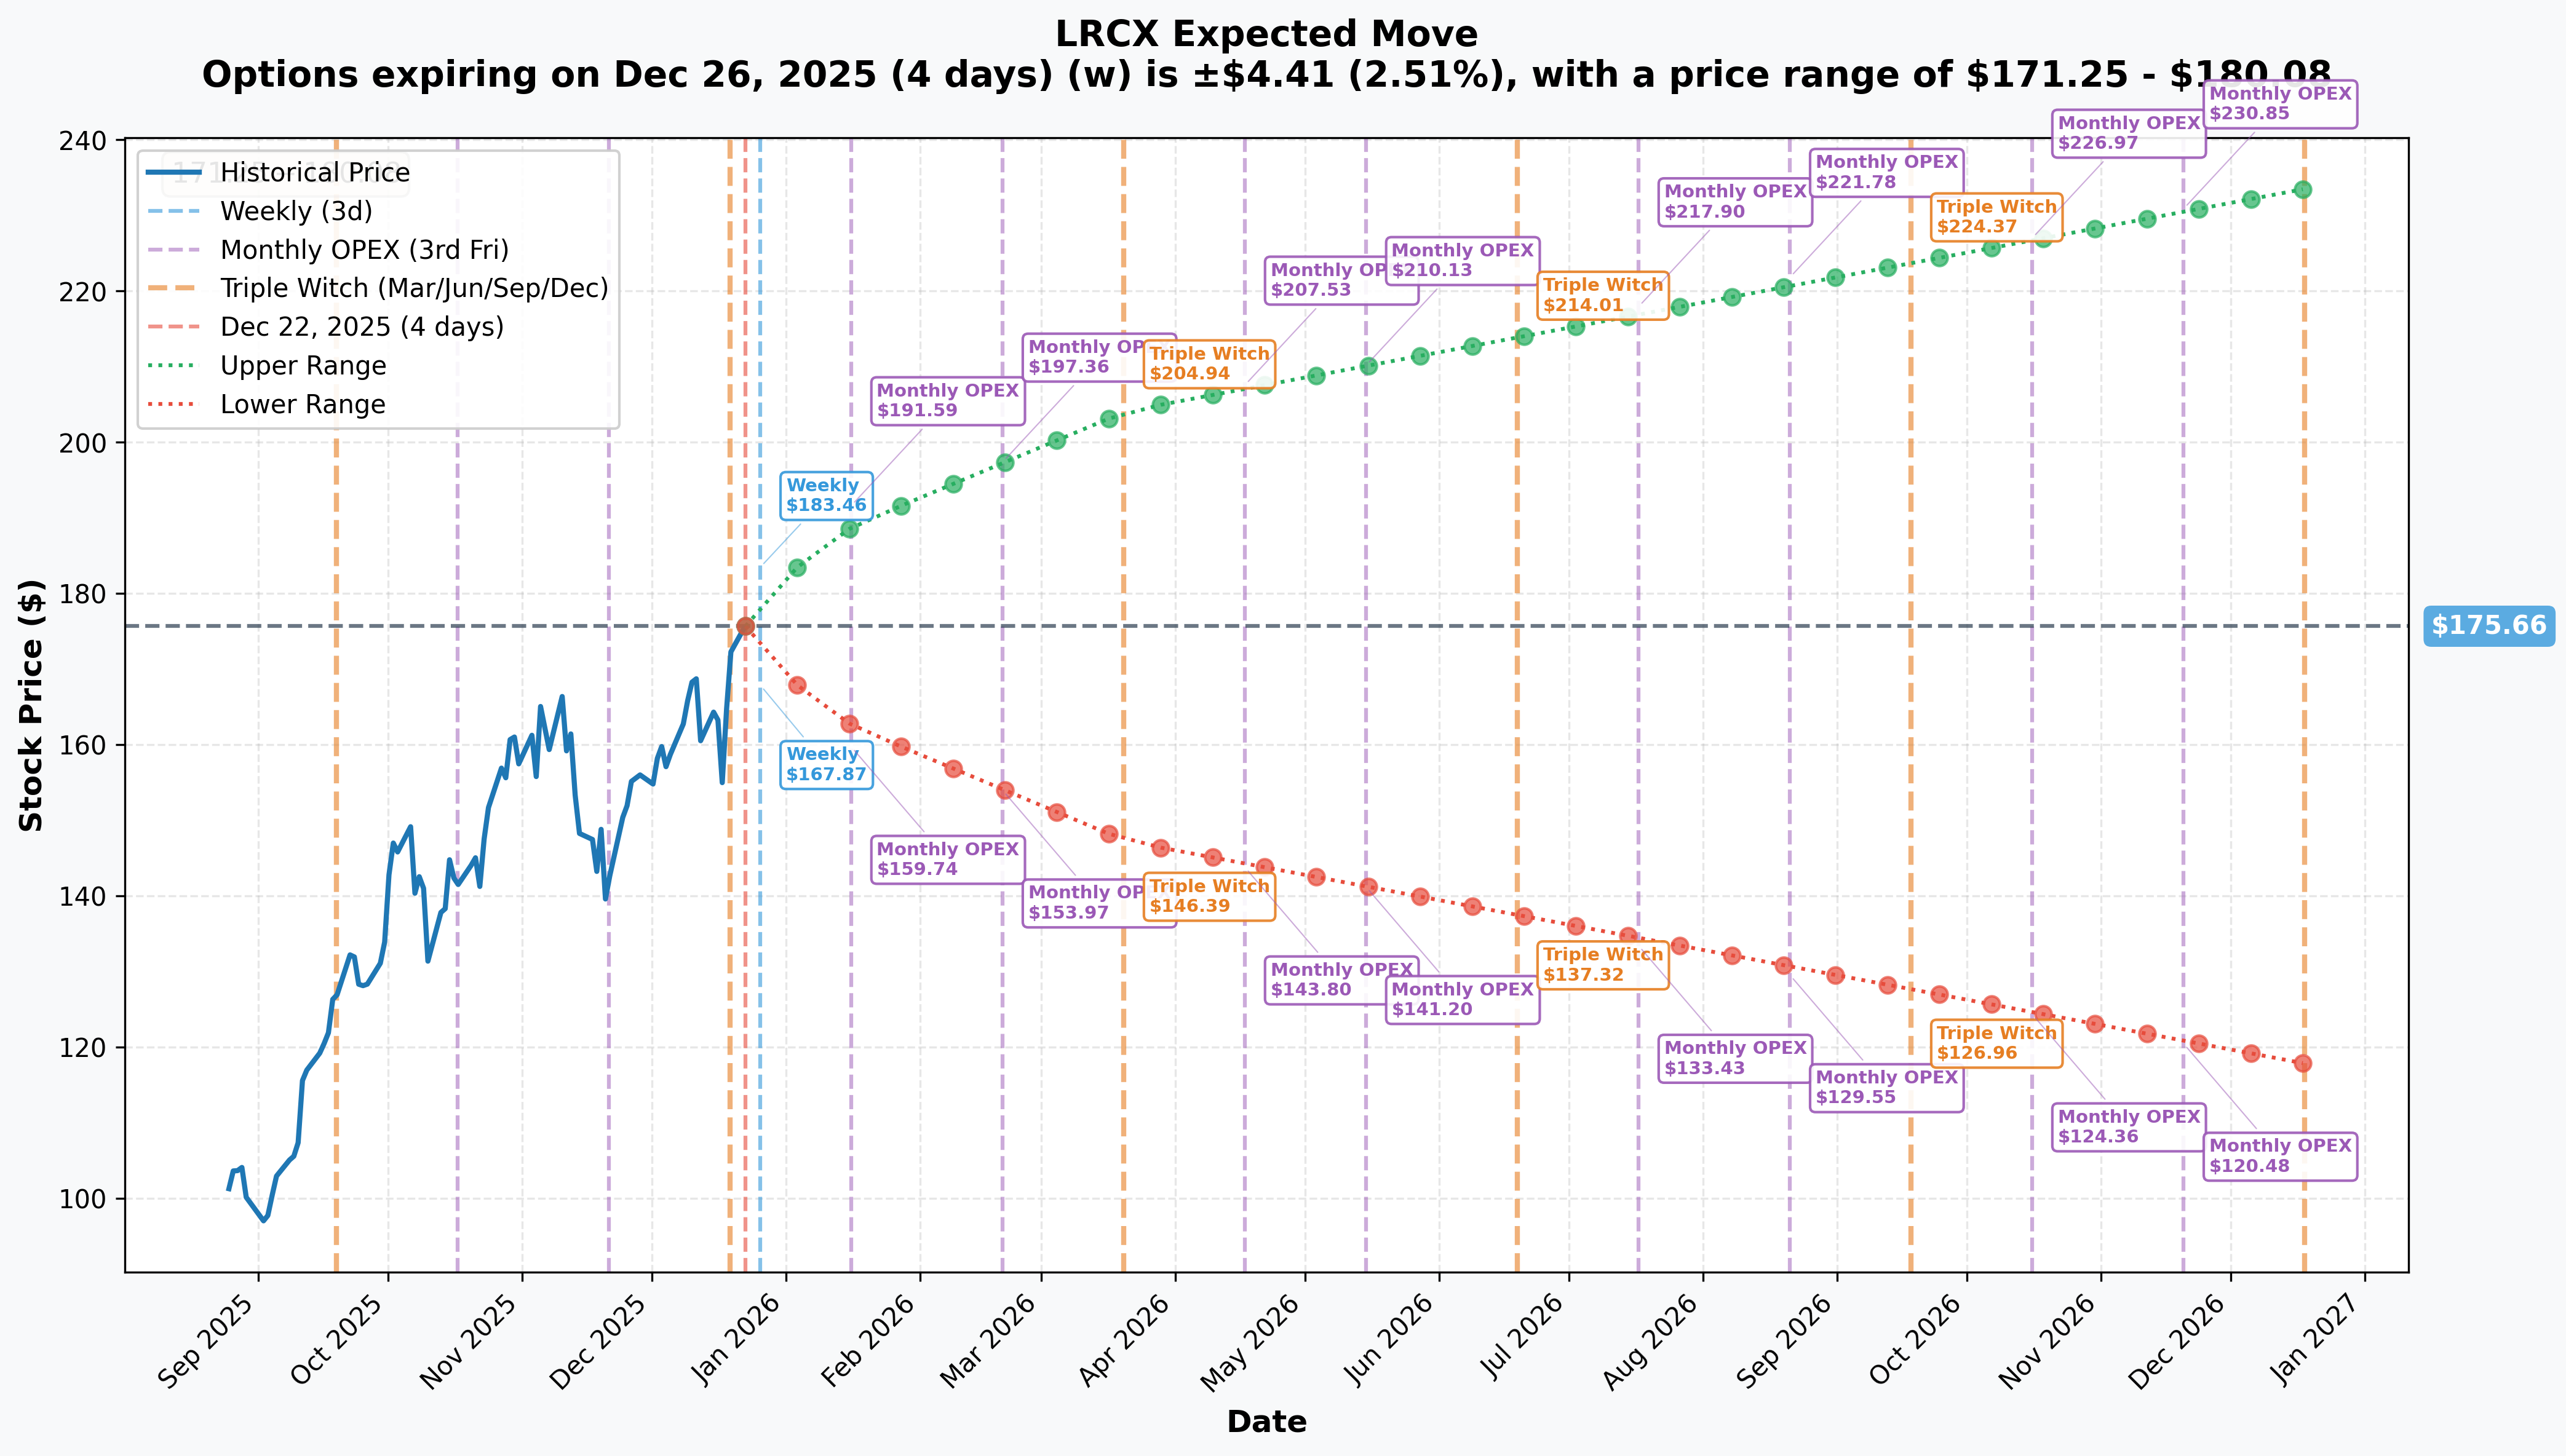
Options market is pricing in some serious volatility across different timeframes:
Weekly (December 26 Expiration - 4 days):
- Implied Move: ±2.5% or $4.41
- Range: $171.25 - $180.08
- Translation: Market expects $175 ± $4 by Thursday's close
Monthly OPEX (January 16 - 25 days):
- Implied Move: ±7.6% or $13.28
- Range: $162.38 - $188.95
- This captures the January 28 earnings event, hence the larger move
Quarterly Triple Witch (March 20 - 88 days):
- Implied Move: ±16.2% or $28.41
- Range: $147.25 - $204.08
- Notice the lower bound at $147 is very close to our $150 put wall - smart money knows where the floor is
Yearly LEAPs (December 2026 - 361 days):
- Implied Move: ±33% or $57.88
- Range: $117.78 - $233.55
- One-year view shows potential for massive swings in either direction
Key Insight: The weekly ±2.5% move aligns perfectly with gamma resistance at $177.50 on the upside and support at $172.50 on the downside. The monthly ±7.6% move into earnings suggests the market is pricing in moderate volatility - not expecting a blowout surprise, but definitely some action.
🎪 Catalysts
📅 Upcoming Catalysts (What's Next)
Confirmed Events:
🔥 Q2 FY2026 Earnings - January 28, 2026 (37 days away)
- Consensus Revenue: $4.92B
- Consensus EPS: $1.06
- Company Guidance: Revenue $5.2B ± $300M, gross margin 48.5% ± 1%
- Why It Matters: This is THE major catalyst everyone's positioned for. Key things to watch:
- China revenue commentary (was 43% in September)
- Gross margin trajectory (targeting 48%+ range)
- HBM equipment shipment updates
- 2026 WFE outlook guidance
Technology Inflections (Q1-Q2 2026):
- Gate-All-Around (GAA) Shipments: Expected to exceed $3B in 2025, with Lam holding >80% market share in advanced node etch
- HBM Market Expansion: HBM market projected to grow nearly eightfold by 2027
- 3D NAND Transitions: 200+ layer upgrades driving $40B+ in conversion spending
Semiconductor Equipment Market Growth:
- SEMI forecasts global chipmaking equipment sales +9% to $126B in 2026, +7.3% to $135B in 2027
- Foundry/Logic WFE: +5.5% growth in 2026 to support AI accelerators and HPC
- Americas spending forecast to jump 56.4% in 2026 from CHIPS Act incentives
✅ Recent Catalysts (Already Happened)
Q4 Calendar 2024 Earnings (Reported January 29, 2025):
- Beat expectations: $4.38B revenue vs $4.31B consensus
- Non-GAAP EPS: $0.91 vs $0.88 consensus
- Stock reaction: +5.12% after-hours
- Raised 2025 WFE outlook to $105B from $100B
Analyst Upgrade Wave (December 2025):
- Jefferies to $200 from $175 (December 15)
- Deutsche Bank to $195, B. Riley to $195, Mizuho to $200 (December 18)
- Cantor Fitzgerald to $210, BofA to $195, Citi to $190
- Consensus: 24 analysts, 17 Strong Buy, 5 Hold, 0 Sell
Facility Expansion (November 2025):
- Opened new $65M, 120,000-square-foot Tualatin Building G in Oregon
- Adds 700 workspaces for AI-era semiconductor R&D
Dividend Increase (August 2025):
- Quarterly dividend increased 13% from $0.23 to $0.26 per share
- Current quarterly dividend: $0.26/share, payable January 7, 2026
- 11-year dividend growth track record
🎲 Price Targets & Probabilities
Based on Gamma Levels, Implied Move, and Catalyst Analysis:
🚀 Bull Case ($185-$200 by March 2026) - 35% Probability
Catalysts Required:
- Q2 earnings beat with revenue >$5.0B (above $4.9B consensus)
- Gross margins expand to 49%+ range
- China revenue stabilizes above 40% vs expected decline to 30%
- Strong HBM/GAA commentary with raised 2026 WFE outlook to $110B+
- Analyst upgrades accelerate beyond $210
Technical Path:
- Break through gamma resistance at $177.50 on earnings momentum
- Clear $180 with volume, targeting analyst price targets at $185
- Monthly OPEX implied move upper bound at $189
- Quarterly implied move suggests $204 is achievable if all goes right
Why It Could Happen: LRCX holds >80% market share in advanced etch with three major secular tailwinds (HBM growing 8x to 2027, NAND $40B conversion, GAA $3B+ market). If January earnings show gross margins expanding and China risk contained, we could see a rapid move to test the upper analyst target range.
⚖️ Base Case ($170-$177.50) - 50% Probability
Most Likely Scenario:
- Earnings meet expectations but don't blow them out
- Revenue comes in around $5.0-5.2B (within guidance range)
- China revenue commentary suggests gradual decline to 35-38% in 2026
- Gross margins hold 48-48.5% range
- Stock consolidates between current support and resistance
Technical Range:
- Defend gamma support at $175 (current level)
- Test resistance at $177.50 multiple times
- Trade within weekly implied move range of $171-$180
- Choppy action as institutions continue profit-taking while new buyers accumulate
Why This Makes Sense: The gamma profile shows major resistance just $2.50 higher with equally strong support at $175. After the big run-up and at all-time highs, consolidation is natural. The $30.7M option flow we saw today reflects this exact view - locking in profits while maintaining some upside exposure through March.
🐻 Bear Case ($150-$165) - 15% Probability
Negative Catalysts:
- Earnings miss on revenue or margins
- China export restrictions announced before/after earnings
- China revenue guidance drops sharply to <30% for 2026
- Reduced WFE outlook for 2026 due to memory oversupply concerns
- Broader semiconductor correction pulls LRCX down
Technical Breakdown:
- Break below gamma support at $175 triggers sell programs
- Quick drop to secondary support at $170 (3% down)
- If that fails, major put wall at $165 (5.9% down)
- Deep support at $150 aligns perfectly with the $150 put sale we saw
- Monthly implied move lower bound at $162 could be tested
Why It's Possible: LRCX has 43% revenue exposure to China facing potential export restrictions and projected decline. Historical impact from restrictions has been $200M+ revenue reductions. Insiders sold $6M+ in November, and we're at all-time highs with elevated valuation. Any execution miss or negative China news could trigger fast rotation out of semis.
💡 Trading Ideas
🛡️ Conservative: The "Sleep Well" Covered Put Strategy
Setup:
- Sell February 21 $165 puts at ~$2.50 (collect $250 per contract)
- Max profit: $250 premium
- Breakeven: $162.50
- Required capital: $16,500 cash secured per contract
Why This Works:
- The $165 strike sits right at major gamma support (5.33M GEX)
- You're getting paid to potentially buy LRCX 5.9% below current price
- If assigned, you own shares at $162.50 effective price before earnings
- Monthly implied move lower bound is $162.38 - market says this is the floor
Risk/Reward:
- Best case: Keep $250 premium (1.5% return in 2 months)
- Worst case: Own shares at $162.50 if market crashes
- This is for investors who WANT to own LRCX cheaper with gamma support backing them
Probability of Success: ~75% (stock would need to drop >5.9% to be challenged)
⚖️ Balanced: The "Earnings Straddle" Play
Setup:
- Buy January 30 $175 straddle (ATM call + put)
- Cost: ~$8.50 total ($850 per straddle)
- Breakeven: $166.50 or $183.50
- Max profit: Unlimited
Why This Works:
- Earnings on January 28 create binary event risk
- Monthly implied move is ±7.6% ($13.28), but straddle only needs 4.8% move to profit
- You're betting on movement, not direction - smart given mixed option flow
- Gamma support at $175 and resistance at $177.50 suggests explosive move once range breaks
Risk/Reward:
- Win if stock moves >$8.50 in either direction by January 30
- Historical earnings moves: Last quarter +5.12% after-hours
- With China revenue uncertainty and analyst targets at $195-$210, big move is plausible
Probability of Success: ~55% (market-implied, but analyst upgrades suggest higher)
Pro Tip: Consider buying this 3-5 days before earnings to minimize theta decay, or sell one side the day after earnings to lock profit if you get a big move.
🚀 Aggressive: The "Analyst Target Chase" Call Spread
Setup:
- Buy March 20 $180 calls at ~$4.50
- Sell March 20 $195 calls at ~$1.50
- Net cost: $3.00 per spread ($300 max risk)
- Max profit: $12.00 ($1,200 per spread if above $195)
Why This Works:
- Targets the analyst upgrade range: Deutsche Bank $195, Jefferies $200, Cantor $210
- Gives you 88 days for the trade to work through earnings and into Q1 2026
- Quarterly implied move upper bound is $204 - you're positioned perfectly
- 4:1 risk/reward ratio if stock reaches analyst targets
Risk/Reward:
- Risk: $300 per spread (lose 100% if below $180 by March)
- Reward: $1,200 max profit (400% return if above $195)
- Breakeven: $183 (just 4.3% higher than current price)
Probability of Success: ~30% (aggressive, but analyst consensus is $195-$210)
Who Should Do This: YOLO traders who believe the secular growth story (HBM, GAA, NAND) will drive the stock to analyst targets. You're basically buying the analyst upgrade thesis with defined risk. Worst case, you're out $300. Best case, you 4x your money if LRCX hits the analyst target range.
⚠️ Risk Factors
Let's talk about what could actually go wrong here, because there are some real risks to consider:
🌏 China Exposure (Biggest Risk)
The Problem: LRCX derives 43% of revenue from China as of September 2025, and that's expected to decline to sub-30% in 2026 due to export restrictions.
What It Means: The U.S. government announced additional semiconductor export restrictions in December 2024, and while Lam said it was "broadly consistent with prior expectations," there's risk of further tightening. Historical impact has been $200M+ revenue reductions, with potential for cumulative $700M impact mentioned.
Real Talk: If you see headlines about new China chip restrictions before or after earnings, expect this stock to gap down 5-10% instantly. That's why smart money bought the $160 puts for March - they're hedging exactly this risk.
💸 Valuation at All-Time Highs
The Problem: Stock hit fresh all-time highs at $172 on December 19, and insiders sold $6M+ in November.
What It Means: When company executives are selling into strength and the stock is at all-time highs, there's limited margin of safety. Any disappointment gets punished hard from elevated levels. The $20M deep ITM call sale we saw today is literally institutions locking in profits.
Real Talk: This is not the time to buy thinking "it can't go down." It absolutely can - and fast. The gamma support at $175 is just 0.2% below current price. If that breaks, we could see a quick 5% drop to $165 before finding real support.
🔧 Technology Transition Risks
The Problem: Semiconductor industry is approaching limits of physics at sub-3nm nodes with unprecedented engineering challenges. 3D NAND high aspect ratio memory (200+ layers) creates etch stop problems.
What It Means: If alternative patterning technologies bypass plasma processing (Lam's core business), the entire thesis breaks. LRCX is betting billions on GAA and HBM - if those transitions disappoint or get delayed, revenue growth stalls.
Real Talk: This is a longer-term risk, but worth considering. The company is essentially making a huge bet that current etching technology will continue to be needed for next-generation chips. If that bet is wrong, the stock goes much lower.
🎢 Memory Market Volatility
The Problem: Foundry is 60% of system revenue, but memory (NAND 18%, DRAM 16%) creates quarterly volatility. Memory market faces structural oversupply and price elasticity challenges.
What It Means: Sharp swings in memory capex spending create earnings volatility. If NAND or DRAM prices crash due to oversupply, customers delay equipment purchases, and LRCX revenue drops faster than expected.
Real Talk: Memory is cyclical as hell. We're in an upcycle now driven by HBM and AI demand, but cycles turn fast. If you hear about NAND or DRAM oversupply, expect this stock to pull back regardless of long-term fundamentals.
🤖 AI Investment Sustainability
The Problem: Current AI-driven spending relies on assumption that "risk of underinvesting > risk of overinvesting", but there's a mismatch between high gen AI spending and ability to monetize AI offerings.
What It Means: If sentiment shifts and companies start questioning AI ROI, demand for AI chips weakens, which means less demand for the equipment to make those chips. LRCX is a picks-and-shovels play on the AI boom - if the boom falters, the equipment orders dry up.
Real Talk: We've seen this movie before (crypto mining in 2018, 5G hype in 2020). When the tide turns on AI spending, it turns FAST. Watch for any signs that hyperscalers (Google, Microsoft, Meta) are pulling back on capex.
🎯 The Bottom Line
Real talk: LRCX is a high-quality company riding three massive secular trends (HBM, NAND, GAA) but positioned at a precarious moment - all-time highs with 43% China exposure and earnings in 5 weeks.
If You Own LRCX:
- Take some profits if you're up big - those $20M call sales tell you institutions are doing exactly that
- Set a stop loss at $170 (secondary gamma support) to protect gains
- Consider selling covered calls at $180 or $185 to generate income while you wait for earnings
- Mark your calendar for January 28 earnings and plan your move
If You're Watching:
- Wait for a pullback to $170 or $165 to enter with better risk/reward
- Or buy the $165 puts (our conservative strategy) to get paid while waiting
- The weekly ±2.5% implied move suggests we'll see some volatility this week - use it
- Don't chase at all-time highs without a clear catalyst
If You're Bearish:
- The $160-$165 put spread for March is the smart hedge against China risk
- Wait for a break below $175 gamma support to short with confirmation
- Watch for any China export restriction headlines before earnings
For Earnings Gamblers:
- The straddle is your friend - pays if we move >±4.8% after earnings
- Buy 3-5 days before earnings to minimize theta, sell one side day after to lock profit
- Historical move was +5.12% last quarter - this could be bigger with China uncertainty
The Timing Play: With earnings on January 28 and analyst targets at $195-$210, you have a defined catalyst window. The monthly implied move of ±7.6% suggests the market expects movement, not stagnation. But remember - we're at all-time highs with insiders selling. Risk/reward favors waiting for a better entry unless you're trading the earnings event specifically.
My Take: I respect the secular growth story and LRCX's dominant market position, but I'm not chasing at $175. I'd rather sell the $165 puts to collect premium and potentially buy cheaper, or wait for earnings to shake out the weak hands. If you're already long, take some chips off the table like the institutions are doing. This isn't a "set it and forget it" moment - it's a "manage your risk actively" moment.
Bottom line: Great company, great trends, terrible entry point. Wait for volatility or trade around earnings, but don't just blindly buy at all-time highs and hope. 💪
⚠️ Disclaimer: Options trading involves substantial risk and is not suitable for all investors. The strategies discussed involve complex multi-leg options positions with significant risk of loss. Past performance does not guarantee future results. This analysis is for educational purposes only and should not be considered financial advice. Always consult with a qualified financial advisor before making investment decisions.
📊 Data Sources: Option flow data from ThetaData, gamma exposure calculations from internal models, catalyst research from publicly available sources cited inline, technical analysis from market data as of December 22, 2025.
Analysis generated December 22, 2025 | Stock Price: $175.39 | Next Catalyst: Q2 FY2026 Earnings (January 28, 2026)
🔗 Related Links: