🎢 NOW $22.6M Diagonal Put Roll — Smart Money Quietly Shifts the Bear Trade Down and Out
📅 April 10, 2026 | 🔥 Unusual Activity Detected
🎯 The Quick Take
Someone just executed a $22.6M diagonal put roll in ServiceNow (NOW) — closing their August $85 puts and simultaneously opening December $60 puts. This isn't a panic move; it's a surgical reposition: the big player is locking in gains from their existing bearish bet, then rolling their protection down in strike and out in time through year-end. With NOW down roughly 45% from its January 2025 all-time high and Q1 2026 earnings just 12 days away, this trade screams "the bear case isn't over — it's just moving lower." 👀
📊 Company Overview
ServiceNow Inc (NOW) is the enterprise workflow automation leader, delivering its platform exclusively via SaaS to some of the world's largest organizations:
- Market Cap: ~$93.1 Billion
- Industry: Prepackaged Software (SaaS/Cloud)
- Exchange: NYSE
- Current Price: ~$83.87 (at time of trade)
- Primary Business: Structures and automates business processes — primarily IT function — for enterprise customers. Think of it as the "operating system" for large companies' internal operations: IT service desks, HR workflows, security operations, and increasingly, AI-native automation
💰 The Option Flow Breakdown
📊 The Tape (April 10, 2026 @ 10:00:22)
| Time | Symbol | Buy/Sell | Type | Expiration | Premium | Strike | Volume | OI | Size | Spot | Option Price | Open/Close |
|---|---|---|---|---|---|---|---|---|---|---|---|---|
| 10:00:22 | NOW | SELL | PUT $85 | 2026-08-21 | $8M | $85 | 13,000 | 14,000 | 6,613 | $83.87 | $12.10 | STC |
| 10:00:22 | NOW | BUY | PUT $60 | 2026-12-18 | $3.3M | $60 | 13,000 | 715 | 6,613 | $83.87 | $4.98 | BTO |
| 10:00:22 | NOW | SELL | PUT $85 | 2026-08-21 | $8M | $85 | 6,700 | 14,000 | 6,613 | $83.87 | $12.10 | STC |
| 10:00:22 | NOW | BUY | PUT $60 | 2026-12-18 | $3.3M | $60 | 6,600 | 715 | 6,612 | $83.87 | $4.98 | BTO |
Z-Score: EXTREMELY UNUSUAL across all 4 legs — this kind of simultaneous multi-leg roll happens just a few times a year in NOW.
🤓 What This Actually Means
Translation for regular folks: Someone previously had a massive bearish bet on NOW — specifically the August $85 puts, which are now deeply in the money with NOW trading at $83.87. Instead of sitting tight and waiting for August, they:
-
✅ Sold the August $85 puts (STC — Selling to Close): Pocketed $16M in premium from two tranches (6,613 + 6,612 contracts). These puts were already winning big — NOW is BELOW the $85 strike right now, so these puts are in the money.
-
📉 Bought December $60 puts (BTO — Buying to Open): Spent $6.6M total on new protection (two tranches), rolling their bearish thesis out to December 2026 at a much lower strike.
What's the logic? The trader is saying: "I've made money on the August $85 puts with NOW below $85. But I think the stock keeps falling — not just to $85, but potentially toward $60 by December. Let me lock in what I've made and reload at a lower strike with more time."
This is a diagonal put roll — moving the strike DOWN (from $85 to $60) and moving the expiration OUT (from August to December). It's a very deliberate, considered repositioning. Not a panic. Not a hedge. A calculated bear roll.
Why so unusual? The combined 19,700 contracts executed (across both expirations) vs open interest of just 715 on the December $60 puts tells you this is a brand-new position. The trader essentially built the entire current open interest on that December strike in a single morning. That's whale territory. 🐋
📈 Technical Setup / Chart Check-Up
YTD Performance Chart
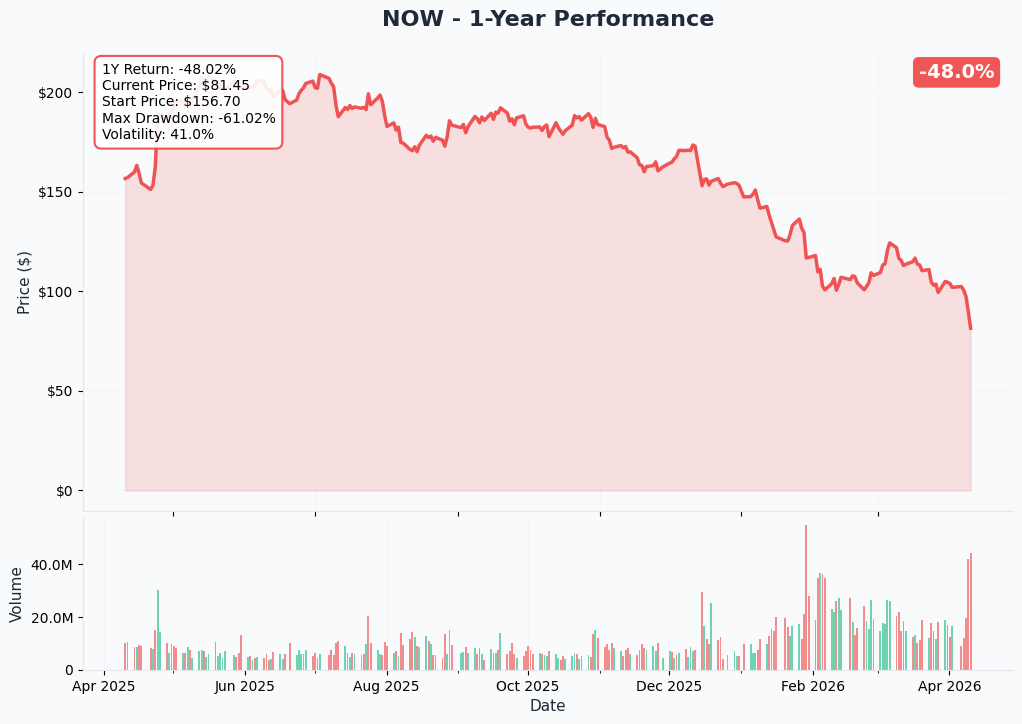
NOW has been an absolute disaster zone in 2026. The stock is down roughly 28% year-to-date and about 35% over the past year, sitting near $83.87 — well below its 52-week range of $88.66 to $211.48, which means it's even trading BELOW its 52-week low. The once high-flying SaaS darling has been caught in the "SaaSpocalypse" — a brutal combination of DOGE-driven federal budget cuts and fears that AI could cannibalize traditional enterprise software demand.
Key observations from the YTD chart:
- 📉 Staircase lower: No sustained bounces — every relief rally has been sold
- ⚠️ Below all moving averages: Stock is in full breakdown mode with no technical support nearby
- 📊 Volume on down days: Institutional distribution pattern, not panic retail selling
- 🎢 High volatility: The implied move data confirms significant uncertainty heading into earnings
Gamma-Based Support & Resistance Analysis
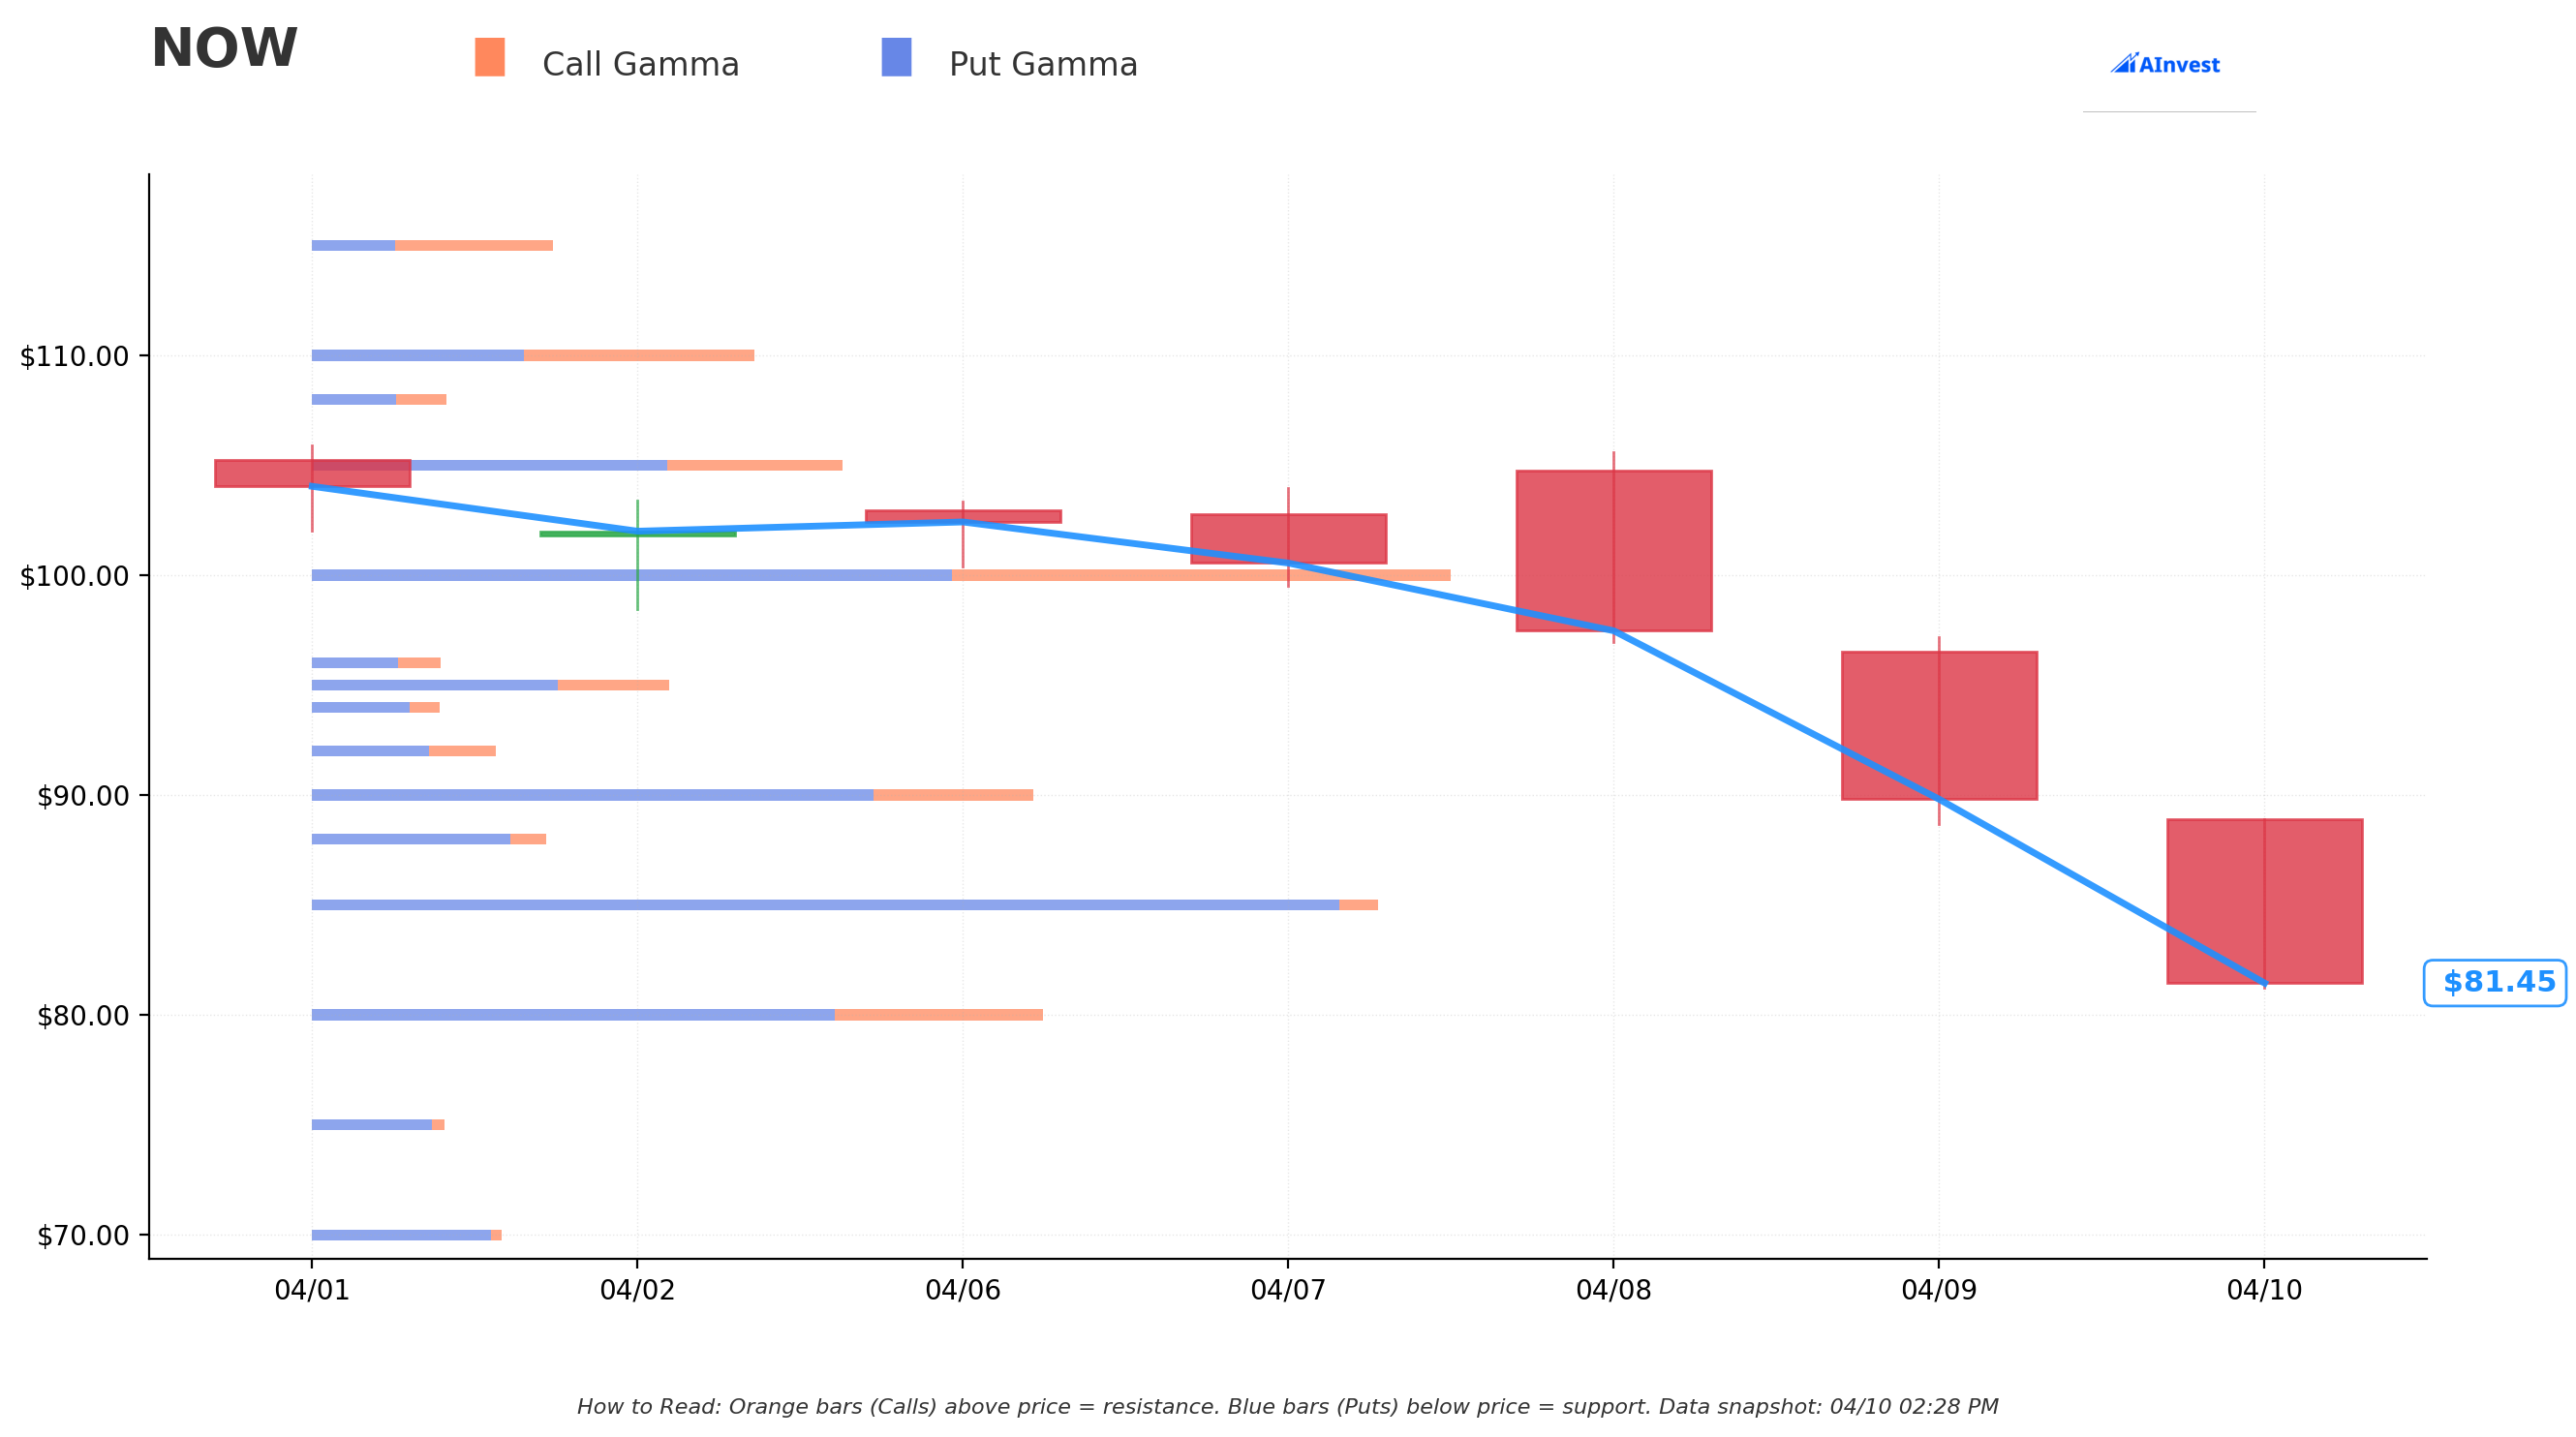
Current Price: ~$81.47 (GEX snapshot)
The gamma exposure (GEX) map shows a critically important picture: there is far more put gamma than call gamma in the NOW options market right now. That bearish 34.3B put GEX vs 24.0B call GEX net bias is the options market's way of saying: dealers are hedging to the downside, and the weight of open interest is pulling price lower.
🔵 Support Levels (Put Gamma — floors where market makers buy dips):
- $80 — Strongest support, 4.05B total gamma, just 1.8% below current price. This is the near-term line in the sand — if NOW loses $80, things get ugly fast
- $75 — Secondary support at 0.73B gamma, 7.9% below current levels
- $70 — Deep support at 1.05B gamma, 14.1% lower — meaningful structural floor
🟠 Resistance Levels (Call Gamma — ceilings where rallies get sold):
- $85 — The DOMINANT resistance level with 5.94B total gamma (nearly all put-driven, creating a massive ceiling). This is EXACTLY where the roll was closed. The smart money was selling right at peak gamma resistance — that's not coincidence 👀
- $88 — Secondary ceiling at 1.30B gamma, 8% above current price
- $90 — Major resistance at 4.04B gamma, 10.5% overhead
- $95 — Extended ceiling at 2.08B gamma
What this means for traders: NOW is pinned below the $85 gamma wall with near-term support at $80. The options market structure is fundamentally bearish — the weight of put open interest creates natural dealer selling pressure as the stock tries to rally. The big money rolled their puts DOWN to $60, suggesting they think NOW can break through the $80 support floor and fall toward deeper levels. The net GEX bias is Bearish — this confirms the direction of institutional positioning.
Implied Move Analysis
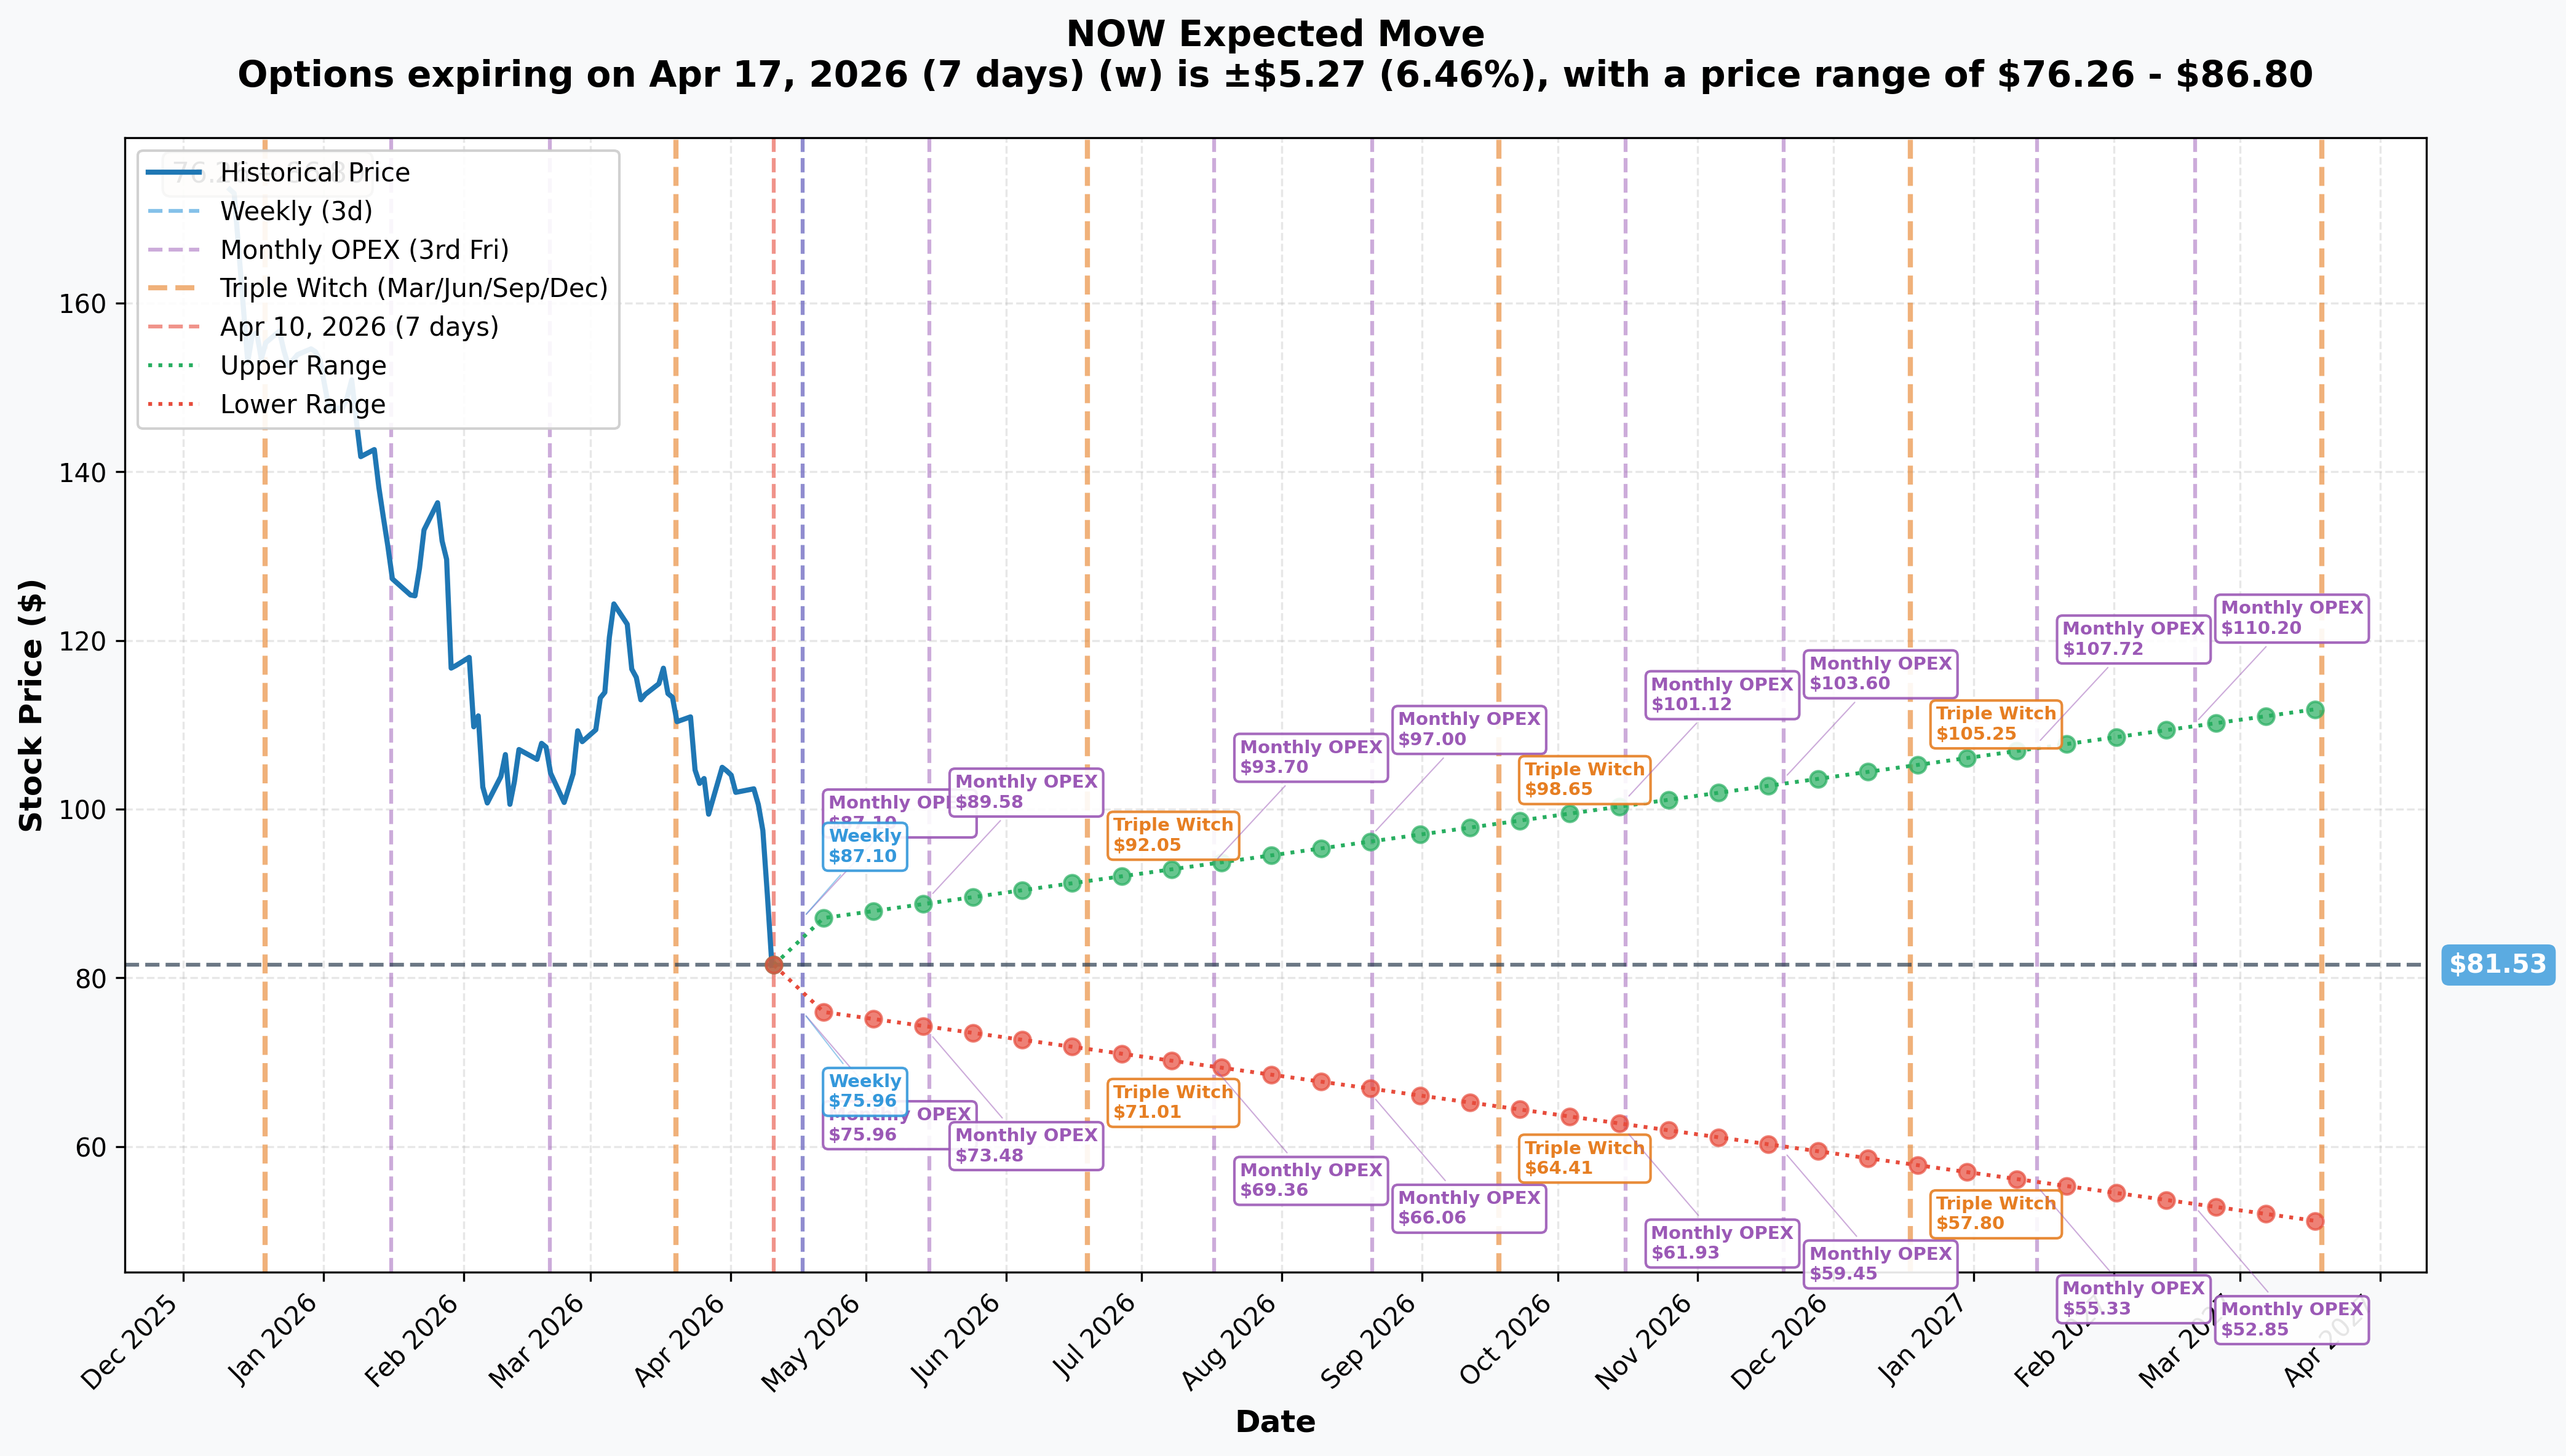
Current Price: $81.53 (implied move snapshot)
The options market is pricing in significant uncertainty across all timeframes:
- 📅 Weekly (April 17, 7 days): ±$5.27 (±6.46%) → Range: $76.26 — $86.80. NOW could be at $76 or $87 by next Friday. That's a massive weekly range for a $93B company.
- 📅 April OPEX (April 17, same week): ±$5.27 (±6.46%) → Range: $75.96 — $87.10
- 📅 May OPEX (May 15): Range $73.48 — $89.58
- 📅 June Triple Witch (June 19): Range $71.01 — $92.05
- 📅 July OPEX (July 17): Range $69.36 — $93.70
- 📅 August OPEX (August 21): Range $66.06 — $97.00 ← This is when the rolled-out puts were originally set to expire
- 📅 December Triple Witch (December 18): Range $57.80 — $105.25 ← This is when the NEW December $60 puts expire
Key insight: The December implied move lower range is $57.80 — meaning the options market is already pricing in a scenario where NOW trades below $60 by year-end. The $60 put buyer is essentially betting the options market's own lower bound scenario plays out. And by December, the lower range of $57.80 is BELOW the $60 strike, meaning at current implied volatility, these puts have a real probability of finishing in the money.
The sharp increase in implied volatility from weekly (6.46%) out to LEAPS (37.38% for March 2027) reflects the enormous uncertainty around earnings, DOGE cuts, and the broader SaaS re-rating. Translation: The market expects continued fireworks — buy insurance now or face the music later. 🎢
🎪 Catalysts
🔥 Immediate Catalysts (Next 2 Weeks — HIGH IMPACT)
Q1 2026 Earnings — April 22, 2026 (12 DAYS AWAY!) 📊
This is the single biggest near-term wildcard. ServiceNow reports Q1 2026 results on April 22, and the stakes couldn't be higher:
- 📊 Company guidance: Subscription revenue of $3.65B-$3.655B (+18.5-19% YoY) — the question is whether DOGE federal spending cuts have started showing up in the numbers
- 🤖 Now Assist update: The AI product surpassed $600M in net new ACV last quarter — watch for a run-rate update toward the $1B milestone
- 🏛️ Federal segment: The public sector was growing 30% before DOGE aggressively pruned software contracts — any guidance cut here would be brutal
- 💡 cRPO growth: Last quarter delivered $12.85B, +25% YoY — slowing would confirm the bear thesis
- ⚠️ The bear case: Any miss on federal revenue + conservative full-year guidance revision could send NOW below $80 fast
ServiceNow SDK & Build Agent Launch — April 15, 2026
On April 15, ServiceNow opens its platform to third-party developer tools — including Claude Code, Cursor, OpenAI Codex, and Windsurf. This is a potential positive catalyst but market reaction to the April 9 AI portfolio overhaul "failed to impress" — suggesting skepticism is high.
🚀 Near-Term Catalysts (Next 3 Months)
AI-Native Portfolio Overhaul — Announced April 9, 2026
Just yesterday, ServiceNow announced the end of the "sidecar AI era", embedding AI, data, security, and governance across ALL product tiers at no extra license cost. Highlights:
- 🤖 Context Engine: Leverages 85B workflows and 7T transactions to feed LLMs with organization-specific context
- 🏢 L1 Service Desk AI Specialist: Autonomously handles password resets, software provisioning, and network troubleshooting — launching next quarter
- ⚠️ Bear risk: UBS cited concerns that making AI free across tiers could cannibalize premium revenue
Knowledge 2026 Conference — May 5-7, Las Vegas
ServiceNow's flagship annual event at the Venetian/Wynn is historically a stock-mover with major product announcements and customer wins. Bullish if AI monetization stories resonate; bearish if attendance or enterprise spending signals are weak.
📅 Longer-Term Catalysts (Affecting the December $60 Puts)
- Q2 2026 Earnings (Expected Late July): First quarter to fully reflect the April 9 AI-native pricing changes — critical inflection point
- Armis Acquisition Close — H2 2026: $7.75B all-cash deal to expand security into IT, OT, and medical devices — largest acquisition ever; integration risk is real
- Now Assist $1B ACV milestone: Tracking toward $1B by year-end — hit this and the bear thesis softens; miss and the $60 puts look smart
📉 Past Catalysts (Already Happened)
Q4 2025 Earnings — January 28, 2026
A massive beat that still triggered a selloff — the ultimate bad omen:
- Total Revenue $3.57B vs $3.53B consensus; EPS $0.92 vs $0.72 expected (+28% beat)
- FY2026 subscription guidance: $15.53B-$15.57B (+21.5% YoY)
- $5B share buyback authorized — yet shares fell ~10% the next day on the "SaaSpocalypse" narrative
April 2 Tariff Selloff
NOW plunged 10.4% on April 2 during an enterprise software selloff triggered by DOGE federal budget cut fears and geopolitical volatility. Shares briefly recovered ~15% with the software sector around April 7, then UBS downgraded to Neutral with a $100 price target (from $170) pushed shares back below $90.
Analyst Activity (Recent):
| Firm | Rating | Price Target | Change | Date |
|---|---|---|---|---|
| UBS | Downgrade to Neutral | $100 (from $170) | -41% | April 8, 2026 |
| BTIG | Buy (maintained) | $185 (from $200) | -8% | April 7, 2026 |
| Goldman Sachs | Buy (maintained) | $188 (from $216) | -13% | Recent |
| Stifel | Hold | $135 (from $180) | -25% | Recent |
CEO Insider Buying: Bill McDermott purchased 411,230 shares between December 23, 2025 and March 23, 2026 — a notable contrarian signal against the bearish institutional put roll we're analyzing today.
🎲 Price Targets & Probabilities
Using gamma levels, implied move data, and the catalyst calendar, here's how the three scenarios play out:
😰 Bear Case — The $60 Put Thesis (Target: $60-$66)
Probability: ~25-35%
- The December implied move lower bound is $57.80 — the options market is pricing this as a real (not remote) scenario
- August OPEX lower bound: $66.06 — the rolled-out Aug $85 trade was right to close there
- If Q1 earnings miss on federal revenue guidance + Q2 numbers disappoint, the stock could re-rate to 4-5x forward revenues (~$62-$78B market cap range)
- The $60 strike lands between the GEX $75 deep support and the December lower implied bound of $57.80 — that's the sweet spot for the December put buyer
- Key trigger: Q1 federal segment weakness + cRPO deceleration below 20%
⚖️ Base Case — Sideways Grind (Target: $78-$90)
Probability: ~45-55%
- NOW is currently below the $85 gamma wall (strongest resistance) and above the $80 support (1.8% away)
- Without a catalyst, gamma pinning between $80-$85 is the path of least resistance
- The April weekly implied move of ±$5.27 keeps price between $76.26 and $86.80 through April 17 OPEX
- Key driver: Earnings in-line + no federal revenue guidance cut = range-bound recovery to $85-$90
🚀 Bull Case — Recovery (Target: $90-$100)
Probability: ~20-25%
- UBS price target of $100 (the most bearish street estimate!) represents the upside ceiling for near-term recovery
- Consensus at ~$185 with 43 Buy ratings suggests the market could violently re-rate if AI monetization evidence is strong
- $90 gamma resistance would need to be cleared — requires a clean Q1 beat and positive federal segment outlook
- Key trigger: Q1 beat + Knowledge 2026 catalysts + Now Assist $1B ACV update ahead of schedule
💡 Trading Ideas
⚠️ These are educational ideas only — options trading involves substantial risk and is not suitable for all investors. Always size appropriately and never risk more than you can afford to lose.
🛡️ Conservative — "Sleep Tight" Put Spread
Strategy: Buy the June $80/$70 put spread Cost: Approximately $2.50-$3.00 debit (estimate based on current levels) Max gain: ~$7-7.50 | Max loss:** Debit paid Why this works: You define your risk precisely and don't need NOW to collapse — just to stay under $80 through June 19 (Triple Witch). The implied move lower bound for June is $71.01, so your spread has room to fully profit. You're not betting the farm; you're paying for a defined-risk, directional play with earnings as the trigger. Mark your calendar: Q1 earnings April 22 is your make-or-break moment.
⚖️ Balanced — "Copycat" December $70/$60 Put Spread
Strategy: Buy the Dec $70 puts, sell the Dec $55 puts Why this works: You're essentially mimicking the institutional trade at a lower cost basis. You get bearish exposure through December — capturing Q2 earnings, Knowledge 2026, and Armis news flow — at a fraction of the cost of buying outright puts. The December lower implied bound of $57.80 puts your spread fully in the money in the options market's own downside scenario. Risk: If NOW stages a recovery to $90+ post-earnings, your spread expires worthless. Keep position size small (2-3% of portfolio).
🚀 Aggressive — "Event Bet" April 22 Earnings Straddle
Strategy: Buy the April 24 $82 straddle (or nearest at-the-money strike) before earnings Why this works: The weekly implied move is ±6.46% — but earnings historically produce larger moves for NOW. You profit from a BIG move in either direction. If NOW drops to $75 or rallies to $90 post-earnings, you win. If it goes sideways, you lose the premium. Reality check: Straddles are expensive going into earnings — this is a pure volatility play. The options market may already be pricing in the earnings move, so you need a LARGER move than what's priced to profit. High risk. Small size only. 🎰
⚠️ Risk Factors
What could go wrong with the bear thesis:
- 🚀 Earnings beat + buyback acceleration: The $5B buyback authorization gives ServiceNow significant ammunition to buy back shares at these depressed levels. A quarter of $1B+ in buybacks would be a powerful floor
- 🤖 Now Assist $1B ACV comes early: If the AI product hits the $1B run rate ahead of year-end, the market narrative flips from "SaaSpocalypse" to "AI winner" overnight
- 🧑💼 CEO insider buying: McDermott bought 411K shares between December and March — that's real money put at risk by the person who knows this business best
- 📈 Consensus re-rating: With 43 Buy ratings and a $185 average price target, any positive earnings surprise could trigger a violent short squeeze. The pain trade is UP.
- 🤝 AI partnership catalysts: OpenAI, Anthropic, and NVIDIA GTC 2026 collaboration could unlock new enterprise use cases faster than expected
What could accelerate the bear case:
- 🏛️ DOGE cuts bite Q1 revenues: Federal/public sector was growing 30% before DOGE — even a 10% decline in that segment would shake guidance
- 💸 Armis acquisition cash strain: $7.75B all-cash deal for a cybersecurity company at peak integration risk; any stumble here gets punished in this environment
- 🤖 AI cannibalization narrative deepens: The "SaaSpocalypse" narrative argues AI reduces demand for traditional SaaS workflows — if Salesforce Agentforce for IT takes share, multiple compression continues
- 📉 Breakdown below $80 support: Losing the $80 gamma support level would remove the last major technical floor before $75. The December $60 put buyer likely has this as their trigger
- 🌍 Macro geopolitical headwinds: Enterprise software budgets were already tightening before the April 2 selloff — any further macro deterioration hits renewal rates
🎯 The Bottom Line
Real talk: This $22.6M diagonal put roll is one of the most deliberate, sophisticated bearish repositions we've seen in NOW this year. This isn't someone panicking out of a position — it's someone WHO ALREADY WON on the August $85 puts (NOW is trading BELOW $85 right now, so those puts printed money) systematically reinvesting their winnings into a lower-strike, longer-dated bearish bet.
Three scenarios, what to do:
🐻 If you're bearish like the whale: The Dec $60 put strategy is a direct copycat — but size it conservatively. You have Q1 earnings (April 22), Q2 earnings (late July), and the Armis integration risk as catalysts between now and December. The options market's own lower bound of $57.80 in December validates the $60 put strike.
👀 If you're watching from the sidelines: Mark April 22 on your calendar. Q1 earnings is the moment of truth. If NOW misses on federal revenue OR guides cRPO growth below 20%, the move toward $75-$70 accelerates. If it beats and buybacks kick in, the pain trade is a violent reversal to $95+.
🐂 If you're a contrarian bull: CEO McDermott spent real money buying 411K shares between December and March. The consensus price target of ~$185 implies 120% upside from here. At 5.5x forward revenue, NOW trades at its cheapest valuation in years. This could be the moment to start building a long position — but only with a tight stop below $78 (the $80 support break level).
The memorable lesson: When someone closes a massive winning put position at the current strike ($85, right where gamma resistance is strongest) and immediately rolls to a LOWER strike with MORE time — they're not done. They're reloading. The bear isn't leaving the building. They're just moving to a lower floor. 📉
⚠️ Disclaimer: This analysis is for educational and informational purposes only and does not constitute financial, investment, or trading advice. Options trading involves substantial risk of loss and is not appropriate for all investors. Past performance of options strategies does not guarantee future results. Always conduct your own due diligence and consult a qualified financial advisor before making any investment decisions. The unusual options activity described may reflect hedging, speculation, or other strategies not visible from public data alone.