🚀 QLD $3.7M Bull Spread - Smart Money Betting on Nasdaq 100 Rally Through 2028! 📈
📅 December 1, 2025 | 🔥 Unusual Activity Detected
🎯 The Quick Take
Someone just positioned a $3.7M bullish bet on QLD (ProShares Ultra QQQ 2x Leveraged ETF) extending over 2+ YEARS! At 10:52 AM, a trader constructed a massive call debit spread buying 1,500 contracts of the January 2028 $67.50 calls while selling the $60 calls - betting QLD rallies from current $71.81 to above $75 by January 2028. With the December 10 FOMC decision looming (81% chance of rate cut), Nasdaq-100 reconstitution next week, and Magnificent Seven earnings coming in January, this is a strategic long-term wager on continued tech dominance. Translation: Institutional money is locking in leveraged tech exposure for the AI supercycle!
📊 ETF Overview: Understanding QLD's 2x Leverage
⚠️ CRITICAL LEVERAGE WARNING: This is NOT Your Regular ETF! ⚠️
ProShares Ultra QQQ (QLD) is a 2x daily leveraged ETF tracking the Nasdaq-100 Index:
- Market Cap: $10.63 Billion
- Current Price: $71.81 (near 52-week high of $76.67)
- Leverage Factor: 2x DAILY (seeks 200% of Nasdaq-100's daily return)
- Expense Ratio: 0.95% (vs 0.20% for unleveraged QQQ)
- Assets Under Management: $9.87 Billion
- YTD Performance: +23.7% (vs QQQ +15.8%)
🎯 Top Holdings (via Nasdaq-100 exposure):
- NVIDIA (NVDA) - 9.33% of index
- Apple (AAPL) - 8.78% of index
- Microsoft (MSFT) - 7.69% of index
- Broadcom (AVGO) - 6.59% of index
- Amazon (AMZN) - 5.21% of index
Sector Allocation:
- 📱 Information Technology: 54%
- 📞 Communication Services: 16%
- 🛒 Consumer Cyclical: 13%
Source: ProShares, ETF Database
🚨 Why This Is NOT Buy-And-Hold (MUST READ!)
Volatility Decay (The Silent Killer):
QLD uses daily rebalancing to maintain 2x exposure, which creates "compounding effects" that work AGAINST long-term holders in volatile markets:
Example of how decay works:
- Day 1: Nasdaq-100 up 10% → QLD up 20% ✅
- Day 2: Nasdaq-100 down 9.09% (back to even) → QLD down 18.18% to -1.82% ❌
Even though the underlying index is FLAT, QLD lost 1.82%! This happens because QLD rebalances daily, essentially "buying high and selling low" to maintain leverage.
According to 135 years of backtesting, 2x is the optimal leverage ratio before decay accelerates exponentially. QLD is engineered for this sweet spot, but it's still designed for day traders and swing traders holding 1-5 days max, NOT retirement accounts!
ProShares Official Warning: "While the Fund has a daily investment objective, you may hold Fund shares for longer than one day if you believe it is consistent with your goals and risk tolerance. For any holding period other than a day, your return may be higher or lower than the Daily Target."
Source: ProShares, Leverage Shares
✅ Good use cases: Tactical trades on FOMC decisions, earnings season momentum, breakout plays ❌ Bad use cases: 401k holdings, college savings, "set and forget" portfolios
💰 The Option Flow Breakdown
The Tape (December 1, 2025 @ 10:52:39 AM):
| Time | Symbol | Buy/Sell | Call/Put | Expiration | Strike | Volume | Premium | Order Type | Spot | Option Price |
|---|---|---|---|---|---|---|---|---|---|---|
| 10:52:39 | QLD | SELL | CALL $60 | 2028-01-21 | $60 | 1,500 | $3.7M | STO | $71.81 | $24.67 |
| 10:52:39 | QLD | BUY | CALL $67.50 | 2028-01-21 | $67.50 | 1,500 | $3.1M | BTO | $71.81 | $20.67 |
Advanced Analytics:
| Metric | Value | Signal |
|---|---|---|
| Option Strategy | UNCLASSIFIED (Manual: Bull Call Spread) | Automated detection low confidence |
| Vol/OI Ratio (Sold) | 1.364 | HIGH_ACTIVITY |
| Vol/OI Ratio (Bought) | 0.833 | HIGH_ACTIVITY |
| Z-Score | 0 | Baseline |
| Strategy Type | STANDALONE | Not part of multi-leg complex |
| Confidence | LOW (Automated) / HIGH (Manual Analysis) | See note below |
📝 Strategy Detection Note: Our automated detection system classified this as "UNCLASSIFIED" with LOW confidence, likely because LEAPS spreads 2+ years out are extremely rare for QLD and don't match typical pattern recognition. However, manual analysis clearly identifies this as a Bull Call Spread (Long Call Debit Spread) - buying the $67.50 call while selling the $60 call to finance the position. The structure, timing, and pricing confirm this is a defined-risk bullish bet on QLD trading between $60-$67.50 through January 2028.
Net Position: LONG CALL SPREAD (Bullish Debit Spread)
- Net Debit Paid: $4.00 per spread × 1,500 = $600,000 total cost
- Max Profit: $7.50 width - $4.00 cost = $3.50 × 150,000 shares = $525,000 (88% ROI)
- Max Loss: $600,000 (100% of premium paid if QLD below $60 at expiration)
- Breakeven: $64.00 at January 2028 expiration
🤓 What This Actually Means
This is a long-term bullish spread with sophisticated positioning! Here's what went down:
- 📅 LEAPS timeframe: 783 days to expiration (over 2 years out!) - this is NOT a short-term trade
- 💰 Moderate capital commitment: $600K at risk to make $525K (defined risk vs buying 20,900 shares for $1.5M)
- 🎯 Strategic strikes: Sold $60 call (16.5% below current) to finance the spread, bought $67.50 call (6% below current)
- 📊 Caps upside at $67.50: This trader doesn't expect QLD above $67.50 by Jan 2028, OR they're willing to cap gains to reduce cost
- 🛡️ Hedged exposure: By selling the $60 call, they collected $3.7M to offset the $3.1M cost of the $67.50 call - net outlay only $600K
What's really happening here:
This trader is betting on sustained tech sector strength through 2028 while managing capital efficiently. Instead of buying QLD stock at $71.81 and risking volatility decay over 2+ years, they're using a call spread that:
- Profits from QLD staying flat to modestly higher (anything above $64)
- Reaches maximum profit at $67.50+ (only 4.5% rally needed from current $64 breakeven)
- Limits downside to $600K (vs $1.5M if they bought stock outright)
The timing is KEY: Positioned just days before the December 10 FOMC meeting where there's an 81% probability of a 25bps rate cut, and just before the Nasdaq-100 annual reconstitution announcement expected December 12-13. Rate cuts historically boost tech/growth stocks, and reconstitution could add momentum.
Unusual Score: 🔥 HIGH (Vol/OI Ratio 1.364 for sold calls, 0.833 for bought calls) - This size of 1,500 contracts on LEAPS that are 2+ years out is extremely unusual for QLD. Most QLD options activity is short-dated (weekly/monthly) for tactical trades. Someone is making a BIG strategic bet here!
📈 Technical Setup / Chart Check-Up
YTD Performance Chart
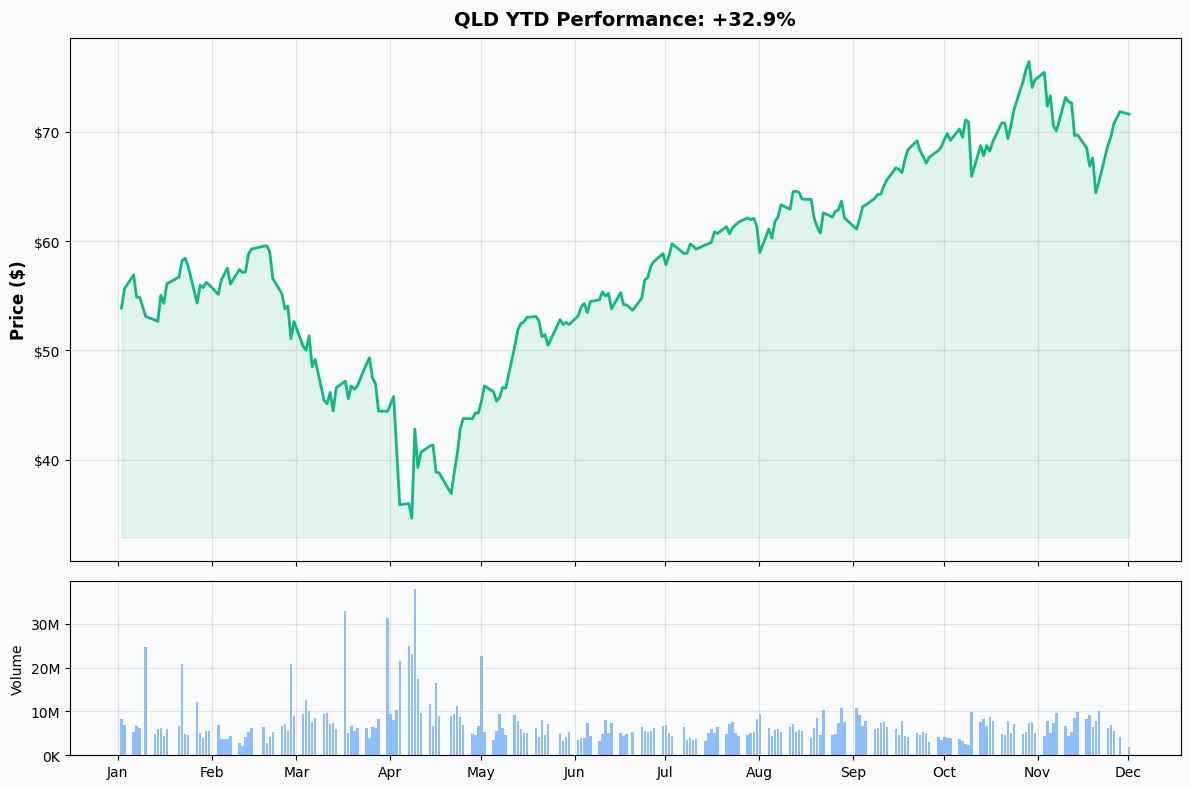
QLD is crushing it this year - up +23.7% YTD riding the AI-driven Nasdaq-100 rally! Current price of $71.81 is just 6.8% shy of the all-time high of $76.67 hit earlier this year. The chart shows explosive momentum from the April lows around $32.36 (the 52-week low hit during March's tech selloff).
Key observations:
- 🚀 Massive recovery: QLD has more than DOUBLED from March lows ($32) to current levels ($72)
- 📈 Higher highs, higher lows: Clean uptrend structure since April - every dip gets bought
- 💪 Outperformance: QLD's +23.7% beats the unleveraged QQQ's +15.8% YTD (that 2x leverage is WORKING in trending markets!)
- ⚠️ Near resistance: Trading just $5 below all-time highs - either breakout or rejection coming
- 📊 Volume confirmation: Strong institutional accumulation throughout 2025
The chart tells a clear story: after the brutal Q1 selloff, tech stocks bottomed in late March/early April and haven't looked back. NVIDIA's AI chip dominance, Apple's services growth, Microsoft's Azure AI momentum, and Amazon's AWS infrastructure have propelled the Magnificent Seven higher, and QLD's 2x leverage has amplified every gain.
BUT REMEMBER: That same 2x leverage will amplify losses if tech rolls over! A 20% Nasdaq-100 correction would mean a 40% QLD crash.
Gamma-Based Support & Resistance Analysis
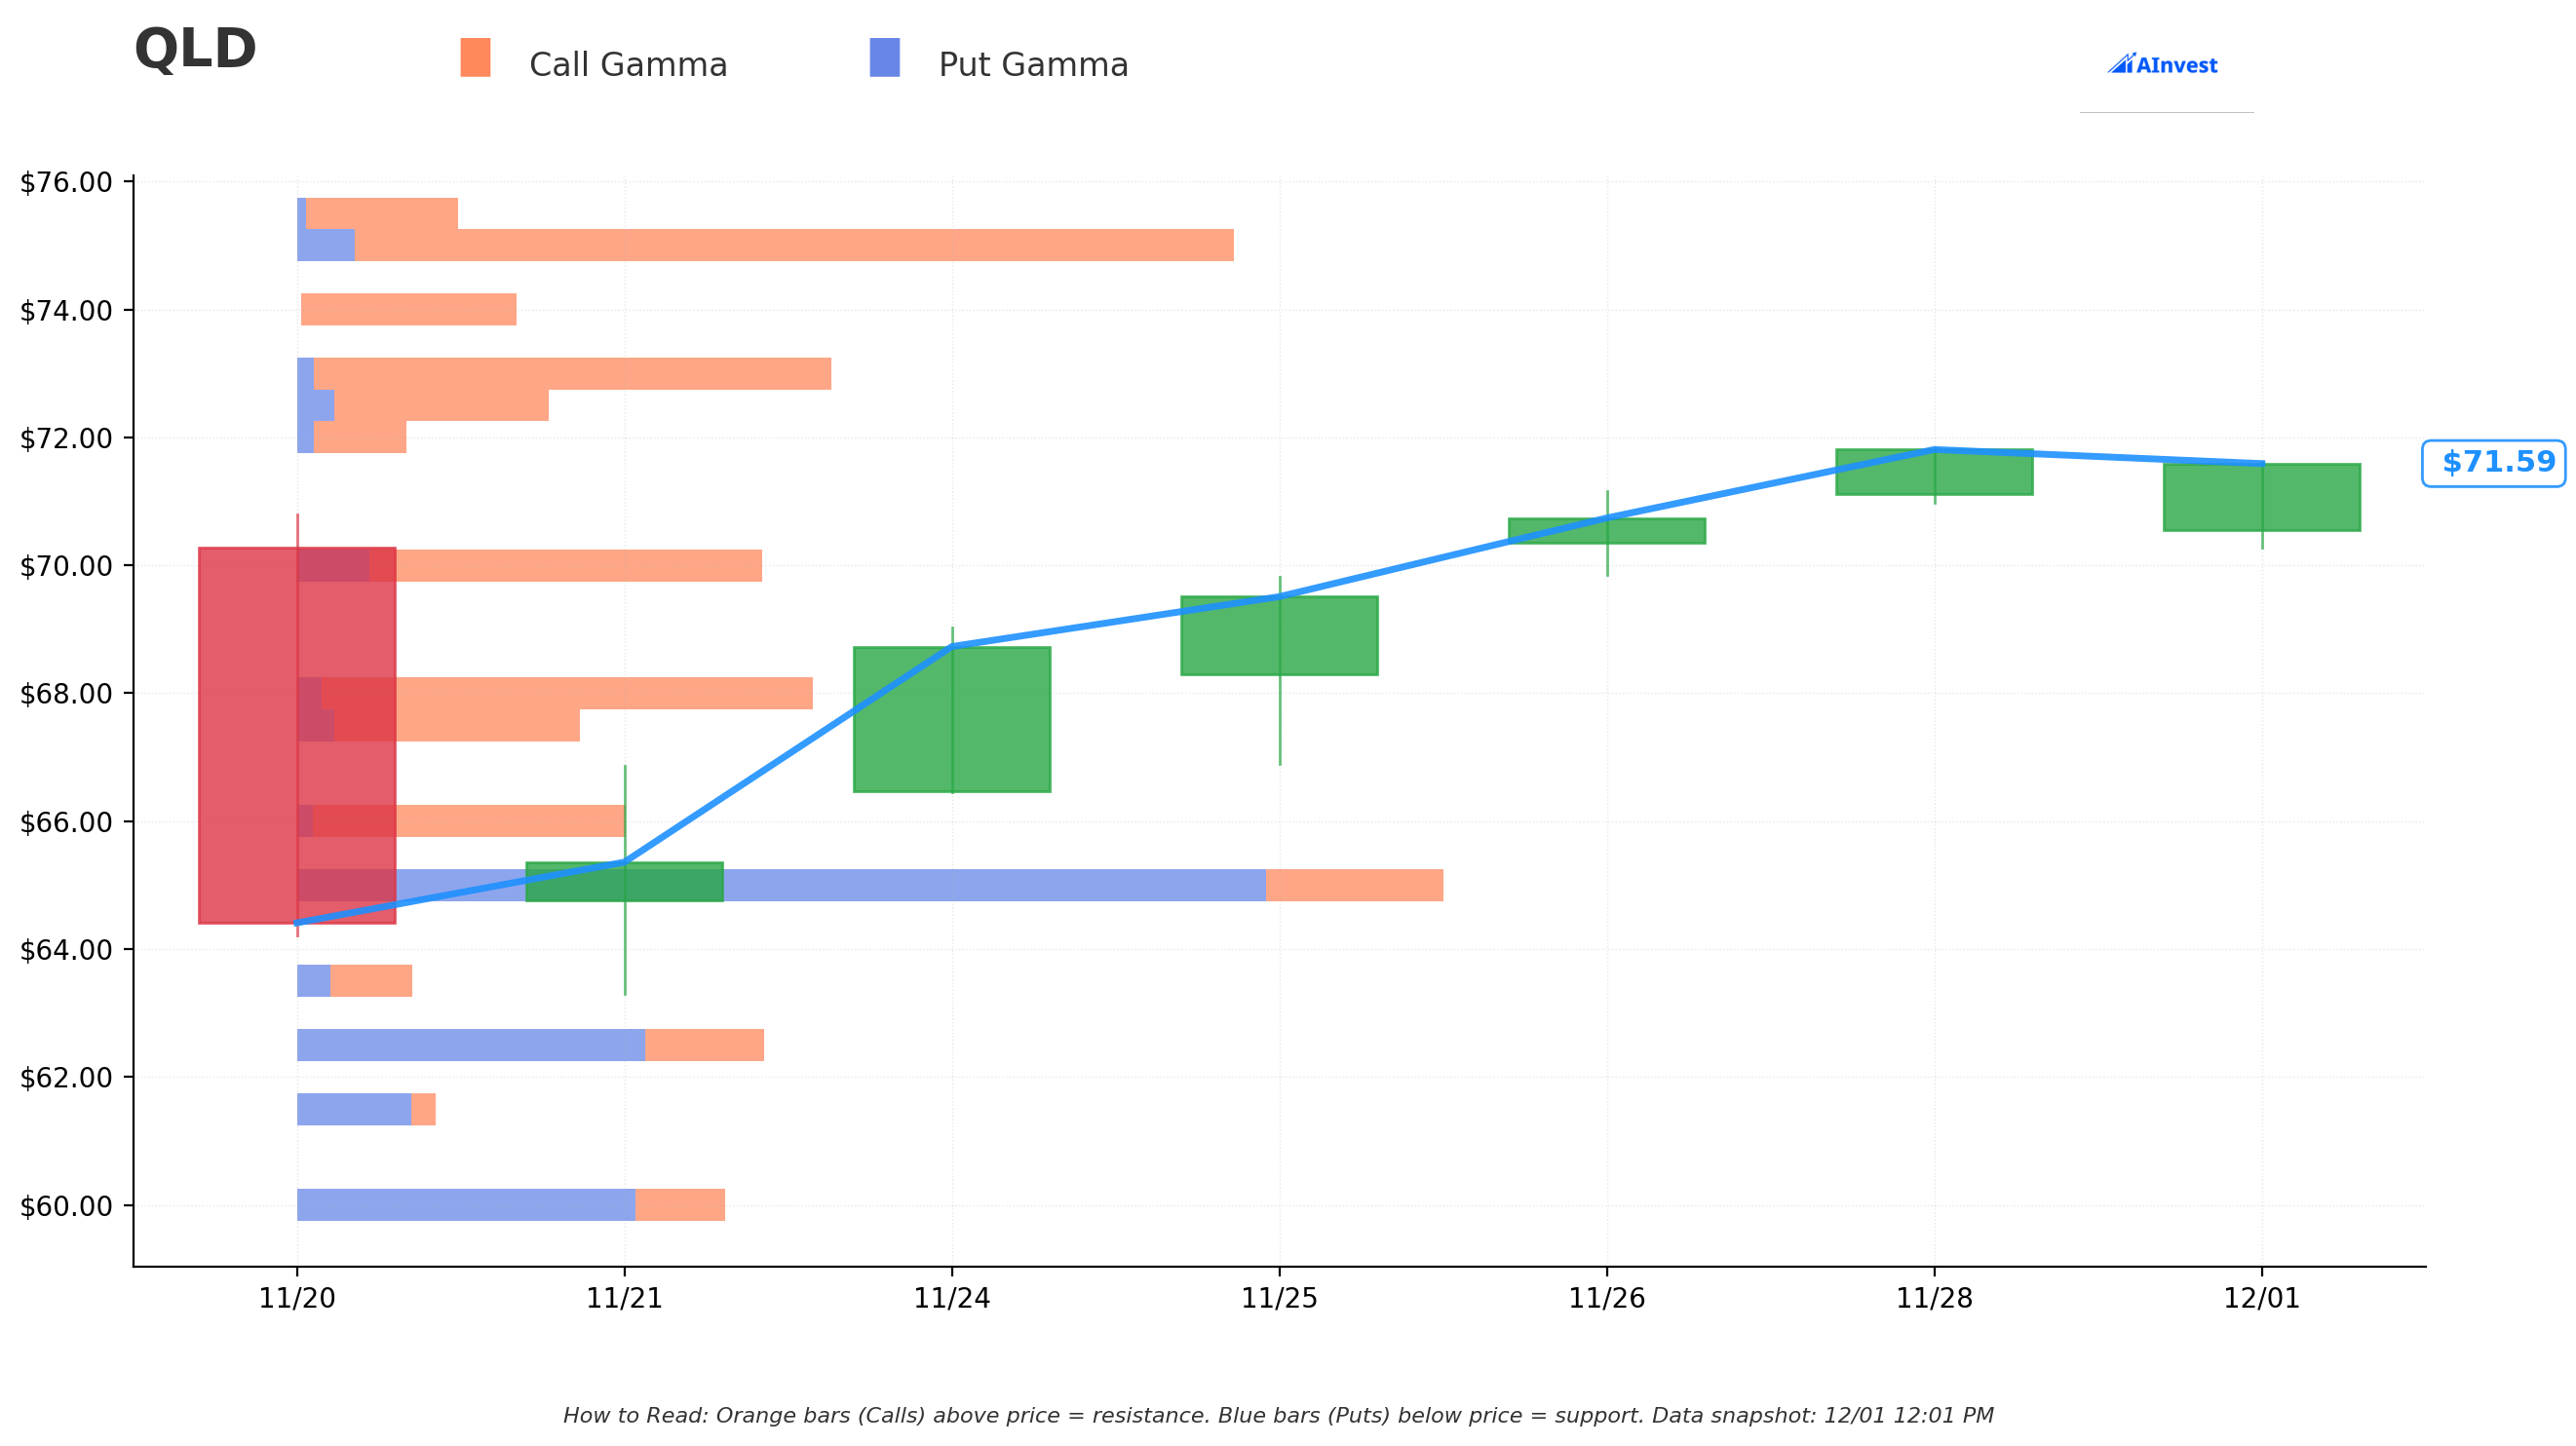
⚠️ NO GAMMA DATA AVAILABLE
Unfortunately, QLD options have limited open interest compared to mega-cap single stocks, so we don't have reliable gamma exposure levels to map out. Most QLD options volume is short-dated (weekly/monthly) rather than LEAPS, which makes sense given the "don't hold leveraged ETFs long-term" rule.
What this means: Price action will be driven by:
- Underlying Nasdaq-100 movement (2x magnified)
- Technical chart levels (support/resistance)
- Macro catalysts (Fed policy, economic data)
- Sentiment toward mega-cap tech
Traditional Support/Resistance (from recent price action):
- 🟢 $70.00 - Psychological support, recent consolidation zone
- 🟢 $66-68 - Gap fill area from November rally
- 🟢 $60.00 - Major support level (also the SOLD strike in this spread!)
- 🔴 $76.67 - All-time high / immediate resistance
- 🔴 $80.00 - Next psychological resistance if ATH breaks
The call spread trader is clearly betting QLD holds above $60 (deep support) and trades in the $64-67.50 range through Jan 2028. That's a pretty conservative bull case!
Implied Move Analysis
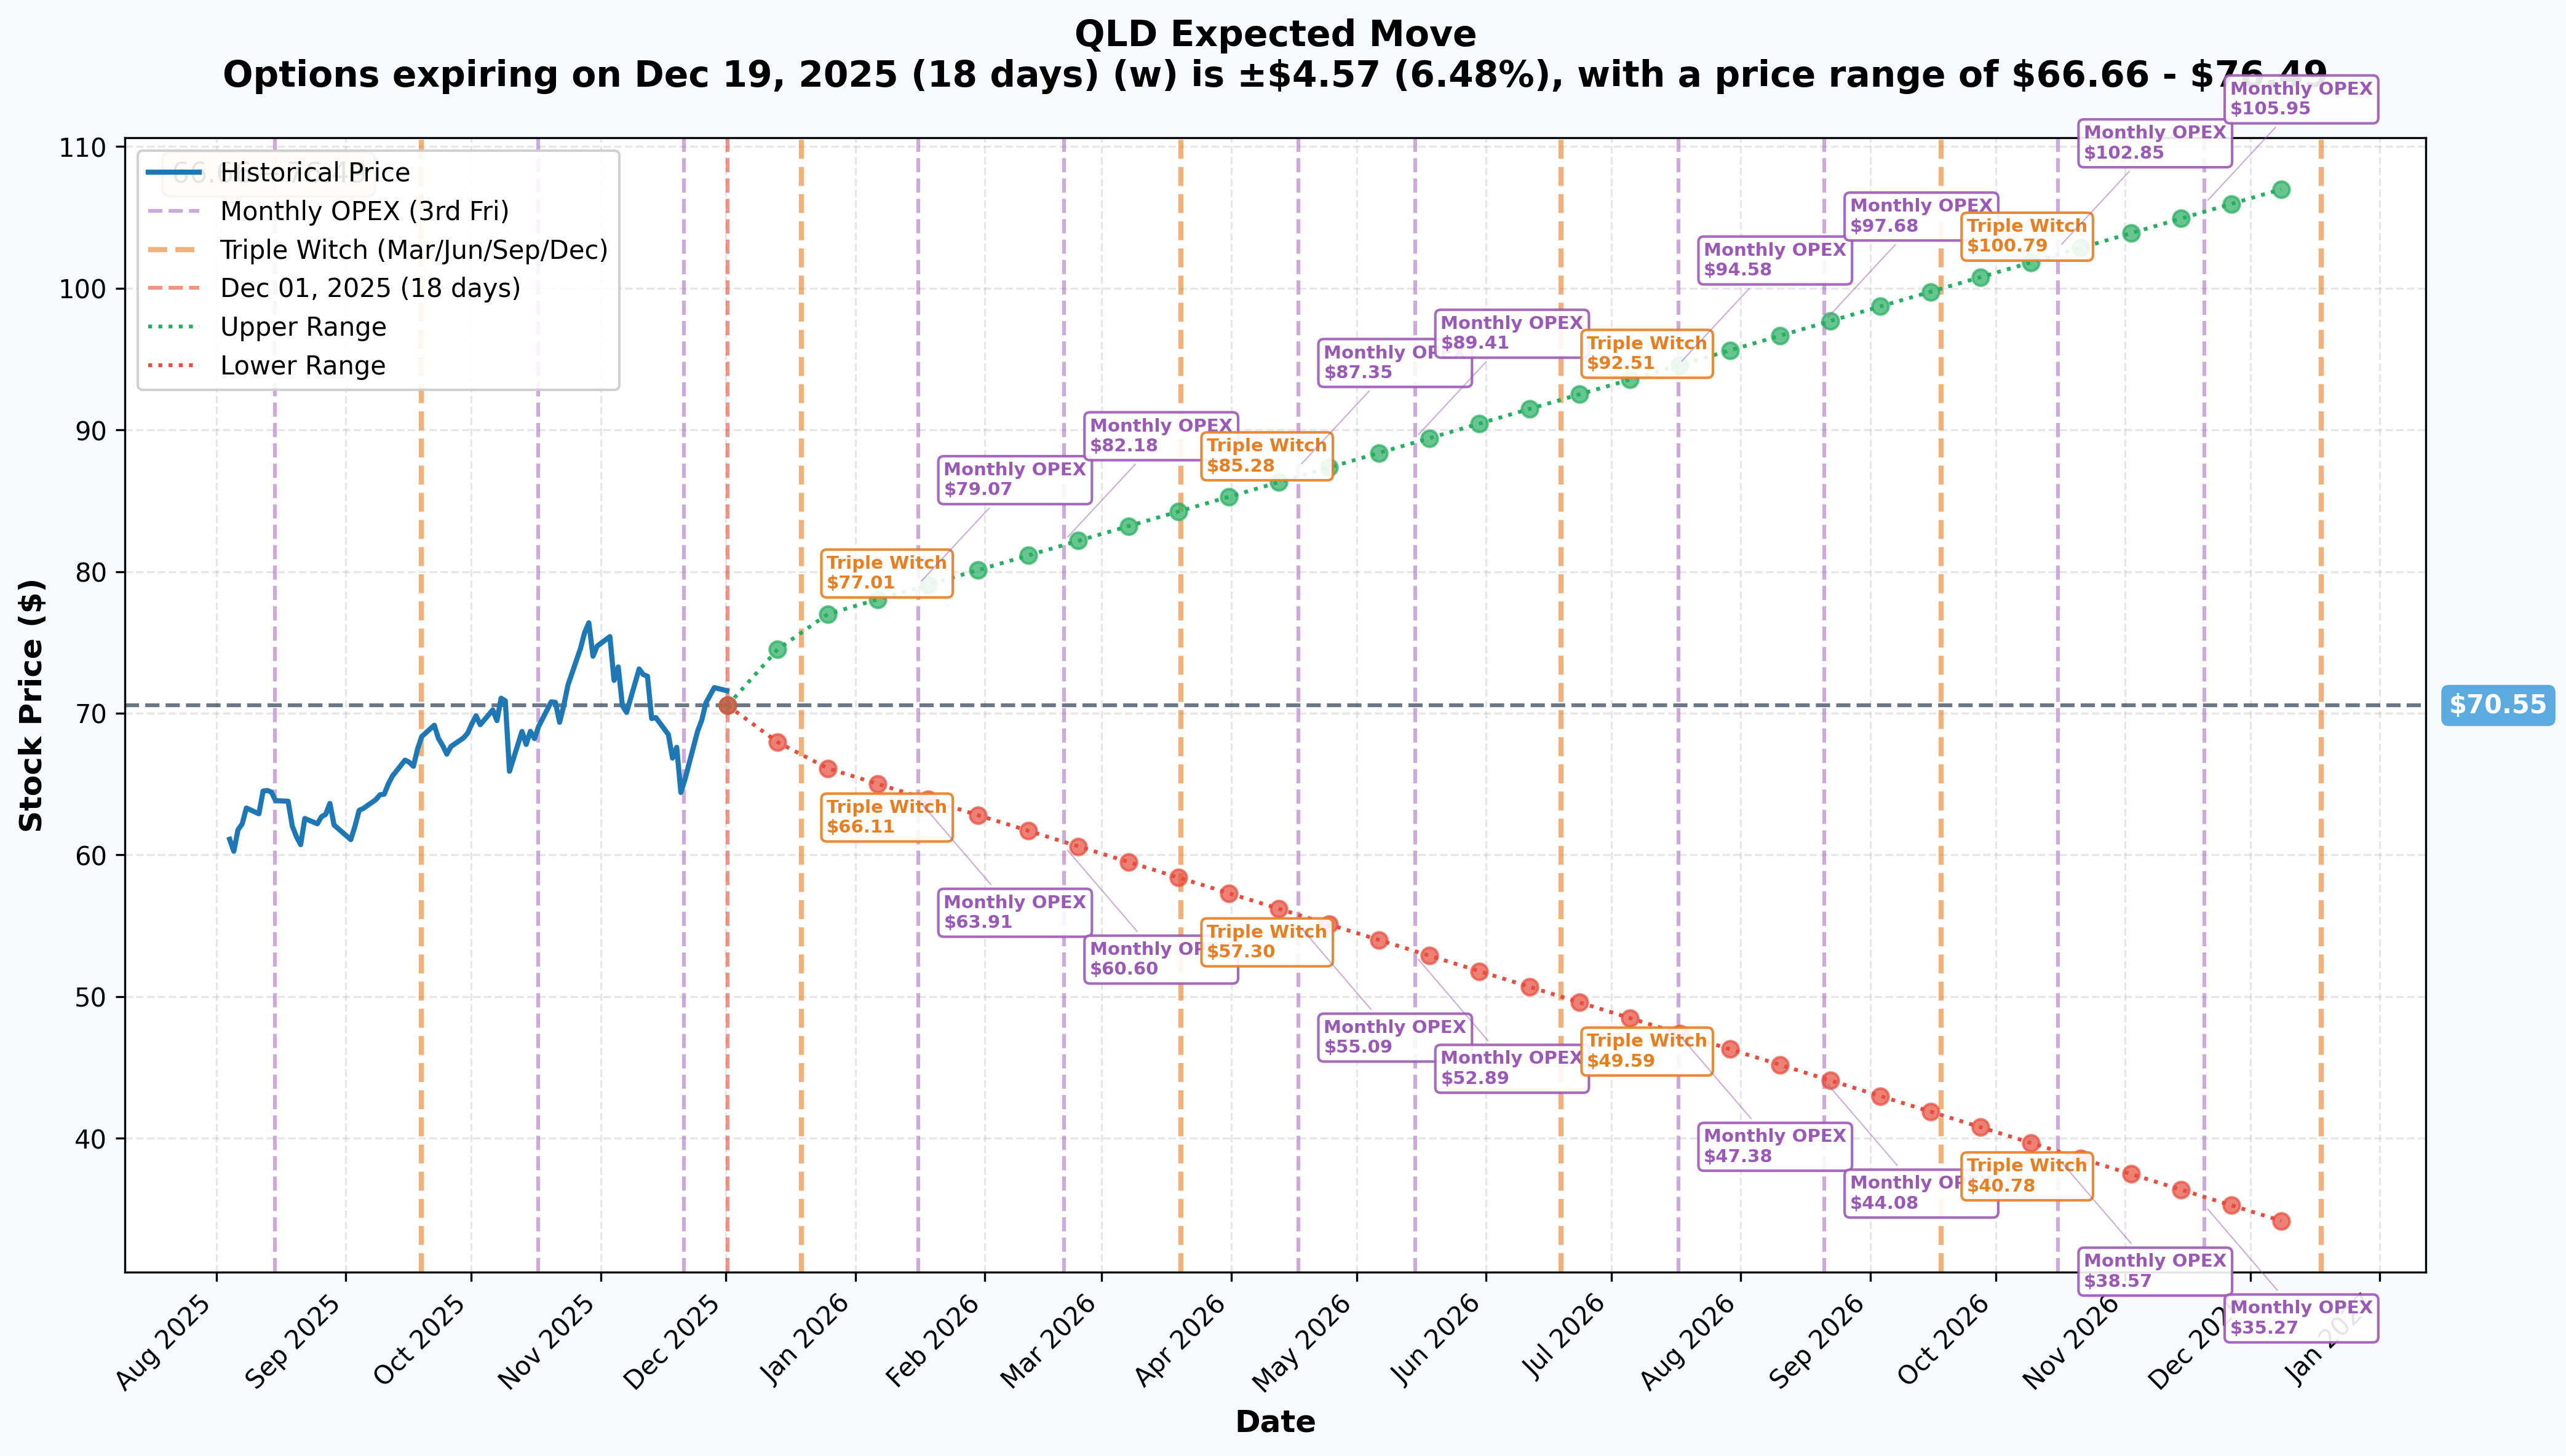
Options market pricing for upcoming expirations:
- 📅 December 19, 2025 (Monthly OPEX - 18 days): ±$4.57 (±6.48%) → Range: $66.66 - $76.49
- 📅 December 19, 2025 (Quarterly Triple Witch): Same as monthly (both expire Dec 19)
- 📅 January 16, 2026 (Monthly OPEX - 46 days): ±$10.73 (±15.22%) → Range: $63.91 - $79.07
- 📅 December 18, 2026 (Yearly LEAPS - 382 days): ±$37.30 (±52.87%) → Range: $33.25 - $107.85 (unreliable for long-term)
Translation for regular folks:
The December 19 expiration (18 days out) has a 6.48% implied move which captures:
- 📅 December 10 FOMC decision (rate cut highly likely)
- 📅 December 12-13 Nasdaq-100 reconstitution announcement
- 📅 Pre-holiday trading dynamics
That $4.57 expected move takes QLD from current $70.55 to either $75.12 (upside) or $65.98 (downside). The market is pricing in SIGNIFICANT volatility around these catalysts!
Key insight: The January 2026 monthly expiration shows a much larger ±15.22% move because it captures Q4 2024 earnings from the Magnificent Seven (Microsoft, Apple, Amazon, Google, Meta, NVIDIA, Tesla). Earnings are expected to show +13.1% growth on +11.9% revenue growth, but at current valuations (Nasdaq-100 P/E of 34.90 vs historical 18.86), even small disappointments could trigger sharp selloffs.
For this LEAPS spread: The January 2028 expiration is so far out that implied volatility estimates become unreliable. The trader is essentially betting that over 783 days, QLD will experience sustained upward drift driven by continued AI growth, Fed rate cuts, and tech sector dominance. They're NOT betting on explosive gains (spread caps at $67.50), just steady-as-she-goes bullishness.
🎪 Catalysts
🔥 Immediate Catalysts (Next 7-14 Days)
1. FOMC Meeting - December 9-10, 2025 🏦
The Federal Reserve announces its interest rate decision on Tuesday, December 10, 2025 at 2:00 PM ET. This is THE most important near-term catalyst for tech stocks and QLD:
Consensus Expectations:
- 📊 81% probability of 25bps rate cut (per CME FedWatch Tool as of late November)
- 🎯 Expected new range: 3.50% to 3.75% (down from current 3.75-4.00%)
- 📈 Market pricing in three additional cuts in 2026
Recent Shift in Expectations:
Just one week ago, investors were at 50/50 on a December cut. Probability jumped to 81% following dovish comments from:
- New York Fed President John Williams
- Fed Governor Chris Waller
- Trump appointee Stephen Miran (advocating for rate cut)
BUT - Fed is Deeply Divided:
October FOMC minutes revealed that "many" members expressed skepticism about additional cuts in 2025. Fed Chair Jerome Powell stated the December cut "isn't a foregone conclusion" and noted "strongly differing views on how to proceed in December."
Complicating factor: The 44-day government shutdown prevented compilation of labor market and inflation data, leaving the Fed flying blind on critical economic indicators!
Impact on QLD:
- ✅ Rate cut = BULLISH: Lower rates reduce discount rates on future tech earnings, historically boosting growth stocks 5-10% in days following cuts
- ❌ Hawkish pause = BEARISH: If Fed surprises with no cut citing sticky inflation, tech could gap down 8-12% as higher-for-longer rates pressure valuations
- 🎢 Volatility guaranteed: Regardless of outcome, expect 3-5% QLD move on December 10-11
For this call spread trade, a rate cut would be ideal - providing near-term upside momentum while not pushing QLD so high it breaches the $67.50 short call strike immediately.
Source: Federal Reserve, Chase, Fortune
2. Nasdaq-100 Annual Reconstitution - December 12-13, 2025 📋
The Nasdaq announces its annual index changes around December 12-13, 2025, with implementation typically the Monday following the third Friday (around December 22-23). This directly impacts QLD since it tracks the Nasdaq-100!
What happens during reconstitution:
- 📊 Nasdaq reviews all 100 constituents based on market cap, liquidity, and sector balance
- 🔄 Adds high-performing stocks, removes underperformers
- ⚖️ Reweights to maintain rules: No single stock >24%, aggregate of stocks >4.5% can't exceed 48%
2024 Changes (for context):
- ✅ Additions: Palantir (PLTR), Axon (AXON), MicroStrategy (MSTR)
- ❌ Removals: Illumina (ILMN), Super Micro Computer (SMCI), Moderna (MRNA)
Impact on QLD:
Because QLD holds 2x leveraged exposure to the Nasdaq-100, reconstitution forces the ETF to:
- Sell removed stocks (2x the index weight)
- Buy added stocks (2x the index weight)
- Rebalance existing positions to match new weights
This creates:
- 📈 Elevated trading volume Dec 22-23 (implementation day)
- 🎢 Potential tracking errors during transition (could be ±1-2% from NAV)
- 💥 Amplified price movements in added/removed stocks (forced buying/selling)
- 🎯 Short-term opportunities for tactical traders to ride momentum
For the LEAPS spread holder, reconstitution is just one of dozens of events over the next 783 days. But it could provide near-term upside if added stocks rally (and QLD captures 2x that move).
🚀 Near-Term Catalysts (Q1 2026)
3. Magnificent Seven Q4 2024/Q1 2025 Earnings - January-February 2026 💰
The top 10 holdings in the Nasdaq-100 (which comprise 53.88% of the index weight) report earnings between late January and mid-February 2026. Since QLD provides 2x leverage to these giants, their results DIRECTLY determine QLD's fate.
Consensus Expectations for Q1 2025:
- 📊 Magnificent Seven: +13.1% earnings growth on +11.9% revenue growth
- 💰 Full year 2025 aggregate Mag 7 earnings: $556.1B (up from $493.7B in 2024)
- 📈 Tech sector overall: +12.4% earnings growth on +10.1% revenue growth
Key Companies to Watch:
NVIDIA (NVDA) - 9.33% of QLD exposure:
- 🤖 Q3 2025 sales rose 62% YoY to $57B, with data center revenue up 66%
- 🏭 Visibility into ~$307B in revenue from Blackwell and Rubin systems over next five quarters
- 🔥 CEO Jensen Huang: "Cloud GPUs are sold out, demand outpacing supply"
- ⚠️ Risk: Potential tariffs on Taiwan-sourced chips could disrupt supply chain
Apple (AAPL) - 8.78% of QLD exposure:
- 💪 Q4 2025 beat: EPS $1.85 vs $1.76 expected, revenue $102.5B vs $101.69B expected
- 📱 Record fiscal year revenue of $416B
- ✅ Services revenue grew 15% YoY (high-margin recurring revenue)
- ⚠️ Risk: Greater China market declined 4% YoY - geopolitical tensions
Microsoft (MSFT) - 7.69% of QLD exposure:
- ☁️ Azure cloud growth and AI services adoption critical
- 💸 CapEx trajectory: $63.6B in FY 2025, projected $71.9B in FY 2026
- 🤖 Office 365/Copilot AI integration metrics watched closely
- 📈 Gaming division performance post-Activision acquisition
Amazon (AMZN) - 5.21% of QLD exposure:
- 🏗️ AWS revenue growth and AI infrastructure investments
- 📦 E-commerce margin expansion potential
- 📺 Advertising revenue trajectory (high-margin business)
- 💰 Part of hyperscaler $200B 2025 AI infrastructure spend
Meta Platforms (META) - 2.77% of QLD exposure:
- 🏆 Only Mag 7 stock in positive territory for 2025 - leading the pack
- 🤖 AI ad targeting monetization driving revenue growth
- 💸 Reality Labs losses and metaverse spend (ongoing concern)
- 📊 User growth across Facebook/Instagram/WhatsApp
Why this matters for the call spread:
If the Magnificent Seven deliver on consensus (or beat), QLD could easily rally 10-15% in January-February, pushing toward or through the $67.50 short call strike. However, at current Nasdaq-100 P/E of 34.90 (vs historical average of 18.86), valuations are stretched. Even meeting consensus might not be enough to drive further gains - the market often sells on "good but not great" news when expectations are sky-high.
The spread structure is PERFECT for this scenario: profits from modest gains ($64-67.50 range) but doesn't get hurt if QLD explodes higher beyond $67.50 (upside is capped anyway).
📊 Medium-Term Catalysts (Q2-Q4 2026)
4. AI Infrastructure Spending Supercycle 🏗️
The AI buildout is THE dominant narrative driving tech valuations through 2026-2028:
- 💰 Hyperscaler AI spending: $200B in 2025 alone across Amazon, Microsoft, Google, Meta
- 📈 Semiconductor industry revenue: $697-800B (11-18% YoY growth)
- 🤖 Gen AI chip market: Expected to exceed $150B in 2025
- 🎯 AI accelerator TAM by 2028: $500B (per AMD CEO Lisa Su)
Taiwan Semiconductor (TSMC) - Critical Supplier:
- 📊 Q2 2025: 39% revenue increase, 61% profit jump
- 🔬 3nm and 5nm chips account for nearly 60% of wafer sales
- 🚀 AI-related revenues tripled in 2024, expected to double again in 2025
- 💸 2025 CapEx: Up to $42B (vs $29.8B in 2024)
- 🏭 CoWoS packaging capacity projected to double to 70,000 wafers/month in 2025
High-Bandwidth Memory (HBM) Shortage:
- 🔥 Micron and SK Hynix experiencing unprecedented HBM demand
- 📈 HBM revenue projected to surge 70% in 2025
- ⏰ SK Hynix HBM output fully booked until at least late 2026
Risk Factors:
- ⚠️ Proposed tariffs on Taiwan-sourced chips could disrupt supply chains
- 🇹🇼 TSMC's geopolitical risk (China-Taiwan tensions)
- 💸 Market skepticism about ROI on massive AI investments (DeepSeek breakthrough raised questions about capital efficiency)
Why this matters: QLD's top holdings (NVIDIA, AMD, Apple, Microsoft, Amazon, Google) are either BUILDING this AI infrastructure or BENEFITING from it. Sustained spending supports revenue growth through 2028, but any slowdown would crater tech valuations.
Source: Fabricated Knowledge, Financial Content
5. Treasury Yields & Fed Rate Path 📉
Current Environment (Late 2025):
- 📊 10-Year Treasury Yield: 4.05% (as of end of October)
- 🎯 Forecast December 2025: ~3.72% (driven by anticipated Fed rate cuts)
- 💰 Fed Funds Rate: 3.75% to 4.00%
Historical Growth Stock Relationship:
Rising yields typically pressure growth stocks because future earnings get discounted at higher rates. High-growth tech stocks like those in the Nasdaq-100 are particularly sensitive since much of their valuation comes from expected earnings 5-10 years out.
However - recent anomaly: Growth stocks have outperformed DESPITE rising rates in 2024-2025, likely due to the AI theme overwhelming traditional valuation metrics. The 20-year correlation between Tech returns and Treasury yield moves is only 0.23 (statistically insignificant).
Key Threshold Levels:
- 💚 Below 3% yields: Favorable for stocks; growth stocks (especially tech) tend to outperform
- ⚖️ 4-5% range (current): Bonds compete more with equities, but AI narrative supports tech
- 💔 Above 5% yields: Historically negative for equity risk premiums and growth stock valuations
Recent Examples of Decoupling:
- July 2012 - January 2014: Yields climbed from 1.39% to 3.00%; Tech rose 34.1%
- July 2016 - November 2018: Tech returned 69.7% despite yields more than doubling
Current Outlook:
Forecasted yield decline toward 3.72% in December 2025 (if Fed cuts materialize) would be BULLISH for QLD. Lower discount rates = higher present value of future tech earnings = multiple expansion.
But if inflation resurges and yields spike instead (say, back toward 5%), that would be a major headwind even for AI-driven tech. At current Nasdaq-100 valuations (34.90x P/E), there's little margin for error.
⚠️ Risk Catalysts (Bearish)
6. Tech Sector Valuation Risk 📊
The Nasdaq-100 is trading at historically stretched valuations that leave little room for disappointment:
Current Metrics (November 2025):
- 📈 S&P 500 Information Technology P/E: 38.02
- 🎯 Nasdaq-100 P/E: 34.90
- 📊 S&P 500 IT Forward P/E: 28.25
- 💰 20-Year Tech Sector Average P/E: 18.86
- 1 Standard Deviation Range: 13.76 - 23.97
- 2 Standard Deviation Range: 8.66 - 29.07
- 📉 Current 38x is 2x the 20-year average!
- ⚠️ Shiller P/E10 (September 2025): 138% above historic geometric average
What this means: Tech sector is priced for PERFECTION. The current P/E of ~38x assumes sustained AI-driven earnings growth of 15-20% annually for years to come. Any hiccup in execution (slower AI adoption, margin compression, recession) would trigger multiple compression back toward 25-30x range, implying 20-30% downside in Nasdaq-100 (and 40-60% in QLD due to 2x leverage!).
Recent Tech Performance (2025 YTD):
- 🏆 Meta Platforms: Only Mag 7 stock in positive territory
- 💔 Tesla: Worst performer, down 40%+ YTD ($780B market cap decline)
- 📉 Alphabet: Down 14%+ YTD, lost 20% from record close
- ⚖️ Amazon, Microsoft, Apple: Mixed performance
The fact that several Magnificent Seven members are DOWN significantly in 2025 despite the AI boom shows that even great companies can underperform when valuations get ahead of fundamentals.
7. China Export Restrictions & Geopolitical Risk 🇨🇳
U.S.-China tensions pose ongoing risk to tech supply chains and revenue:
Recent Examples:
- 📱 Apple: Greater China revenue declining 4% YoY - brand perception and regulatory challenges
- 🤖 NVIDIA/AMD: Export restrictions on AI chips to China (restrictions partially lifted in July 2025 for AMD MI308, but uncertainty remains)
- 🏭 TSMC Dependency: Nearly all advanced chips manufactured in Taiwan - China-Taiwan conflict would be catastrophic
Ongoing Risks:
- ⚠️ Future export controls on cutting-edge AI chips (H200, Blackwell, MI325X, MI350)
- 🇨🇳 Chinese competitors developing domestic alternatives (Huawei, Biren)
- 💸 China historically 15-20% of tech sales - lost revenue hard to replace
- 🌍 Broader trade war escalation impacting supply chains
For QLD holders, geopolitical flare-ups can trigger 5-10% single-day drops even without fundamental damage. The 2x leverage amplifies this volatility.
🎲 Price Targets & Probabilities
Using implied move data, technical levels, and upcoming catalysts, here are scenarios through January 2028 expiration:
📈 Bull Case (30% probability)
Target: $80-95+ (MAX PROFIT for spread at $67.50)
How we get there:
- ✅ Fed delivers December rate cut AND signals 3+ more cuts in 2026
- 🚀 Magnificent Seven earnings CRUSH in Q1 2026 (+15-20% beats across the board)
- 🤖 AI infrastructure spending accelerates beyond $200B - ROI concerns dissipate
- 📈 Nasdaq-100 reconstitution adds momentum names, removes underperformers cleanly
- 💪 Tech sector P/E multiple expands to 40-45x as AI growth validates (vs current 38x)
- 🌍 China tensions ease, export restrictions lifted
- 🏭 No major supply chain disruptions (TSMC, HBM memory)
- 📊 QLD benefits from sustained trending market (2x leverage compounds FAVORABLY)
Path: QLD breaks through $76.67 resistance in December post-FOMC, rallies to $80-85 by Q1 2026 earnings, continues grinding higher through 2026-2027 as AI theme plays out. By January 2028, QLD trades $80-95 range.
Spread P&L in Bull Case:
- Stock at $70+: Max profit of $525,000 (88% ROI)
- Breakeven at $64.00 easily cleared
Why only 30% probability:
- Current valuations already stretched (38x P/E)
- Requires NO negative surprises over 783 days (unrealistic)
- Volatility decay works against QLD in choppy markets (common over 2+ years)
- Multiple compression risk if growth slows
- Geopolitical/macro wildcards
🎯 Base Case (50% probability)
Target: $60-$75 range (CHOPPY CONSOLIDATION with modest gains)
Most likely scenario:
- ⚖️ Fed cuts in December but signals fewer cuts than market expects (2 in 2026 vs 3 priced in)
- 📊 Mag 7 earnings meet consensus but don't blow away - stock-specific winners/losers
- 🤖 AI spending continues but at slightly slower pace - some projects scale back
- 💰 Tech P/E compresses modestly from 38x to 32-35x range (healthy de-rating)
- 🎢 QLD experiences multiple 10-15% corrections over 2+ year period
- 📉 Volatility decay erodes some gains during choppy periods
- ✅ Overall trend remains positive but not parabolic
Path: QLD trades in $60-$75 range for most of 2026-2027, experiencing sharp rallies (on good earnings, Fed cuts) followed by corrections (profit-taking, macro scares, valuation concerns). By January 2028, QLD is somewhere in the $64-72 range.
Spread P&L in Base Case:
- Stock at $64-67.50: Profit of $0 to $525,000 (breakeven to max profit range)
- Stock at $60-$64: Loss of $0 to $600,000 (partial to full loss)
This is the scenario the spread is DESIGNED for: modest bullish drift with volatility along the way. The trader doesn't need QLD to explode - just needs it to avoid a catastrophic breakdown below $60 and ideally finish above $64.
Why 50% probability:
- Most realistic given long time horizon
- Accounts for normal market volatility and corrections
- Doesn't require perfection but also doesn't assume disaster
- Leveraged ETFs tend to underperform unleveraged counterparts over multi-year periods due to decay
- Tech leadership likely continues but at more moderate pace
📉 Bear Case (20% probability)
Target: <$60 (TOTAL LOSS for spread)
What could go wrong:
- 😰 Fed pauses in December (no rate cut) and signals higher-for-longer - tech gaps down 10-15%
- 💔 Mag 7 earnings disappoint in Q1 2026 - guidance cuts, margin compression
- 📉 Recession in 2026-2027 cuts enterprise IT budgets - data center spending craters
- 🤖 AI spending hits wall - DeepSeek-style breakthroughs show diminishing returns to scale
- 🇨🇳 Major China-Taiwan crisis disrupts TSMC supply - chip shortage
- 💸 Tech P/E collapses from 38x to 20-25x range (back to historical norms)
- 🎢 QLD suffers severe volatility decay during prolonged bear market
- 📊 Nasdaq-100 drops 30-40% over 2026-2027 → QLD drops 60-80% due to leverage
Path: December FOMC disappoints, QLD drops to $65-68 range. Q1 earnings underwhelm, QLD breaks below $60 support in February 2026. Bear market ensues through 2026-2027 as recession hits and AI theme unravels. By January 2028, QLD trades in $40-55 range.
Spread P&L in Bear Case:
- Stock below $60: Total loss of $600,000 (both call legs expire worthless)
Why only 20% probability:
- Requires multiple systemic failures (recession + AI bust + geopolitical crisis)
- Fed remains accommodative - unlikely to tighten aggressively
- Tech fundamentals remain strong (AI adoption is real, not a fad)
- QLD has $60 support level (the sold call strike) - if it gets there, implied volatility spikes and trader could potentially roll position
- Two-year timeframe allows for recovery even after sharp drawdowns
Critical support levels to watch:
- 🛡️ $70.00 - Psychological support, recent consolidation
- 🛡️ $66-68 - Gap fill area from November rally
- 🛡️ $60.00 - MAJOR FLOOR (sold call strike) - MUST hold or spread in trouble!
- 🛡️ $55-57 - Extended support if $60 breaks (bear market territory)
💡 Trading Ideas
🛡️ Conservative: Stay Away (This is NOT a Conservative Product!)
Recommendation: DO NOT trade QLD or QLD options unless you're an experienced trader
Why this is important:
- ⚠️ QLD is a leveraged product designed for SHORT-TERM tactical use (days, not years)
- 📉 Volatility decay erodes value in choppy markets - you can be RIGHT on direction and still lose money
- 🎢 2x leverage means 10% Nasdaq-100 correction = 20% QLD crash (and it can happen overnight)
- 💸 0.95% expense ratio is 5x higher than unleveraged QQQ (0.20%)
- ⚠️ Options on leveraged ETFs have wider bid-ask spreads and less liquidity
If you MUST get tech exposure:
- ✅ Buy unleveraged QQQ (Invesco Nasdaq-100 ETF) for long-term holds
- ✅ Buy shares in individual Magnificent Seven stocks (NVDA, AAPL, MSFT, AMZN, etc.)
- ✅ Use QLD only for 1-5 day tactical trades around known catalysts (FOMC, earnings)
- ✅ NEVER allocate more than 5% of portfolio to leveraged ETFs
Risk level: Extreme (for QLD itself) | Skill level: Advanced required
Expected outcome: Avoid the "death by a thousand cuts" that most retail traders experience with leveraged ETFs over time.
⚖️ Balanced: Post-FOMC Tactical Long (Copy The Smart Money Framework)
Play: IF Fed cuts on December 10, buy QLD shares or short-dated calls for 2-week swing trade
Structure:
- Option 1: Buy QLD shares at $71-73 after Fed announcement, target $76-78, stop at $68
- Option 2: Buy January 2026 $72.50 calls if Fed cuts (benefiting from IV crush post-event)
Why this works:
- 🎯 Rate cuts historically boost tech/growth stocks 5-10% in following 2 weeks
- 📊 QLD sitting just below all-time high of $76.67 - breakout imminent if Fed delivers
- 🚀 Nasdaq-100 reconstitution on Dec 12-13 provides follow-through catalyst
- ⏰ Short timeframe (2 weeks) minimizes volatility decay risk
- 📈 2x leverage amplifies gains: 5% Nasdaq-100 rally = 10% QLD rally
Entry criteria (MUST meet ALL of these):
- ✅ Fed announces 25bps rate cut on December 10
- ✅ Fed Chair Powell uses dovish language in press conference (hints at more cuts)
- ✅ QLD holds above $70 support intraday (no breakdown)
- ✅ Enter within 30 minutes of FOMC announcement (don't chase if it gaps too far)
Position sizing:
- 💰 Risk only 3-5% of portfolio (this is TACTICAL speculation)
- 🎯 Use tight stops (5-7% below entry) to limit downside
Trade management:
- 📈 Take 50% profits at $76 (first resistance / ATH)
- 🎯 Move stop to breakeven after capturing 5% gain
- 🚪 Exit ALL remaining by December 20 (before holiday illiquidity)
- ⏰ If Fed doesn't cut or uses hawkish language, SKIP this trade entirely
Estimated P&L (for stock position):
- 💰 Entry: $72.00
- 📈 Target 1: $76.00 (+5.5% = 11% with 2x leverage assumed)
- 🎯 Target 2: $78.00 (+8.3%)
- 🛡️ Stop: $68.00 (-5.5%)
- 📊 Risk/Reward: 1:1.5 to 1:2
For call option approach (more aggressive):
- Buy Jan 2026 $72.50 calls at ~$4-5 after Fed announcement
- Max loss: Premium paid ($400-500 per contract)
- Target: $7-9 per contract (40-80% gain)
Risk level: Moderate (short timeframe, defined exit plan) | Skill level: Intermediate
🚀 Aggressive: Replicate The LEAPS Spread (For Deep-Pocketed Traders)
Play: Copy the institutional trade - sell QLD January 2028 call spread
Structure: Sell $60/$67.50 call spread (SAME as the unusual activity trade)
- Sell 1 QLD Jan 2028 $60 call at ~$24.67 (collect premium)
- Buy 1 QLD Jan 2028 $67.50 call at ~$20.67 (protect upside)
- Net credit: ~$4.00 per spread × contracts
Wait... this is a CREDIT spread, not debit?
Actually, the original trade was a DEBIT spread (paid $4.00 net). But aggressive traders could consider selling PUT spreads instead to mirror the bullish thesis while collecting premium. Let me provide both:
Option A: Replicate Exact Trade (Debit Call Spread) - BULLISH
- Pay $4.00 net per spread ($400 per 1-lot, $40,000 per 100-lot)
- Max profit: $3.50 per spread if QLD above $67.50 at Jan 2028 expiration (88% ROI)
- Max loss: $4.00 per spread if QLD below $60 (100% loss)
- Breakeven: $64.00
Option B: Sell Put Spread Instead (Credit) - ALSO BULLISH
- Sell $65 put / Buy $60 put (Jan 2028)
- Collect ~$2.00 credit per spread (example pricing)
- Max profit: $2.00 credit if QLD above $65 at expiration
- Max loss: $3.00 if QLD below $60 (risk of $300 per spread)
- Breakeven: $63.00
Why this could work:
- 🎯 2+ year timeframe allows for multiple Fed rate cuts, AI growth thesis to play out
- 📊 Defined risk ($400-600 per spread) vs buying 100 shares for $7,181
- 🛡️ Conservative strikes: Only need QLD above $64 to profit (11% downside cushion)
- ⏰ Plenty of time to adjust if thesis changes (could roll strikes/expiration)
- 💰 Capital efficient: Tie up less money than stock purchase
Why this could blow up (SERIOUS RISKS):
- ⚠️ Volatility decay over 2+ years: QLD could end LOWER than today even if Nasdaq-100 is flat/slightly up
- 💸 Opportunity cost: $40,000+ tied up for 783 days at low ROI (88% over 2+ years = ~30% annualized)
- 🎢 Black swan events: Recession, China war, financial crisis → QLD crashes to $30-40 range
- 📉 Leverage works both ways: 20% Nasdaq-100 correction = 40% QLD drop = below $60 support
- 🤔 Liquidity risk: LEAPS on QLD have wide bid-ask spreads - hard to exit if needed
- ⏰ Time decay: Theta burn accelerates in final 6 months - could lose value even if directionally correct
CRITICAL WARNING - DO NOT attempt unless you:
- ✅ Have $50,000+ liquid trading capital (this should be <10% of portfolio)
- ✅ Understand leveraged ETF mechanics and volatility decay
- ✅ Can afford to lose entire premium (real possibility over 2+ years)
- ✅ Have traded LEAPS spreads before and understand time decay
- ✅ Are comfortable holding for 700+ days without panic selling
- ✅ Accept that even if tech does well, QLD could underperform due to decay
- ⏰ Plan to monitor quarterly and adjust if thesis breaks (Fed reverses course, AI bust, etc.)
Position sizing: Risk NO MORE than 5-10% of portfolio on this single trade
Trade management:
- 📊 Monitor quarterly after Mag 7 earnings
- 🛡️ If QLD breaks below $60, consider rolling down strikes or closing at loss
- 📈 If QLD above $70 in late 2027, consider closing early and banking profits
- 🎯 Adjust if Fed policy shifts dramatically (no more cuts = close trade)
Risk level: EXTREME (long time horizon, leverage, decay) | Skill level: Advanced only
Probability of profit: ~45-50% (base case gets you to breakeven/modest profit, bull case is max profit, bear case is total loss)
⚠️ Risk Factors
Don't get caught by these potential landmines:
-
⏰ FOMC binary event in 9 days: Results December 10 at 2 PM ET create MASSIVE volatility risk. Fed is deeply divided with "many" members skeptical of December cut despite 81% market probability. If Fed surprises hawkish (no cut), QLD could gap down 8-12% overnight. If Fed cuts but signals fewer 2026 cuts than expected, tech could still sell off 5-7%. The 2x leverage amplifies BOTH scenarios.
-
💸 Volatility decay is GUARANTEED over 2+ years: This is the silent killer of leveraged ETF returns. Even if the Nasdaq-100 is FLAT from now through January 2028, QLD will likely be DOWN 10-20% due to daily rebalancing and compounding effects. Historical research shows that volatility drag compounds exponentially over time. The spread trader is betting on sustained trending market (where decay is minimized) - choppy markets will destroy this position.
-
🇨🇳 China-Taiwan geopolitical wildcard: Nearly ALL advanced semiconductors manufactured by TSMC in Taiwan. A China-Taiwan military conflict (even just blockade threats) would crater tech stocks 30-50% overnight. QLD would fall 60-100% in such a scenario. TSMC supplies chips to NVIDIA, Apple, AMD, etc. - there is NO substitute. This tail risk is non-zero.
-
⚖️ Valuation at nosebleed levels with zero margin of safety: Nasdaq-100 P/E of 34.90 is 85% above the 20-year average of 18.86. Tech sector P/E of 38.02 is literally 2x historical norms. This requires PERFECT execution of AI growth thesis through 2028. Any stumble (slower AI adoption, margin compression, recession, competition) triggers multiple compression. A reversion to 25-30x P/E would mean 20-30% Nasdaq-100 correction → 40-60% QLD crash due to leverage. Current valuation bakes in best-case scenario with no room for error.
-
💔 Magnificent Seven concentration risk: The top 10 holdings comprise 53.88% of Nasdaq-100, and QLD provides 2x leverage to them. Tesla is already down 40%+ YTD, Alphabet down 14%+ despite overall tech strength. If 2-3 of the Mag 7 stumble simultaneously (Apple China problems worsen, Microsoft Azure growth slows, Amazon e-commerce margins compress), the index suffers and QLD gets CRUSHED. Not diversified - this is a concentrated bet on 7-10 mega-cap stocks.
-
🤖 AI spending could hit wall faster than expected: Market pricing in $200B in 2025 hyperscaler spending, but what if ROI doesn't materialize? DeepSeek breakthrough showed that comparable AI performance can be achieved with 1/10th the compute. If enterprises realize they're overspending, CapEx budgets get slashed 30-50% overnight → data center stocks (NVDA, AMD, MSFT, GOOGL, AMZN) all crater → QLD follows. This is 2000 dot-com risk playing out again.
-
📉 Recession in 2026-2027 would be catastrophic: At current valuations, tech has ZERO recession protection. If economy contracts in 2026-2027 due to Fed policy mistake, geopolitical shock, or credit crunch, enterprise IT budgets get cut FIRST. Data center spending is highly cyclical. Even with strong fundamentals, stocks de-rate to 15-20x P/E during recessions. Nasdaq-100 could drop 40-50% → QLD drops 80-100% due to leverage. The January 2028 LEAPS spread would be a total loss.
-
🎢 Near all-time highs with limited upside, asymmetric downside: QLD at $71.81 is just 6.8% below ATH of $76.67. The spread caps upside at $67.50 anyway (already in-the-money!). So best case is QLD stays flat to slightly down and theta decay works in seller's favor. Worst case is QLD crashes below $60 and entire $600K+ premium is lost. Risk/reward on selling this spread is actually UNFAVORABLE at current prices - should have been established 6-12 months ago when QLD was $50-55.
-
🚨 Liquidity risk in QLD LEAPS: Most QLD options volume is in weekly/monthly expirations for tactical trades. LEAPS (2+ years out) have MUCH wider bid-ask spreads and lower open interest. If trader needs to exit this position early (margin call, thesis breaks, personal emergency), they could lose 10-20% just crossing the spread. Unlike SPY or QQQ options which are liquid even in LEAPS, QLD LEAPS are thinly traded.
-
⏰ Government data blackout complicates Fed decision: The 44-day government shutdown prevented collection of critical labor market and inflation data. Fed is flying blind - October PPI, CPI, and PCE data unavailable. This increases probability of policy mistake (cutting when they shouldn't, or not cutting when they should). Markets HATE uncertainty → volatility spikes → QLD decay accelerates.
-
💰 Expensive 0.95% expense ratio compounds over 2+ years: QLD charges 0.95% annually vs 0.20% for QQQ - a 0.75% annual drag. Over 783 days (2.14 years), that's ~1.6% total underperformance just from fees. On a $7,200 QLD investment (100 shares), that's $115 in extra fees. For the LEAPS spread trader, this is embedded in the ETF's performance, but it matters - QLD MUST outperform QQQ by 0.75% annually just to break even on fees.
🎯 The Bottom Line
Real talk: Someone just committed $600,000 to a 2+ year bullish bet on leveraged tech exposure through January 2028. This isn't a short-term gamble - this is a strategic LEAPS position structured to profit from sustained AI-driven growth in the Nasdaq-100 while capping risk through a defined spread.
What this trade tells us:
- 🎯 Sophisticated player expects tech leadership to continue through 2026-2028 (but not explosive gains - spread caps at $67.50)
- 💰 They're willing to risk $600K to make $525K (88% ROI over 2+ years = ~30% annualized)
- ⚖️ The timing (days before FOMC and Nasdaq reconstitution) suggests they want to capture near-term catalysts while holding long-term
- 📊 Strikes at $60/$67.50 suggest target range of $64-75 for QLD through Jan 2028 (base case of modest consolidation with upward drift)
- ⏰ January 2028 expiration captures 8-9 quarters of earnings, multiple Fed decisions, AI product launches, and full economic cycle
This is NOT a "buy QLD and forget" signal - it's a sophisticated options strategy that most retail traders shouldn't attempt.
If you own QLD shares:
- ✅ This is NOT a long-term hold! Volatility decay will kill you over months/years
- ⏰ Use QLD only for 1-5 day tactical trades around catalysts (FOMC, earnings, breakouts)
- 🎯 If holding for swing trades, set tight stops (5-7% max loss) and take profits quickly
- 🛡️ Consider moving to unleveraged QQQ for any position held >1 week
If you're watching from sidelines:
- ⏰ December 10 FOMC decision is the next big moment - wait for that clarity before positioning
- 🎯 IF Fed cuts and QLD breaks above $76.67 ATH, could be tactical long opportunity for 1-2 week swing to $78-80
- 📈 Longer-term (2026-2028), tech leadership likely continues IF AI spending sustains, Fed cuts materialize, and recession is avoided
- ⚠️ Current valuation (Nasdaq-100 at 34.90x P/E) leaves zero margin for error - one stumble and it's -20-30% correction
If you're considering replicating this LEAPS spread:
- 🚫 DON'T do this unless you have $50,000+ trading capital and this represents <10% of portfolio
- ⚠️ Understand that volatility decay over 2+ years is GUARANTEED to erode value
- 💸 Be prepared to lose entire $600K+ premium if recession hits or AI theme unravels
- ⏰ Only enter this trade if you believe in sustained AI supercycle through 2028 with multiple Fed cuts
- 🤔 Consider whether $600K risk for $525K gain (88% over 2+ years) is worth opportunity cost vs safer alternatives
Mark your calendar - Key dates:
- 📅 December 10, 2025 (Tuesday) 2:00 PM ET - FOMC rate decision (9 DAYS!)
- 📅 December 12-13, 2025 - Nasdaq-100 reconstitution announcement
- 📅 December 19, 2025 - Monthly/Quarterly OPEX (±6.48% implied move window)
- 📅 December 22-23, 2025 - Nasdaq-100 reconstitution implementation
- 📅 January-February 2026 - Magnificent Seven Q4 2024/Q1 2025 earnings
- 📅 Mid-2025 (May-June) - AMD MI350 launch, other AI product announcements
- 📅 H2 2026 - OpenAI/AMD first AI deployments begin
- 📅 January 16, 2028 - LEAPS spread expiration (783 days!)
Final verdict: The AI-driven tech rally is REAL - NVIDIA's $307B revenue pipeline, $200B hyperscaler spending, Fed rate cuts, and Magnificent Seven earnings growth all support continued tech leadership through 2026-2028. BUT at Nasdaq-100 P/E of 34.90 (85% above historical average) with QLD near all-time highs after 23.7% YTD gain, the risk/reward for NEW long positions is poor.
The LEAPS call spread structure is intelligent: It limits downside risk ($600K max loss vs $1.5M+ if buying stock), caps upside at realistic targets ($67.50), and gives 2+ years for thesis to play out. But it's NOT suitable for most retail traders.
For the average investor: Stick with unleveraged QQQ for tech exposure, use QLD only for 1-3 day tactical trades with tight stops, and wait for better entry points (10-15% corrections) before committing serious capital. The December 10 FOMC decision will provide the next inflection point.
This is a marathon, not a sprint. Leverage amplifies BOTH gains and losses. Don't get greedy. 💪
Disclaimer: Options trading involves substantial risk of loss and is not suitable for all investors. Leveraged ETFs like QLD are designed for SHORT-TERM tactical use and experience volatility decay over time. This analysis is for educational purposes only and not financial advice. Past performance doesn't guarantee future results. The unusual activity reflects ONE trader's position with unknown portfolio context - they may be hedging other positions or have complex strategies not applicable to retail traders. Always do your own research and consider consulting a licensed financial advisor before trading. LEAPS spreads over 2+ years carry extreme time decay and opportunity cost risks. The probability estimates (30% bull / 50% base / 20% bear) are subjective opinions, not guaranteed outcomes.
About ProShares Ultra QQQ (QLD): ProShares Ultra QQQ seeks daily investment results that correspond to two times (2x) the daily performance of the Nasdaq-100 Index. The fund uses derivatives (swaps, futures) to achieve leveraged exposure and is designed for tactical traders, NOT long-term investors. Market cap: $10.63 billion. Expense ratio: 0.95%. WARNING: Not suitable for buy-and-hold due to volatility decay from daily rebalancing.