🛡️ QQQ $7.9M Put Spread Roll - Institutional Portfolio Hedge Ahead of Mega-Cap Earnings Gauntlet!
📅 February 3, 2026 | 🔥 EXTREMELY UNUSUAL Activity Detected
🎯 The Quick Take
Someone just paid $3.9M net to ROLL their QQQ put protection DOWN from $600 to $570 - that's a major institutional player adjusting their hedge right before AMD, Google, and Amazon all report this week! With a combined Z-Score over 21 on these trades (meaning this kind of activity happens maybe once or twice a YEAR), we're watching serious portfolio insurance get repositioned. The message? They're not panicking, but they're definitely not taking their eyes off the downside.
💼 Company Overview
Invesco QQQ Trust (QQQ) is one of the most liquid ETFs on the planet, tracking the Nasdaq-100 Index - the 100 largest non-financial companies listed on NASDAQ. Think of it as the "Magnificent Seven" express:
- 📈 Holdings: Apple, Microsoft, Nvidia, Google, Amazon, Meta, Tesla dominate
- 💰 Total Nasdaq-100 Market Cap: $33.97 trillion
- 🏦 Primary Exchange: NASDAQ
- 💵 Current Price: $612.90
- 📊 Forward P/E: ~22x (vs. 17x 30-year average - elevated but not extreme)
QQQ is the go-to instrument for institutional traders who want exposure to - or protection against - Big Tech. When whales need to hedge a $100M+ tech portfolio, QQQ options are where they do it.
💰 The Option Flow Breakdown
📋 The Tape
| Time | Direction | Type | Expiration | Strike | Volume | Premium | Order Type | Z-Score |
|---|---|---|---|---|---|---|---|---|
| 13:20:12 | BUY | PUT | 2026-02-20 | $600 | 41,000 | $5.9M | BTC | 7.93 |
| 13:20:12 | SELL | PUT | 2026-02-20 | $570 | 15,000 | $2.0M | STO | 13.92 |
Net Premium: $3.9M debit (paid to roll) Vol/OI Ratio: 8.9x on the $600 puts (massive relative to open interest)
🤓 What This Actually Means - The ROLL Explained
Real talk - this is NOT a new bearish bet. Let me break down what's happening here:
The Setup:
- 1️⃣ Someone was SHORT the Feb-20 $600 puts (they sold puts earlier, collecting premium)
- 2️⃣ Today they BUY TO CLOSE (BTC) those $600 puts for $5.9M - exiting the position
- 3️⃣ Simultaneously, they SELL TO OPEN (STO) new $570 puts for $2.0M
Translation for us regular folks:
This institution is rolling their put exposure DOWN by $30. Why would they do this?
- ✅ Taking profit on the $600 puts they sold (stock is trading higher, those puts lost value)
- ✅ Re-establishing downside exposure at a lower strike as the market rallied
- ✅ Collecting fresh premium while maintaining portfolio hedge structure
- ✅ Adjusting their hedge ratio ahead of massive earnings risk this week
The Key Insight: They're not running for the exits - they're methodically managing a large hedged position. The $600 strike was getting too close to the money ($612.90 current price), so they rolled down to give themselves more breathing room while keeping downside protection in place.
Definitely not your neighbor Bob trading - the Z-Score of 13.92 on the $570 leg means this volume is roughly 14 standard deviations above normal. You see activity like this maybe 2-3 times per year on QQQ.
📈 Technical Setup
YTD Chart
QQQ has been grinding higher in 2026, recovering from the late-January DeepSeek scare. The index found support near $600 and has since rallied back toward the $615 resistance zone.
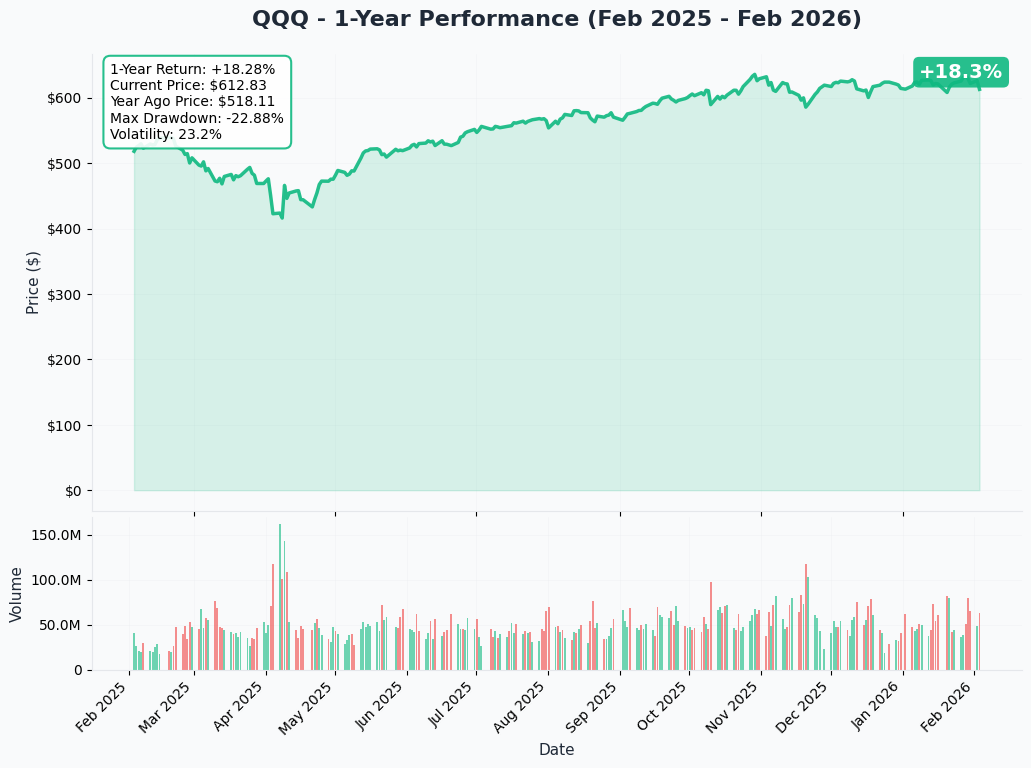
Key observations from the YTD action:
- ✅ Strong recovery from the January 27 DeepSeek selloff
- ✅ $600 held as major psychological support
- ⚠️ Approaching overhead resistance at $620-$625 zone
- 📈 Higher lows forming since late January
📊 Gamma-Based Support & Resistance Analysis
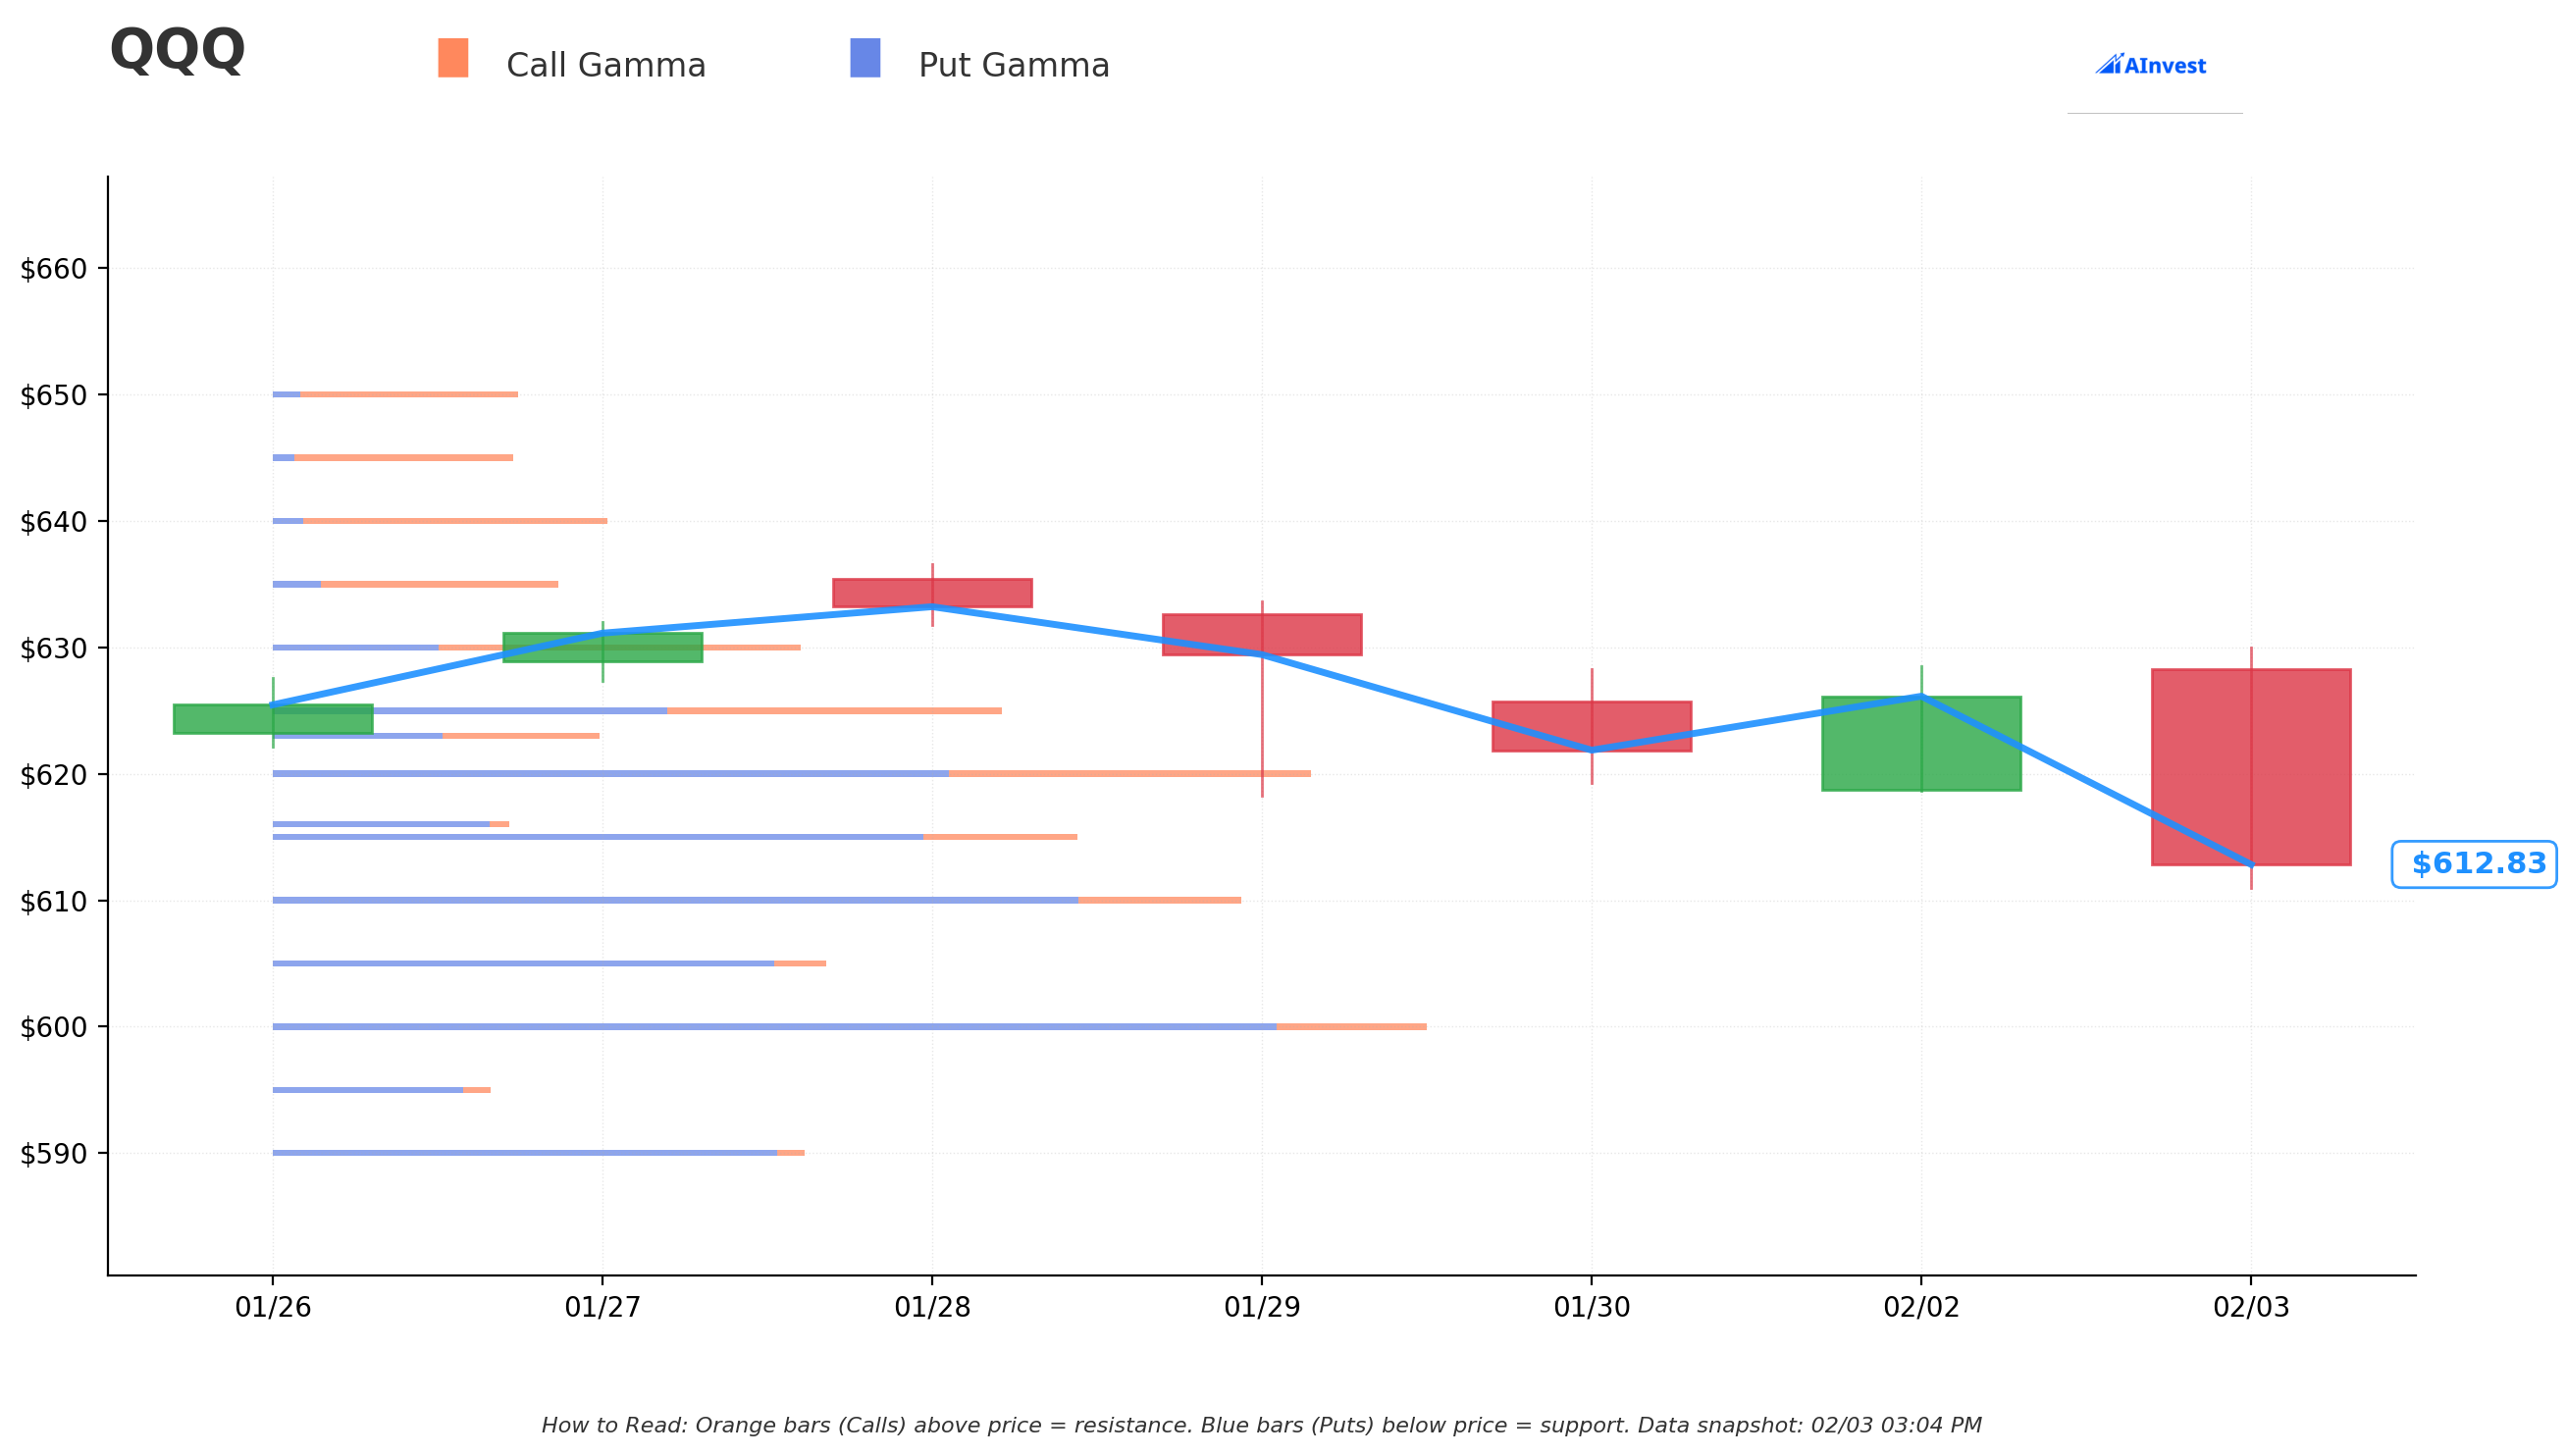
What You're Seeing:
- 🔵 Blue bars (Put Gamma) = Support levels where market makers will BUY to hedge
- 🟠 Orange bars (Call Gamma) = Resistance levels where market makers will SELL to hedge
The Monster Levels:
| Level | Gamma (B$) | Distance | Strength | Role |
|---|---|---|---|---|
| $600 | 218.4B | 2.1% | 💪 VERY STRONG | Major Support Wall |
| $620 | 198.6B | 1.2% | 💪 VERY STRONG | Major Resistance |
| $610 | 182.9B | 0.5% | Strong | Support |
| $615 | 153.0B | 0.3% | Strong | Near-term Resistance |
| $625 | 144.0B | 2.0% | Strong | Upside Target |
💡 Why $600 Matters So Much:
The $600 strike has 218.4 BILLION dollars of gamma exposure - that's the single largest gamma wall on the entire QQQ options chain! When price approaches $600, market makers will aggressively BUY to hedge, creating natural support. This is exactly where our institutional trader rolled their puts FROM - they know this level is a fortress.
🔮 Implied Move Analysis
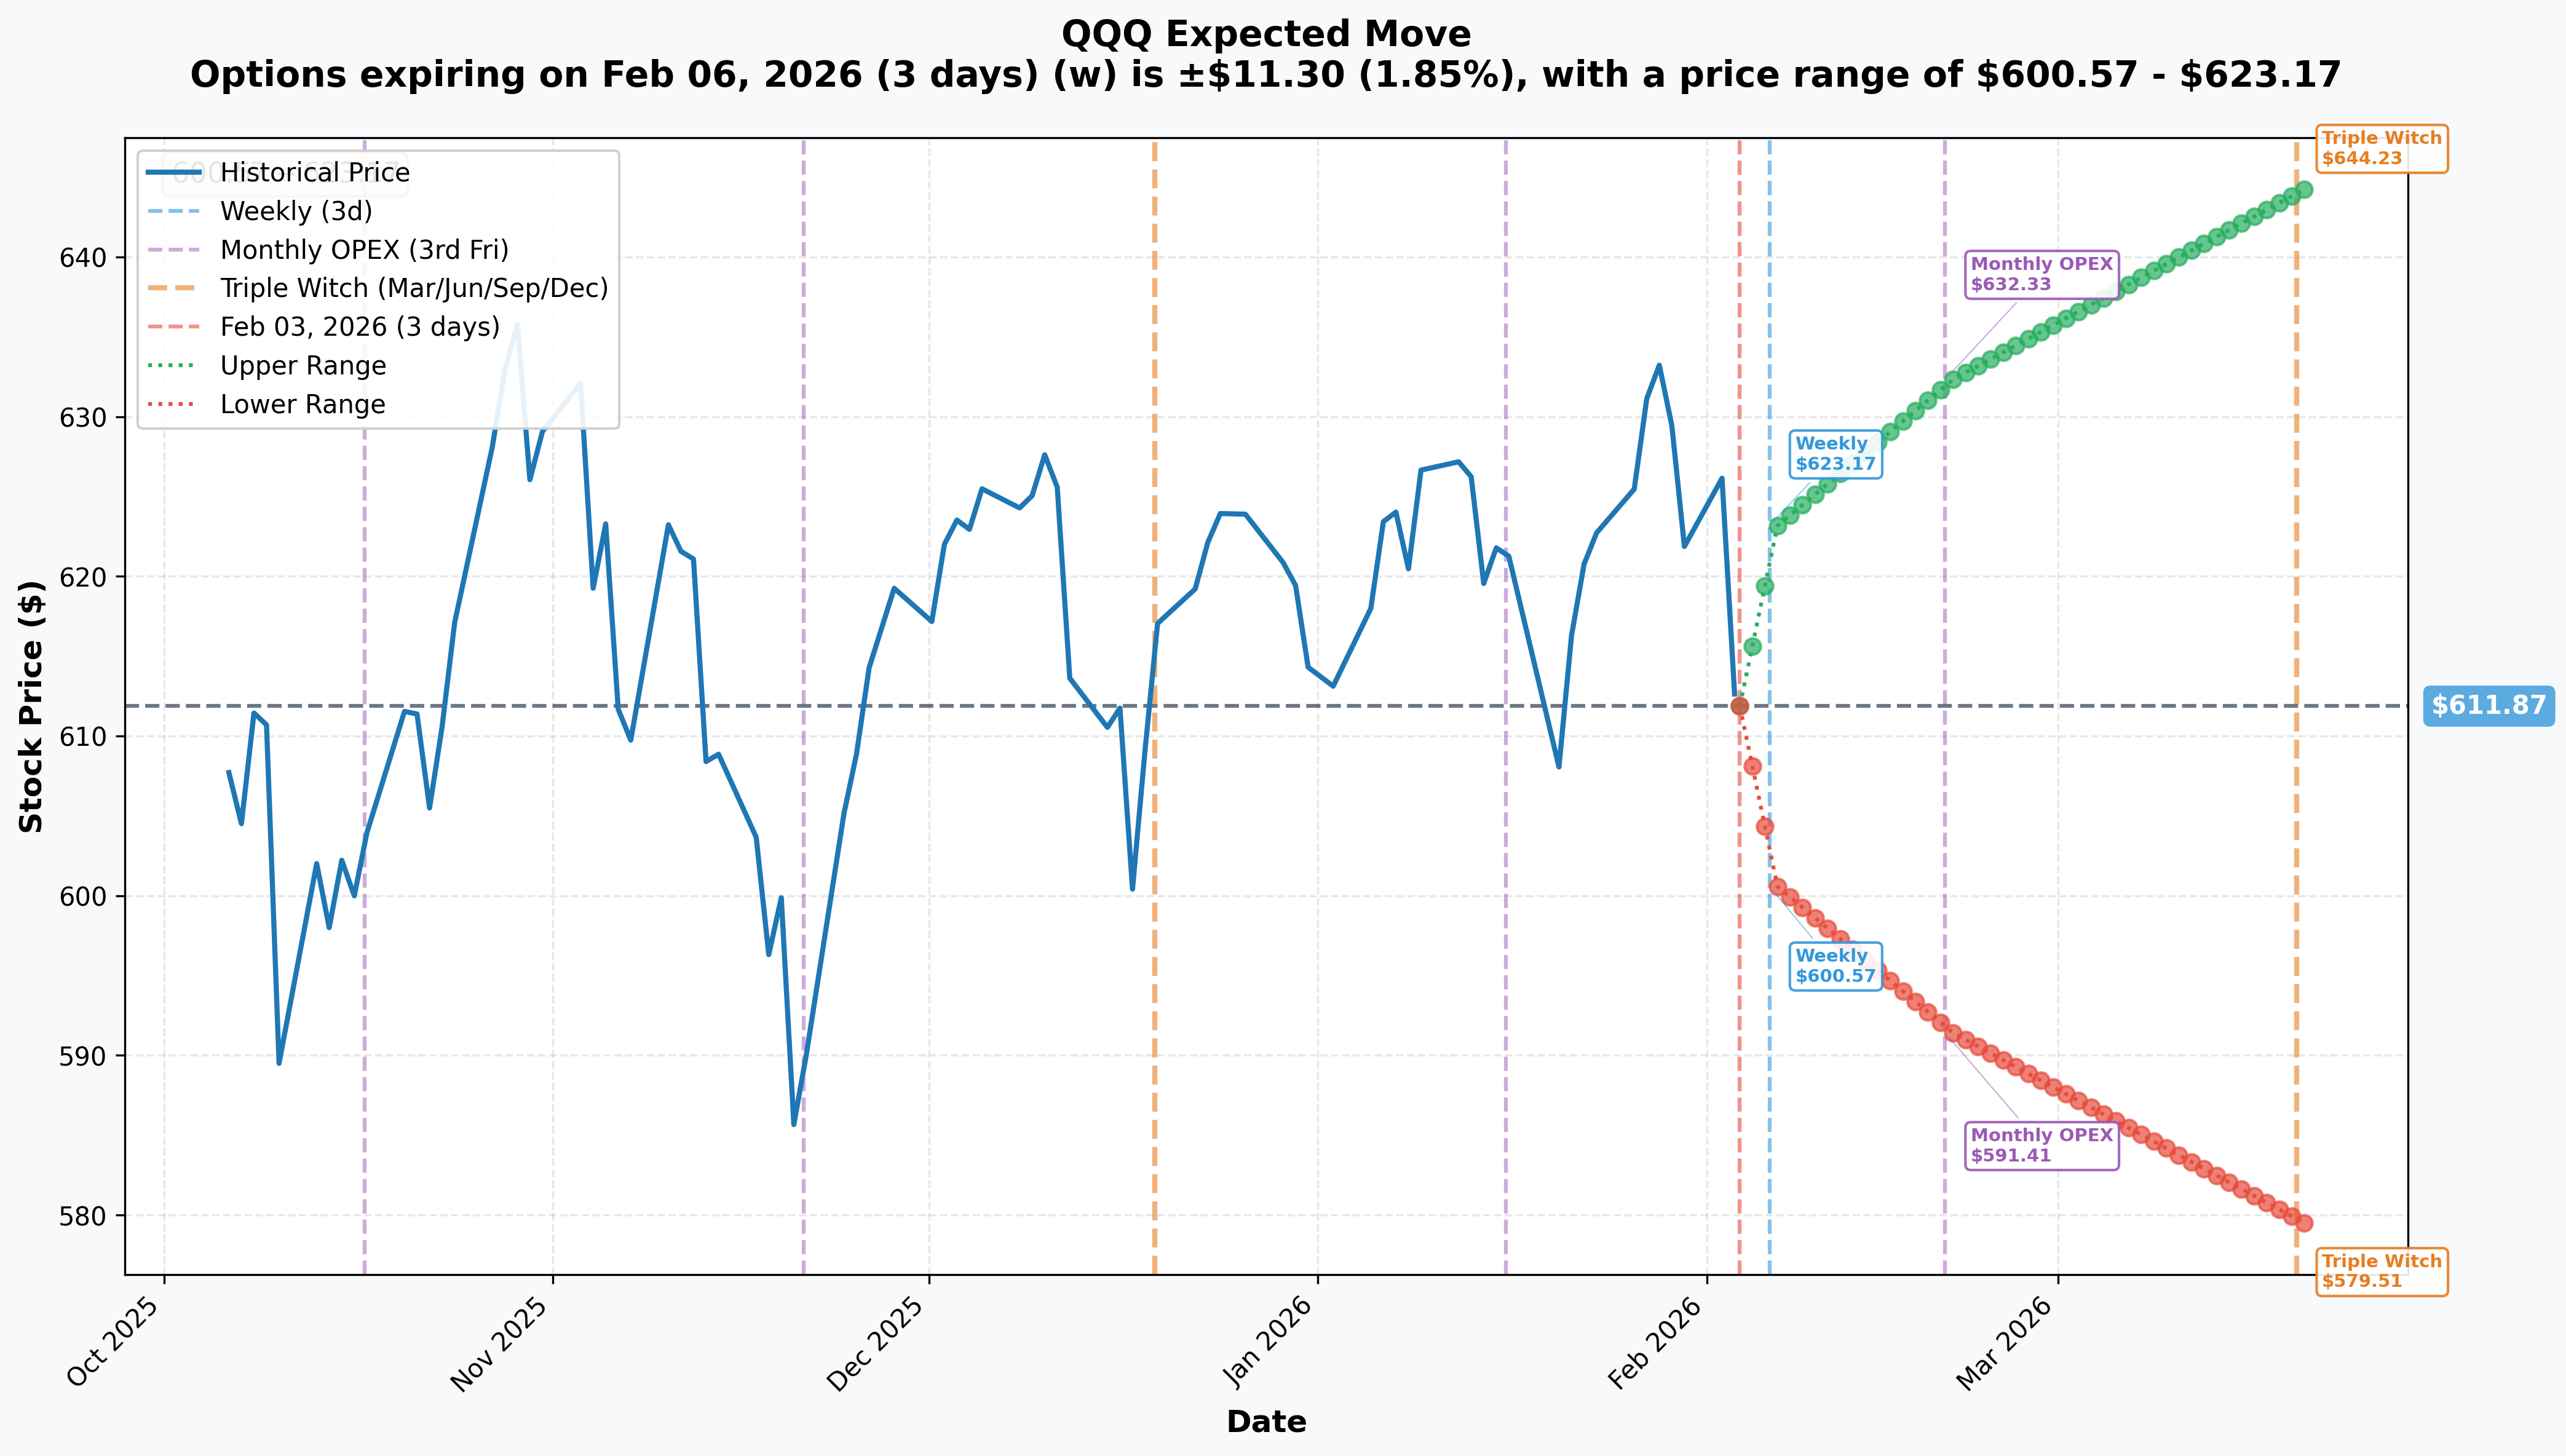
The options market is pricing these expected moves:
| Timeframe | Expiry | Implied Move | Upper Range | Lower Range |
|---|---|---|---|---|
| Weekly | Feb 6 | +/-1.85% | $623 | $601 |
| Monthly OPEX | Feb 20 | +/-3.34% | $632 | $591 |
| Triple Witch | Mar 20 | +/-5.29% | $644 | $580 |
The Put Spread Context:
The $600/$570 put spread aligns almost perfectly with the monthly OPEX implied range:
- Lower bound of implied range: $591
- Put spread strikes: $600 (long) / $570 (short)
- Max profit zone: Below $570 (7% correction)
This trader is positioned for a move BEYOND the 1-standard deviation implied range - they're hedging for a 2-sigma event.
🎪 Catalysts
🚨 THIS WEEK - Dense Earnings Gauntlet
| Date | Company | Est. Revenue | Est. EPS | Key Watch |
|---|---|---|---|---|
| Feb 3 (TODAY) | AMD | $9.67B | $1.32 | Data Center guidance crucial |
| Feb 4 | Alphabet (GOOG) | $111.2B | $2.59 | Cloud growth +35% expected |
| Feb 5 | Amazon (AMZN) | $211.56B | $1.98 | AWS margins vs AI costs |
✅ Recent Results (Past 2 Weeks)
Winners:
- 🟢 Apple (Jan 29): EPS beat by 6.8%, iPhone revenue +23% YoY - CNBC coverage
- 🟢 Microsoft (Jan 28): EPS beat by 7.3%, Cloud revenue hit $50B - MSFT IR
- 🟢 Meta (Jan 28): Beat on both lines, raised 2026 CapEx to $115-135B - Variety
Mixed:
- 🟡 Tesla (Jan 28): EPS beat (+25%) but revenue declined YoY - CNBC
📅 Coming Up
| Date | Event | Impact |
|---|---|---|
| Feb 11 | January CPI | Inflation data could shift Fed outlook |
| Feb 26 | Nvidia Earnings | THE single biggest catalyst for QQQ |
| Mar 18 | FOMC Decision | Rate hold expected; Powell's final meeting |
🎲 Price Targets & Probabilities
Based on gamma levels, implied moves, and catalyst assessment:
🚀 Bull Case (30% probability)
Target: $630-$640
- AMD, GOOG, AMZN all beat and raise
- Market shrugs off valuation concerns
- AI infrastructure spending narrative strengthens
- The $600 put spread expires worthless (institution loses $3.9M hedge cost)
Catalyst: Strong AWS/Google Cloud guidance + AMD data center beats
⚖️ Base Case (50% probability)
Target: $605-$625
- Mixed earnings - some beats, some misses
- QQQ consolidates in current range
- Gamma walls at $600 and $620 contain price action
- Put spread likely expires with partial loss for buyer
Catalyst: Inline results with cautious 2026 guidance
😞 Bear Case (20% probability)
Target: $570-$595
- Multiple earnings disappointments
- AI CapEx concerns resurface (DeepSeek 2.0 narrative)
- CPI comes in hot, crushing rate cut hopes
- Put spread becomes profitable below ~$592
Catalyst: GOOG/AMZN miss + guidance cuts + macro deterioration
💡 Trading Ideas
🛡️ Conservative - "Sleep Well Strategy"
Strategy: Bull Put Spread below major support
- Sell Feb-20 $590 Put
- Buy Feb-20 $580 Put
- Net Credit: ~$1.20-1.50
- Max Risk: $8.50-8.80
- Win Rate: ~75% (needs QQQ above $590 by expiration)
Why this works: The $600 gamma wall provides massive support. Even if earnings disappoint, breaking $600 requires serious selling pressure. This trade profits from time decay while positioned well below the gamma fortress.
⚖️ Balanced - "Earnings Insurance"
Strategy: Protective Put Collar
- Own 100 shares QQQ (~$61,290)
- Buy Mar-20 $600 Put (~$8.50)
- Sell Mar-20 $640 Call (~$4.20)
- Net Cost: ~$4.30 per share
Why this works: You participate in upside to $640 while protected below $600. Perfect for the trader who wants to stay long through earnings but doesn't want to wake up to a -7% gap down.
🚀 Aggressive - "Fade the Fade"
Strategy: Call Butterfly targeting gamma squeeze
- Buy 1x Feb-20 $615 Call
- Sell 2x Feb-20 $625 Call
- Buy 1x Feb-20 $635 Call
- Net Debit: ~$1.60-1.80
- Max Profit: $8.20-8.40 if QQQ pins at $625
Why this works: If AMD crushes tonight and GOOG/AMZN follow, the negative gamma at $620 flips to positive momentum. This low-risk/high-reward butterfly profits from a controlled rally to resistance.
⚠️ Risk Factors
🚨 What Could Go Wrong
-
1️⃣ AI CapEx Fatigue: If Google or Amazon signal slower infrastructure spending, the entire AI trade reverses. This is what DeepSeek did in January 2025.
-
2️⃣ Valuation Compression: QQQ trades at 22x forward P/E vs. 17x historical average. Any shift in Fed outlook or macro concerns could trigger multiple compression.
-
3️⃣ Concentration Risk: Magnificent Seven dominates QQQ. If just 2-3 names miss, the index gets hit hard regardless of broader market health.
-
4️⃣ Tariff Uncertainty: US-China tariff extension expires Nov 2026. Any early posturing could rattle tech supply chains.
-
5️⃣ The Nvidia Wildcard (Feb 26): The single largest QQQ holding reports in 3 weeks. Everything else might just be noise before the main event.
📉 Technical Warning Signs
According to Charles Schwab's analysis, Bank of America's Risk-Love Indicator is at the 95th percentile - historically a cautionary signal. And Forex.com notes that a 5-10% correction is the most likely scenario for early 2026, with 10-20% possible on earnings disappointment.
🎯 The Bottom Line
Real talk: This $7.9M put spread roll isn't a panic trade - it's professional portfolio management in action. An institution with serious exposure is methodically adjusting their hedge before three major earnings reports in 72 hours.
Here's the deal:
✅ If you own QQQ: The smart money isn't abandoning ship, but they ARE buying insurance. Consider adding a small put hedge (Feb-20 $600 puts around $6-7) to sleep better through earnings.
👀 If you're watching from the sidelines: Wait for clarity after AMZN reports Thursday. The $600-$620 range is well-defined - trade the range until it breaks.
🐻 If you're bearish: The $570 strike on this roll tells you where institutions see real downside risk. A break below $600 opens the door to $580-$570 quickly.
Mark your calendars:
- 🚨 Tonight: AMD earnings after close
- 🚨 Tomorrow: Google earnings after close
- 🚨 Thursday: Amazon earnings after close
- 📢 Feb 26: Nvidia - the main event
The whale who rolled this put spread isn't betting on a crash - they're staying invested while keeping their seatbelt firmly fastened. In a week with $33 trillion of Nasdaq-100 market cap reporting earnings, that's probably the right approach.
🔗 Charts & Resources
⚠️ Disclaimer: Options trading involves significant risk of loss and is not suitable for all investors. This analysis is for educational purposes only and should not be construed as investment advice. Always do your own research and consult with a licensed financial advisor before making trading decisions. Past performance does not guarantee future results.
Analysis generated: February 3, 2026 | Data sources: Theta Data, Polygon.io, Company filings