🐋 QQQ: Someone Just Dropped $22 Million on Downside Protection!
📅 February 11, 2026 | 🔥 Unusual Activity Detected
🎯 The Quick Take
A massive $22 million put trade just hit the tape on QQQ - the Nasdaq 100 ETF tracking tech's biggest names. This is a single 10,000-contract bet that the tech sector is heading lower by December, with a Z-score of 121.6 (meaning this trade is 121x more unusual than average daily activity). Whether it's hedging or pure directional conviction, someone with deep pockets is preparing for potential turbulence ahead.
🏢 About QQQ
Invesco QQQ Trust, Series 1 is one of the largest and most liquid ETFs in the world, tracking the Nasdaq 100 Index.
| Metric | Value | Source |
|---|---|---|
| Current Price | $613.97 | StockAnalysis |
| AUM | $402.6B (5th largest US ETF) | Invesco |
| What It Tracks | Nasdaq 100 (Top 100 non-financial Nasdaq stocks) | ETFdb |
| 52-Week Range | $402.39 - $637.01 | ETFdb |
| Top Holdings | NVDA (9%), AAPL (8%), MSFT (7.2%), AMZN (4.9%), META (4%) | Invesco |
Translation: This is basically a bet on Big Tech and the "Magnificent 7" all wrapped into one ticker. When QQQ moves, the tech world pays attention.
💰 The Option Flow Breakdown
📊 The Trade That Caught Our Eye
| Time | Symbol | Buy/Sell | Call/Put | Expiration | Premium | Strike | Volume | OI | Size | Spot | Option Price |
|---|---|---|---|---|---|---|---|---|---|---|---|
| 12:53:19 | QQQ | 🟢 BUY | PUT | 2026-12-18 | $22,000,000 | $540 | 10,000 | 7,142 | 10,000 | $613.97 | $22.00 |
Strategy Detected: Long Put
🤓 What This Actually Means
Real talk: Someone just paid $22 million in premium for the right to sell QQQ at $540 by December 18, 2026. Let's break this down:
🐋 Trade Size: 10,000 contracts = 1,000,000 shares of exposure 📉 Strike Distance: $540 is about 12% below current price 📅 Time Horizon: 10 months to expiration 🔥 Z-Score: 121.6 - This is EXTREMELY UNUSUAL (roughly a once-in-a-few-months event) 📊 Vol/OI Ratio: 1.4x (HIGH ACTIVITY) 💵 Cost Per Contract: ~$2,200 per contract
The Contract: QQQ Dec 18 2026 $540 Put
Translation for us regular folks: This is either:
- A massive hedge by an institution protecting a huge tech portfolio
- A directional bet that QQQ drops 12%+ by year-end
- A fund preparing for potential market turbulence from AI disruption, rate uncertainty, or sector rotation
Either way, when someone commits $22M to downside protection, it's worth paying attention.
📈 Technical Setup & Chart Check-Up
YTD Performance
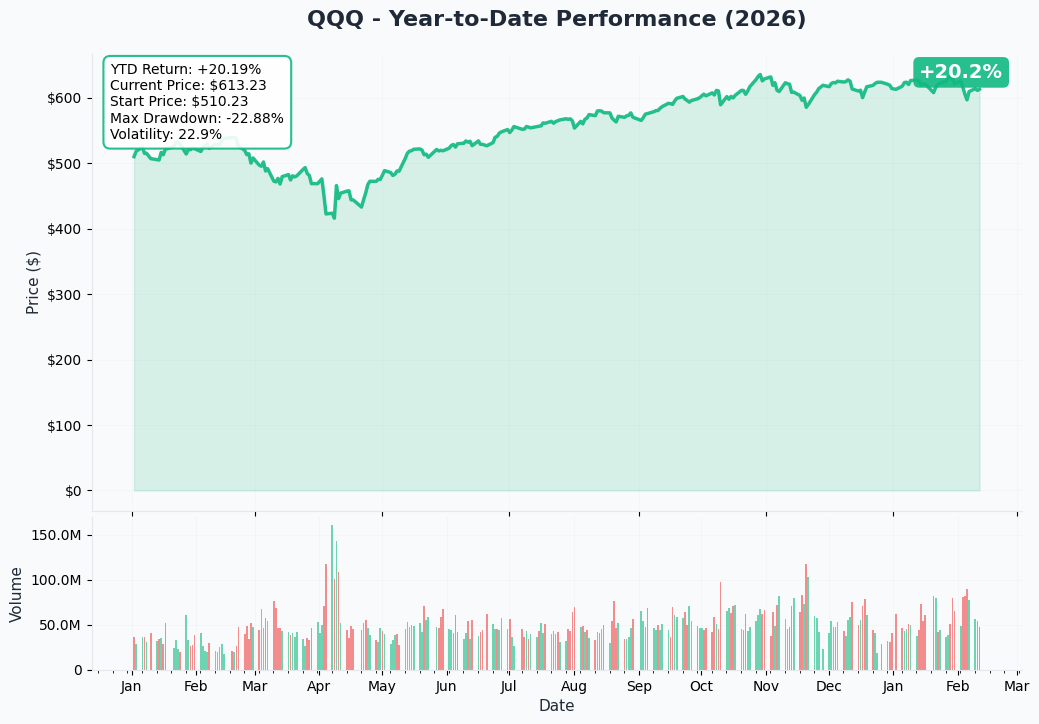
QQQ has had a volatile start to 2026:
- Down 2.46% over the past month amid February's historically weak seasonality
- Trading near 52-week highs but off the $637 peak
- The Anthropic Claude AI disruption has triggered an $830B selloff in software stocks since late January
🔵🟠 Gamma-Based Support & Resistance
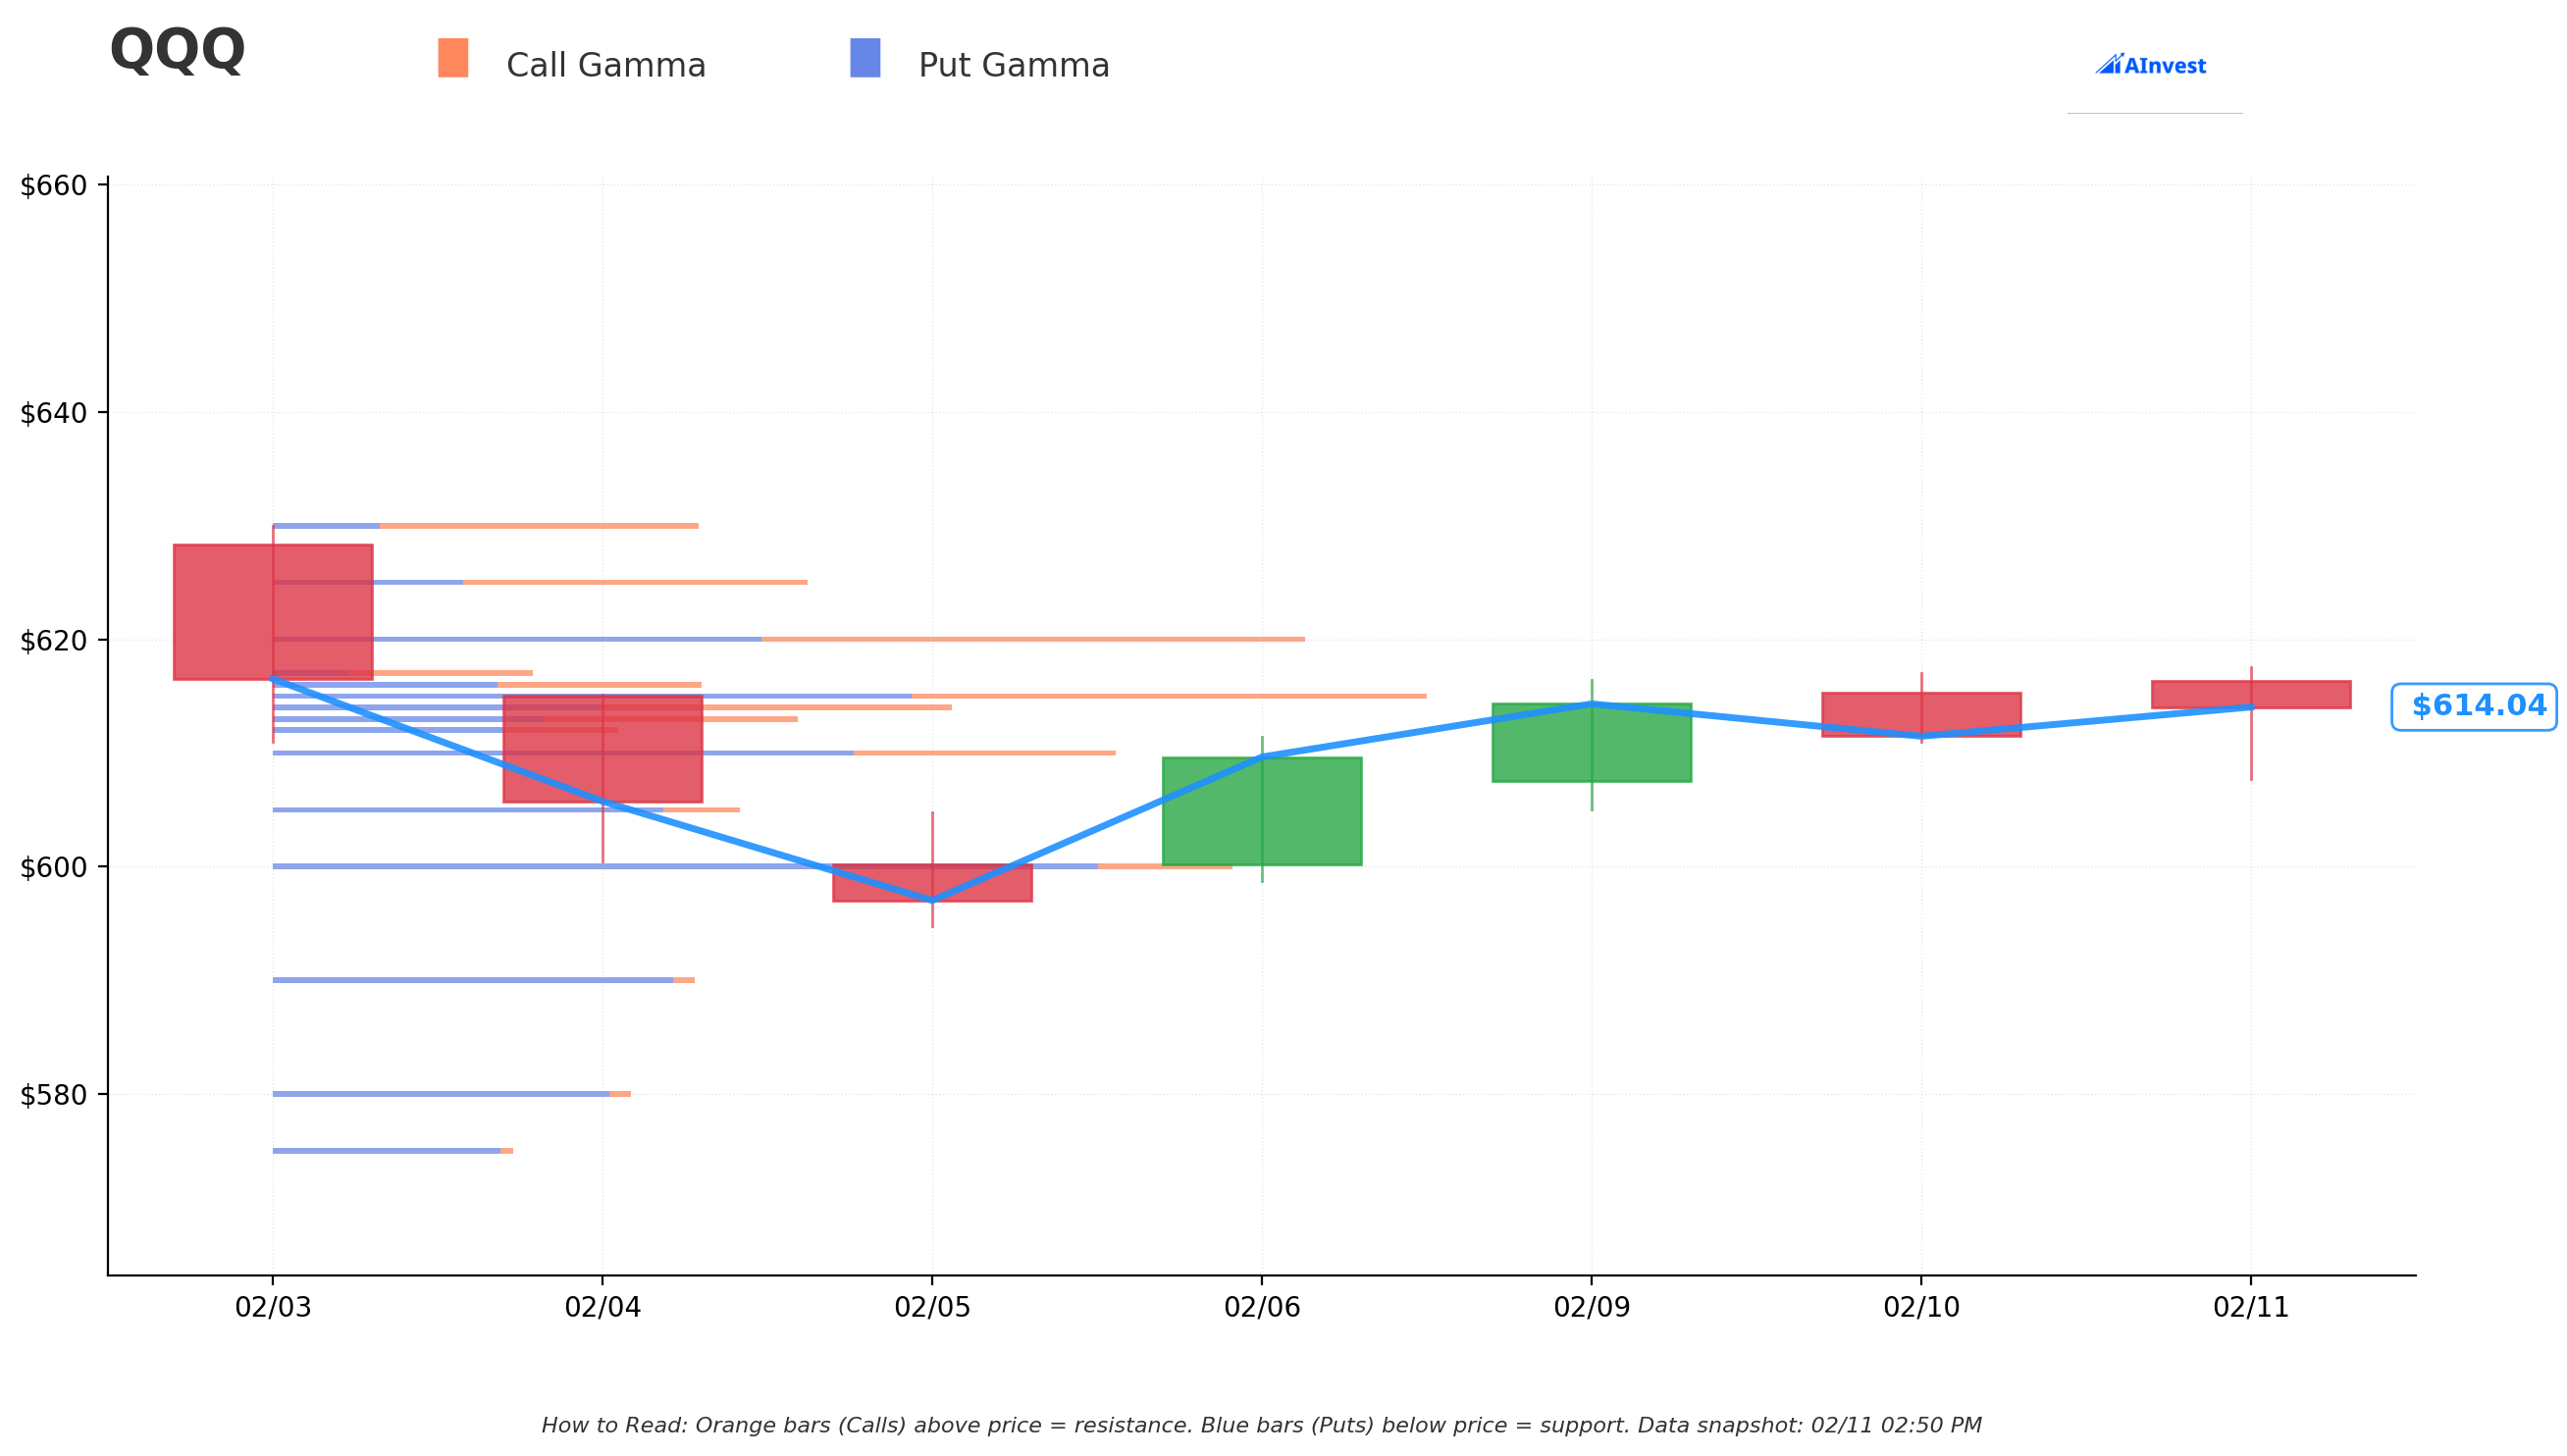
Current Price: $613.97 | Net GEX Bias: Bearish (Put gamma exceeds Call gamma)
Key Resistance Levels (Orange Bars - Call Gamma):
| Strike | Net GEX | Distance |
|---|---|---|
| $614 | +7.6 | At price (immediate ceiling) |
| $620 | +16.0 | +1.0% (first real resistance) |
| $625 | +44.5 | +1.8% (moderate barrier) |
| $630 | +61.2 | +2.6% (strong resistance) |
Key Support Levels (Blue Bars - Put Gamma):
| Strike | Net GEX | Distance |
|---|---|---|
| $613 | -3.9 | -0.2% (immediate support) |
| $610 | -93.1 | -0.6% (strong support) |
| $605 | -89.4 | -1.5% (secondary floor) |
| $600 | -198.4 | -2.3% (major support) |
What the gamma tells us: There's massive put gamma concentrated at $600-$610, creating a likely support zone if we see selling pressure. Above $620, call gamma builds, which could create resistance. The net bearish GEX bias suggests dealers are positioned in a way that could amplify moves in either direction.
📊 Implied Move Analysis
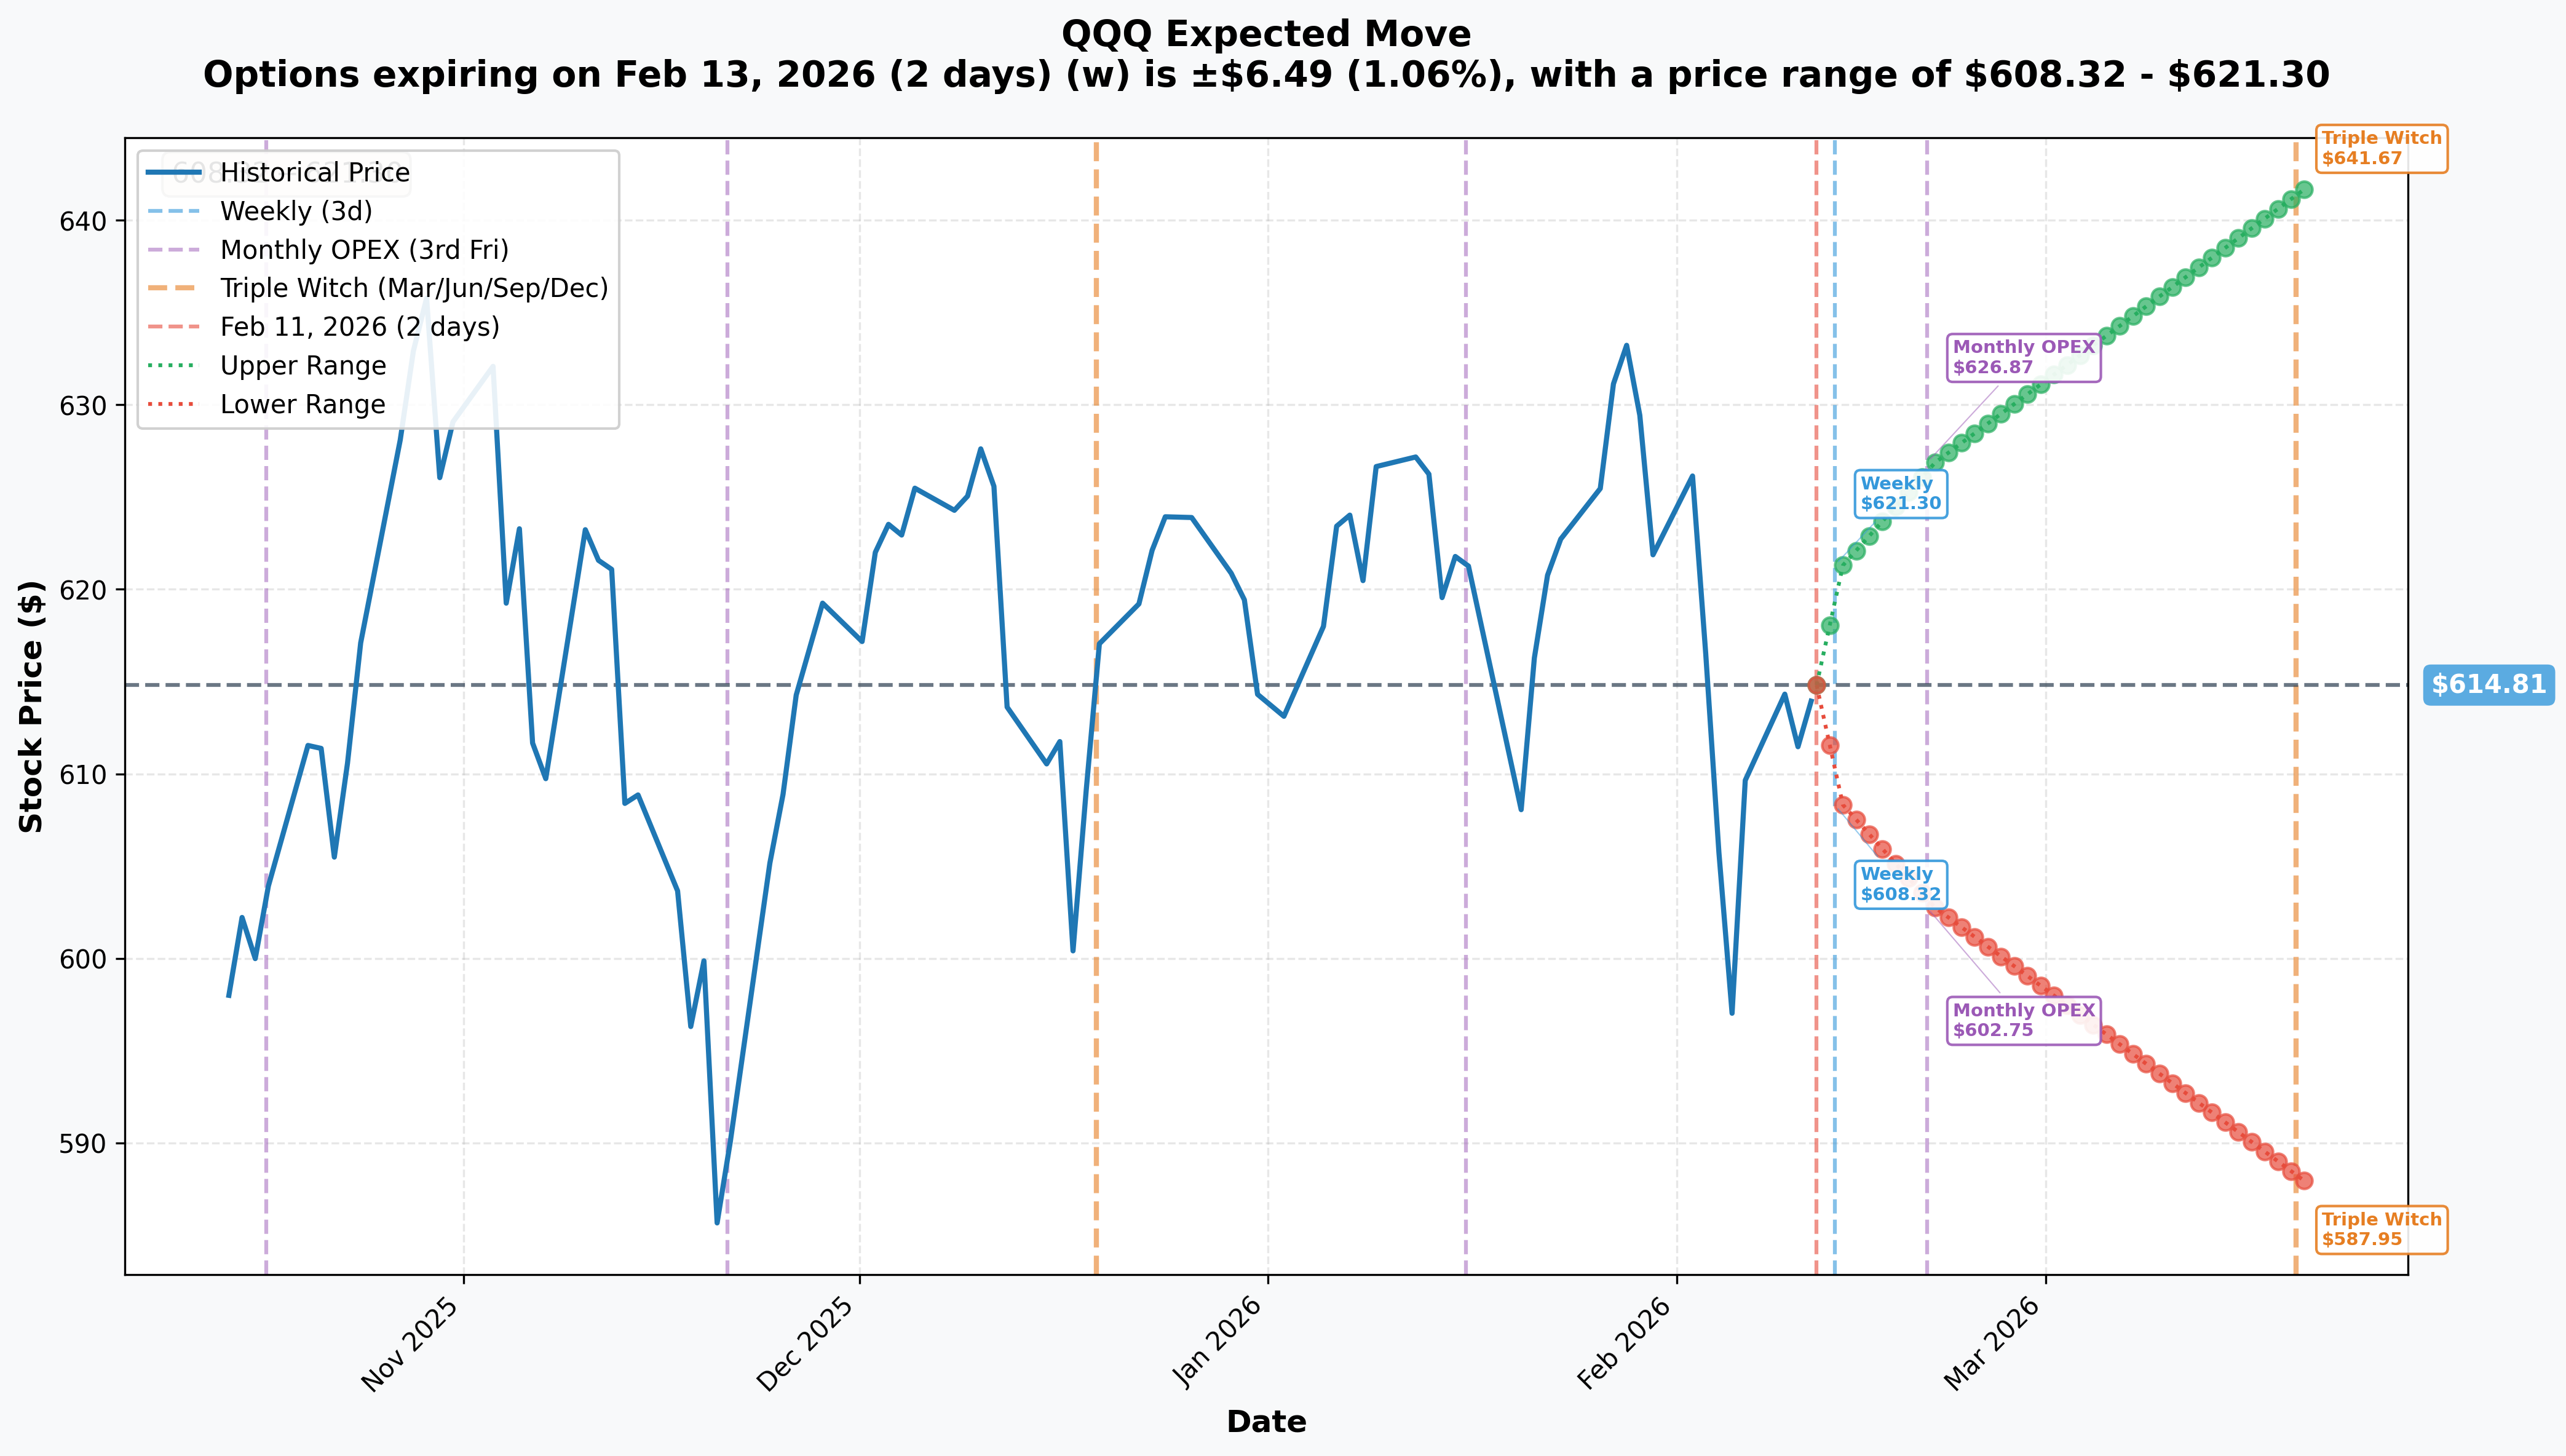
| Timeframe | Expiry | Implied Move | Range |
|---|---|---|---|
| Weekly | Feb 13 | ±1.06% ($6.49) | $608.32 - $621.30 |
| Monthly OPEX | Feb 20 | ±1.96% ($12.06) | $602.75 - $626.87 |
| Triple Witch | Mar 20 | ±4.37% ($26.86) | $587.95 - $641.67 |
Why this matters: The options market is pricing in a potential 4.4% move by March Triple Witch. That's meaningful for a mega-cap ETF like QQQ. The weekly implied move suggests traders expect action around the January CPI report on February 13.
🎪 Catalysts
📅 Upcoming (Mark Your Calendar!)
| Date | Event | Impact | Why It Matters |
|---|---|---|---|
| Feb 13 | January CPI Report | 🔥 HIGH | Could shift Fed rate expectations dramatically |
| Feb 25 | Nvidia Q4 FY2026 Earnings | 🔥 CRITICAL | NVDA is 9% of QQQ - this moves the needle |
| Mar 4 | Broadcom Q1 FY2026 Earnings | 🔥 HIGH | AI networking bellwether |
| Mar 18-19 | FOMC Meeting | 🔥 HIGH | Rate decision impacts all of tech |
| Apr 30 | Apple Q2 FY2026 Earnings | 🔥 HIGH | AAPL is 8% of QQQ |
| Jun 17 | FOMC Meeting | 🔥 HIGH | Potential rate cut |
✅ Recent Catalysts (Already Happened)
Mega-Cap Tech Earnings - Mixed but Mostly Strong:
🍎 Apple (Jan 29): Record $143.8B revenue (+16%), iPhone 17 crushing it 💙 Microsoft (Jan 28): Beat with $81.3B revenue, but stock -7% on slowing Azure growth concerns 🔤 Alphabet (Feb 4): Crushed it - $113.8B revenue, Cloud +48% YoY 📦 Amazon (Feb 5): Beat on revenue, but -5% on $200B capex guidance 👤 Meta (Jan 28): Strong $59.9B revenue (+24%), but capex nearly doubling to $115-135B
The Big Story - AI Disruption:
The Anthropic Claude Cowork launch has triggered a software selloff, wiping $830B in market value since late January. Traditional software companies like Salesforce (-26% YTD) and Workday (-22%) are getting hammered on AI automation fears.
🎲 Price Targets & Probabilities
Based on gamma levels, implied moves, and the catalyst calendar:
🐻 Bear Case: $587 - $600 (-2.3% to -4.4%)
Probability: 25-30% Scenario: CPI comes in hot, Fed stays hawkish, Nvidia disappoints, or AI disruption fears accelerate Key Levels: $600 is massive put gamma support; $587.95 is the Triple Witch implied move floor What triggers this: Hot inflation print Feb 13, Nvidia miss on Feb 25, or broader risk-off
⚖️ Base Case: $610 - $620 (±1%)
Probability: 45-50% Scenario: Mixed signals keep QQQ range-bound between key gamma levels Key Levels: $610 support holds, $620 resistance caps upside What triggers this: In-line CPI, solid (not spectacular) Nvidia results, Fed holds steady
🚀 Bull Case: $625 - $642 (+1.8% to +4.4%)
Probability: 20-25% Scenario: Cool CPI, Nvidia blowout quarter, tech rotation reverses Key Levels: $625 needs to clear for $630, $641.67 is Triple Witch implied move ceiling What triggers this: CPI surprise to downside, Nvidia raises guidance again, sector rotation back into tech
💡 Trading Ideas
🛡️ Conservative: "Sleep Well Through Earnings"
Strategy: Put Spread for Defined-Risk Protection Trade: Buy QQQ Mar 20 $600 Put / Sell Mar 20 $580 Put Cost: ~$3.50 per spread ($350 per contract) Max Profit: $20 spread - $3.50 cost = $16.50 ($1,650) if QQQ below $580 Breakeven: $596.50 Why this works: Protects against the downside the whale is betting on, with capped risk. You're not paying $22M like the big fish, but you get similar exposure.
⚖️ Balanced: "Straddle the CPI"
Strategy: Weekly Straddle for CPI Volatility Trade: Buy QQQ Feb 14 $615 Straddle (Call + Put) Cost: ~$6.50 total ($650 per straddle) Breakeven: $608.50 or $621.50 Why this works: CPI on Feb 13 could move markets either way. The implied move is pricing in ±1.06%, so you need roughly a 1.1% move to profit. Binary events like CPI often exceed expectations.
🚀 Aggressive: "Ride the Nvidia Wave"
Strategy: Call Calendar for Feb 25 Earnings Trade: Sell QQQ Feb 21 $620 Call / Buy Mar 20 $620 Call Credit: ~$1.00 net debit Max Profit: If QQQ near $620 at Feb expiry, then rallies post-Nvidia Why this works: Nvidia earnings on Feb 25 fall right after Feb monthly OPEX. If QQQ pins around $620 through Feb 21, you own a cheap March call into the most important tech earnings of the quarter.
⚠️ Risk Factors
📉 Concentration Risk: Top 3 holdings (NVDA, AAPL, MSFT) = 24% of QQQ. One bad earnings and you feel it.
🤖 AI Disruption Spreading: The Anthropic Claude selloff started with software but could spread to other tech sectors.
💰 CapEx Crowding Out Buybacks: Hyperscalers are spending $600-700B on AI infrastructure in 2026. Less buyback support = less EPS tailwind.
📊 Sector Rotation Underway: Money is flowing out of tech into old economy stocks. Basic materials up +9% YTD while software gets crushed.
🏦 Fed Staying Hawkish: Only 1-2 rate cuts expected in 2026. Tech valuations need low rates to justify multiples.
📅 February Seasonality: Historically the weakest month for Nasdaq 100 (21 losing vs 20 winning since 1985).
🎯 The Bottom Line
Here's the deal: A $22 million put trade doesn't happen every day - this is a 121x more unusual than average activity. Someone with serious capital is either hedging a massive tech portfolio or making a directional bet that QQQ heads lower by December.
What should you do?
📈 If you're bullish on tech: Don't ignore this warning shot. Consider tightening stops or adding some downside hedges. Nvidia earnings on Feb 25 is your next big test.
👀 If you're watching from the sidelines: This is a fascinating setup. Wait for CPI (Feb 13) and Nvidia (Feb 25) to clarify direction before committing capital. The $610-$620 range is your battleground.
🐻 If you're bearish: The big money agrees with you. Consider put spreads with March expiry to capture the volatility window through Triple Witch.
Mark your calendar: February 13 (CPI) and February 25 (Nvidia) are the pivotal dates. The next two weeks will likely determine whether QQQ breaks above $625 or retests $600.
Disclaimer: This analysis is for informational purposes only and does not constitute investment advice. Options trading involves significant risk of loss and is not suitable for all investors. The $22M trade discussed could be a hedge, not a directional bet. Always do your own research and consider your risk tolerance before trading. Past unusual activity does not guarantee future price movement.
Analysis Date: February 11, 2026