🐻 QQQ: $14M LEAP Put — Smart Money Hedging Tech for 18 Months!
📅 March 12, 2026 | 🔥 Unusual Activity Detected
🎯 The Quick Take
Someone just dropped $14 MILLION on an 18-month QQQ put with expiration September 17, 2027 — locking in downside protection on the world's most widely held tech ETF for the next year and a half. With QQQ already pulling back from its January all-time high of $637 and trading near $600 today, this isn't a nervous retail trader — this is institutional-grade macro hedging or a full-on bearish bet on U.S. tech. Translation: Big money is buying a very long insurance policy right as the storm clouds gather.
📊 ETF Overview
Invesco QQQ Trust (NASDAQ: QQQ) is one of the largest, most liquid ETFs on earth — tracking the Nasdaq-100 Index, the 100 largest non-financial companies listed on Nasdaq:
- AUM: ~$392.6 billion (Invesco QQQ Holdings)
- Expense Ratio: 0.20%
- 52-Week Range: $402.39 – $637.01
- Current Price: $600.34 (at time of trade) / $598.95 (intraday)
- 3-Month Performance: −2.75% (pulled back from Jan ATH of $637.01)
- 1-Year Performance: +27.78%
Top 10 Holdings (combined ~47% of ETF):
| Rank | Ticker | Company | Weight |
|---|---|---|---|
| 1 | NVDA | NVIDIA Corporation | 8.81% |
| 2 | AAPL | Apple Inc. | 7.51% |
| 3 | MSFT | Microsoft Corporation | 5.86% |
| 4 | AMZN | Amazon.com, Inc. | 4.43% |
| 5 | TSLA | Tesla, Inc. | 3.97% |
| 6 | META | Meta Platforms, Inc. | 3.75% |
| 7 | GOOGL | Alphabet Inc. (Class A) | 3.50% |
| 8 | GOOG | Alphabet Inc. (Class C) | 3.25% |
| 9 | WMT | Walmart Inc. | 3.25% |
| 10 | AVGO | Broadcom Inc. | 3.14% |
Source: QQQ Holdings — stockanalysis.com
Sector mix: Technology dominates at 50%, followed by Communication Services (16.4%) and Consumer Cyclical (12.5%). This is as tech-concentrated as it gets in ETF-land. 📱
💰 The Option Flow Breakdown
📊 What Just Happened
The Tape (March 12, 2026 @ 12:18:52):
| Time | Symbol | Side | Buy/Sell | Type | Expiration | Premium | Strike | Volume | OI | Size | Spot | Option Price |
|---|---|---|---|---|---|---|---|---|---|---|---|---|
| 12:18:52 | QQQ | MID | BUY | PUT | 2027-09-17 | $14M | $590 | 2,500 | 109 | 2,500 | $600.34 | $55.20 |
🤓 What This Actually Means
This is a massive macro hedge or outright bearish bet on the Nasdaq-100 for the next 18 months. Here's exactly what happened:
- 💸 $14M in premium paid: $55.20 per contract × 2,500 contracts = $13.8M (rounds to $14M)
- 🐋 Brand new position: Vol/OI ratio is 22.9x — 2,500 contracts traded against only 109 existing open interest. This is a fresh, newly opened position — not someone rolling or hedging existing puts
- 🛡️ Strike at $590: Just 1.7% below spot price of $600.34 — nearly at-the-money for an 18-month LEAP
- ⏰ September 17, 2027 expiration: 18 months of runway — this trade captures 4 full earnings seasons, multiple FOMC decisions, and the entire 2026 macro cycle
- 📊 2,500 contracts = 250,000 shares of QQQ exposure worth ~$150M at current prices
- 🎯 Unusual Score: EXTREMELY_UNUSUAL — this is the kind of trade you see maybe a few times a year in QQQ's options market
What's really going on here:
This trader is either sitting on a massive long QQQ position and paying $55.20 per share for protection against a tech meltdown — or they're making an outright directional bet that QQQ trades below $590 at some point in the next 18 months. At 9.2% of contract price paid in premium, whoever did this has SERIOUS conviction. Think of it like buying fire insurance on your $150M tech house... when you can already smell smoke.
📈 Technical Setup / Chart Check-Up
YTD Performance
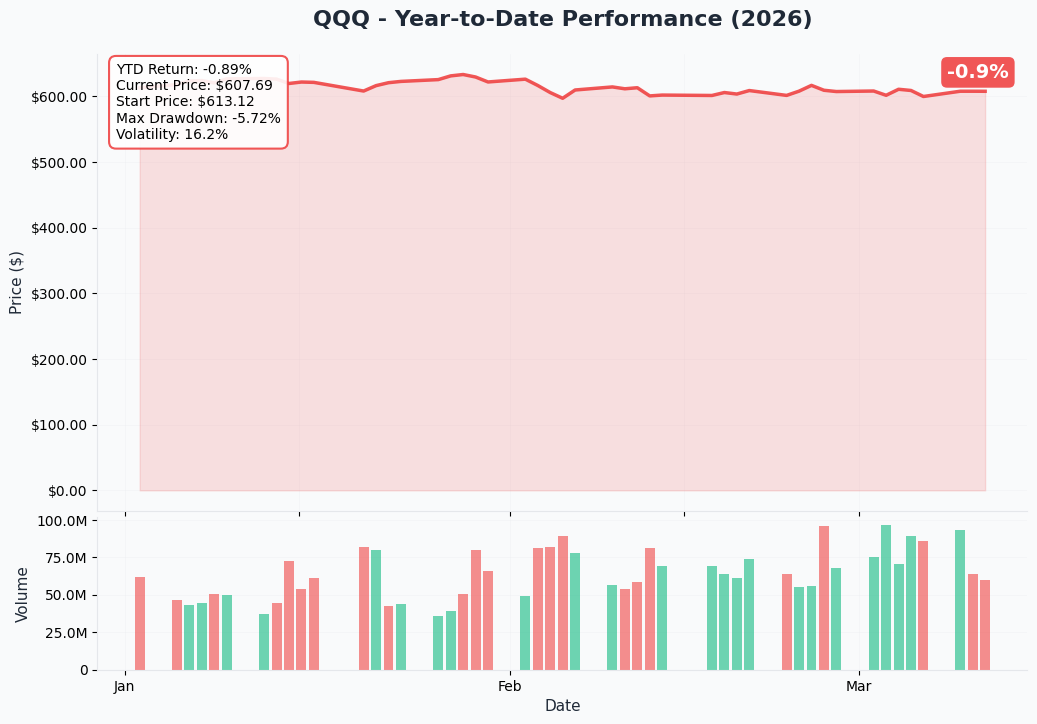
QQQ hit its all-time high of $637.01 in January 2026 and has been grinding lower ever since — currently down about 6% from those highs. The 52-week low was $402.39, and NVDA (top holding at 8.81%) showed a 52-week low near $86 before recovering to $212+, painting a picture of just how violent these tech corrections can be.
Key observations:
- 📉 Pulling back from ATH: QQQ has failed multiple times to reclaim $610+ after the January peak
- ⚠️ 50-day moving average test: Index retesting its 50-day MA amid elevated volatility since late February
- 🎢 Above-average volume: Institutions rotating and hedging at elevated rates since the U.S.–Iran conflict began February 28
- 💡 The correction is real: Down ~2.75% over 3 months while facing Iran oil shock, tariff headwinds, and DeepSeek AI disruption fears — Nasdaq faces a technical reckoning
🛡️ Gamma-Based Support & Resistance Analysis
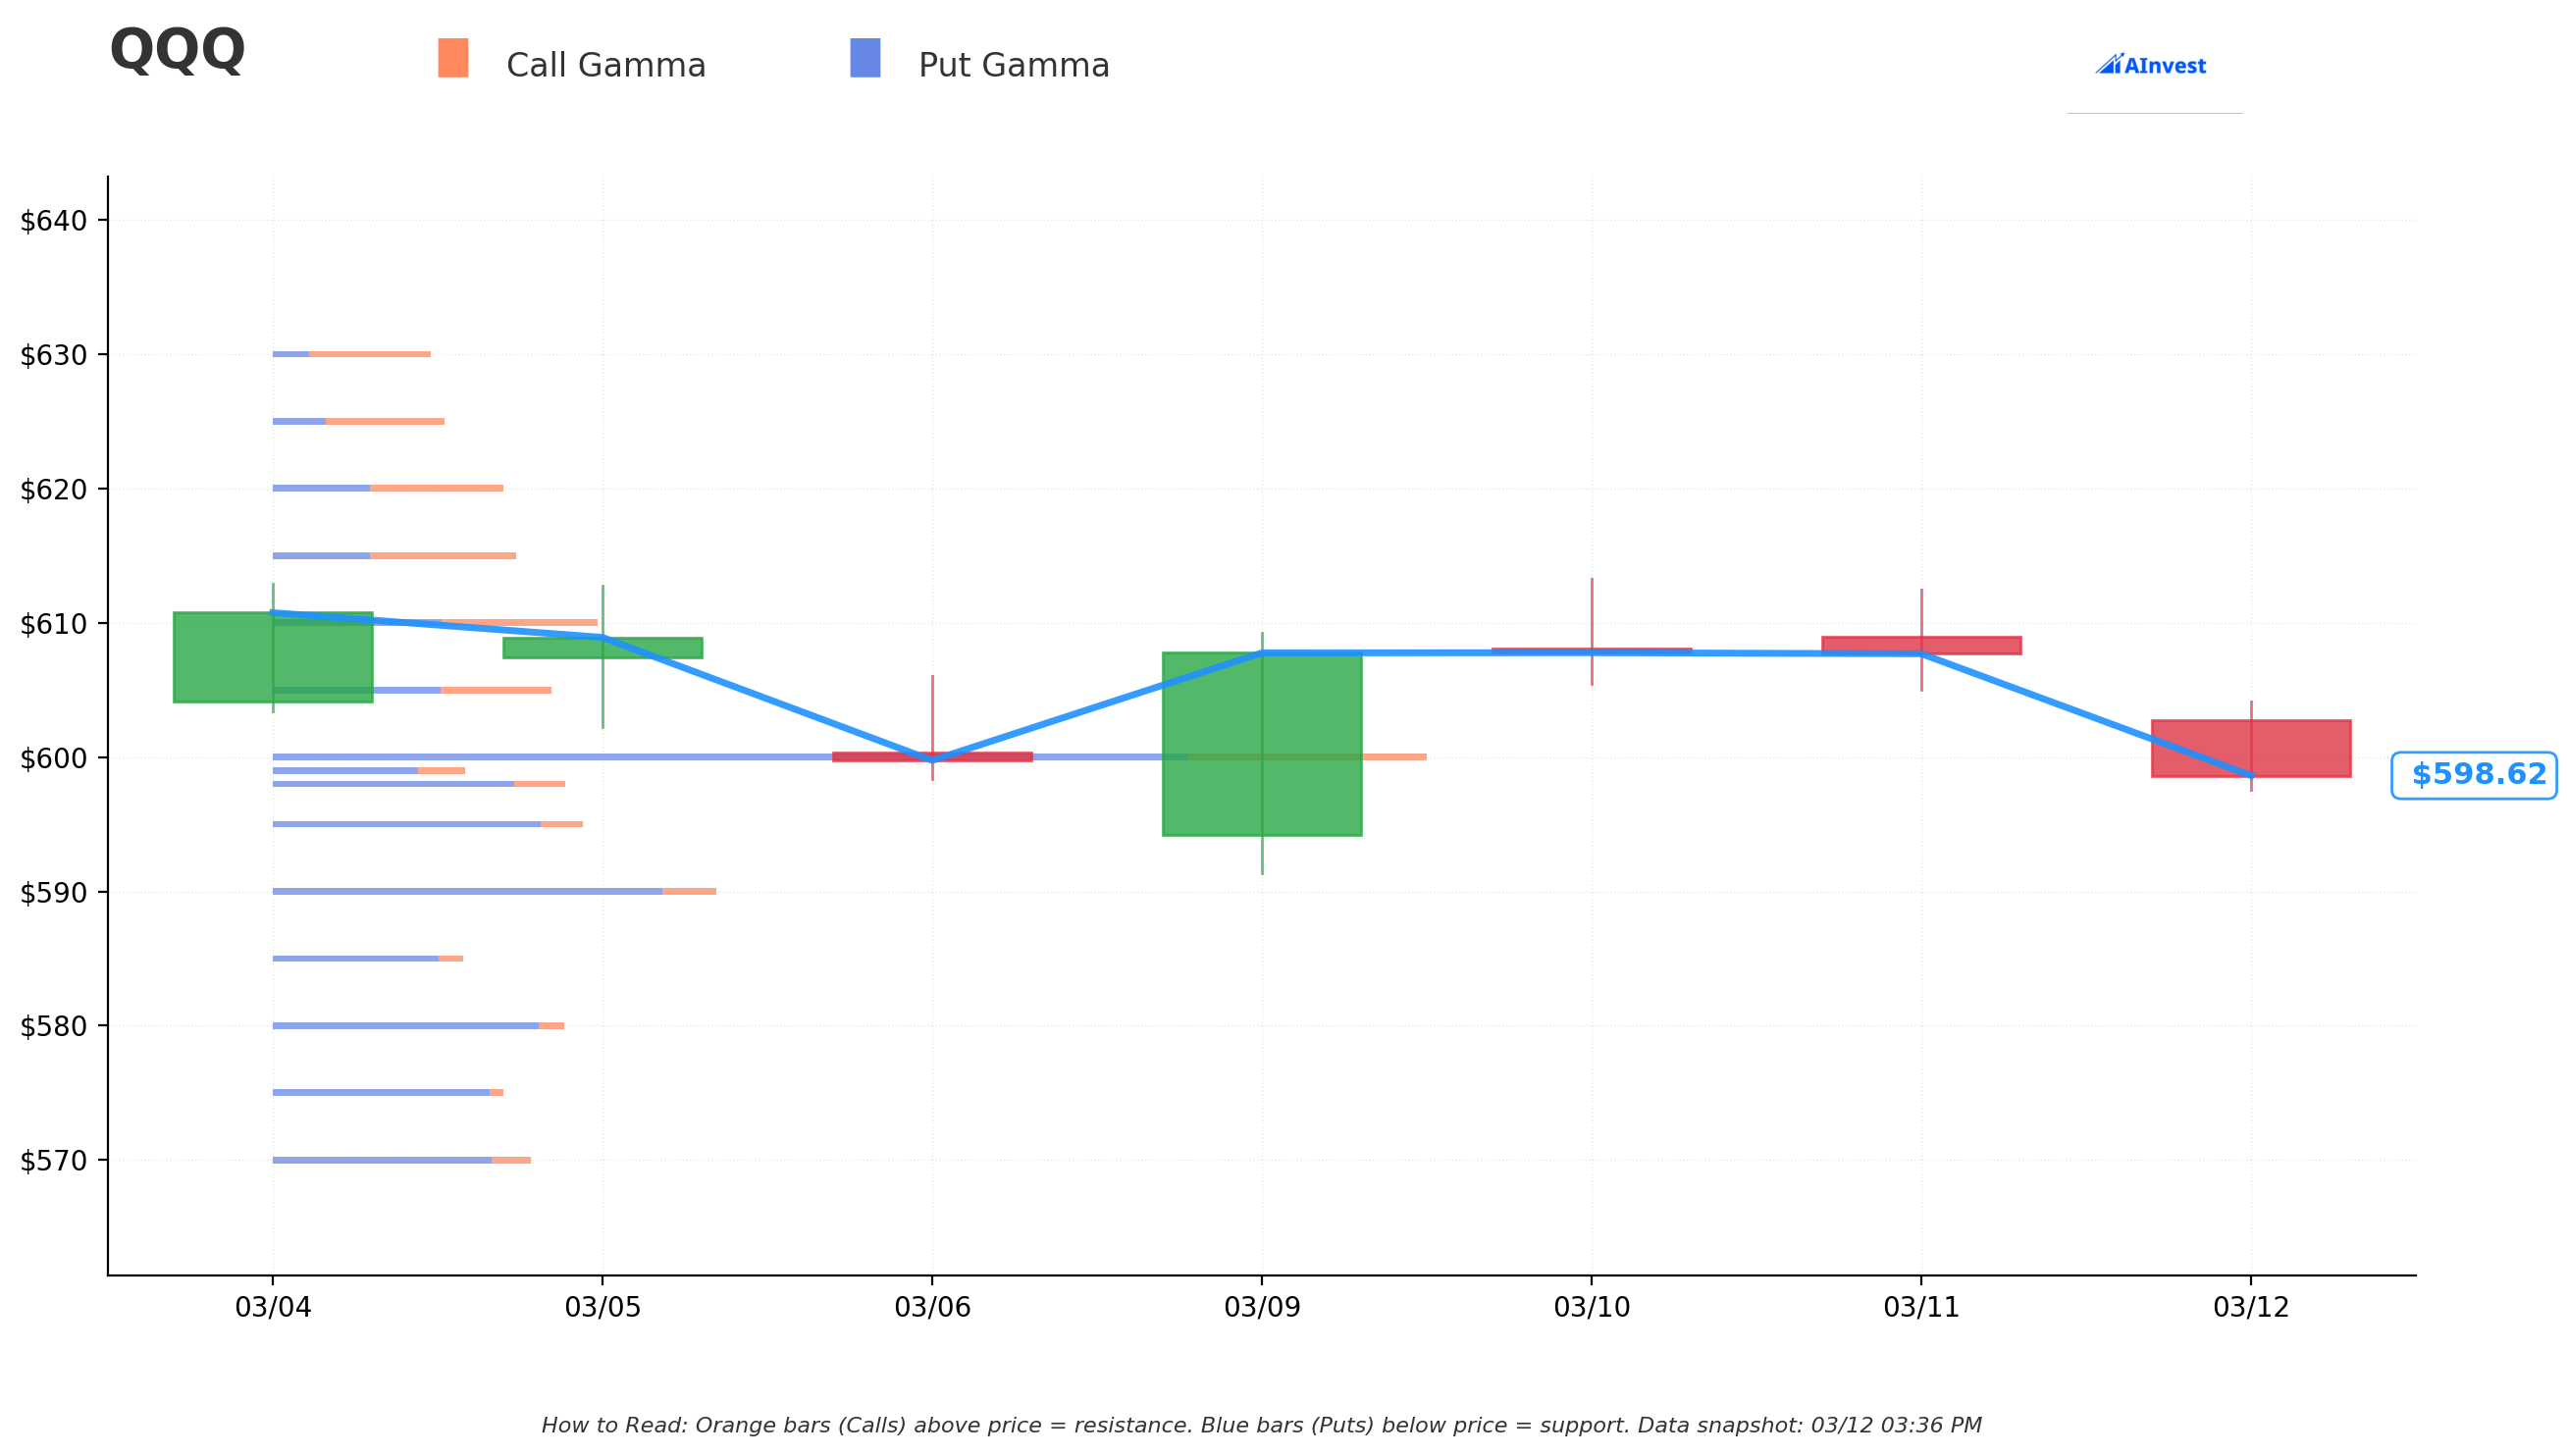
Current Price: $598.95
The gamma exposure map tells a clear story — QQQ's options positioning is heavily, HEAVILY skewed bearish:
🔵 Support Levels (Put Gamma Below Price):
- $598 — Immediate support with 110.97 total GEX (mostly put-driven at 91.27 put GEX)
- $595 — Secondary support at 127.27 total GEX (put GEX: 109.76 — strong floor)
- $590 — Major structural level at 183.02 total GEX ← THIS IS WHERE THE $14M PUT WAS STRUCK! (put GEX: 160.79)
- $580 — Deeper floor at 118.64 total GEX (3.2% below current price)
- $570 — Extended support at 106.45 total GEX (4.8% down)
🟠 Resistance Levels (Call Gamma Above Price):
- $599 — INSANE 33,817 total GEX (put GEX alone: 33,797!) — This is a WALL right above current price
- $600 — Secondary ceiling at 500.98 total GEX (still huge!)
- $605 — Next ceiling at 112.47 total GEX
- $610 — Extended resistance at 133.79 total GEX
The nuclear number: $599 has 33,817 total GEX — almost entirely PUT-driven.
Translation for regular folks: Market makers are holding an absolutely GIGANTIC put position at $599 — just $0.05 above where QQQ is trading right now. When price approaches $599 from below, dealers are forced to SELL QQQ shares to hedge. This mechanical selling pressure creates a ceiling that is brutally hard to push through.
Net GEX Bias: BEARISH — Total put GEX of 35,906 vs. total call GEX of only 1,076. That's a 33:1 put-to-call gamma ratio. The options market is screaming bearish. 📉
The put buyer at $590 chose their strike VERY deliberately — it sits at 183 GEX, one of the larger gamma-active levels below current price. If QQQ cracks through $598, $595, and then $590, each level has meaningful options activity that could accelerate the move. They're not just betting on a drift lower — they're positioned for a gamma-fueled cascade.
📐 Implied Move Analysis
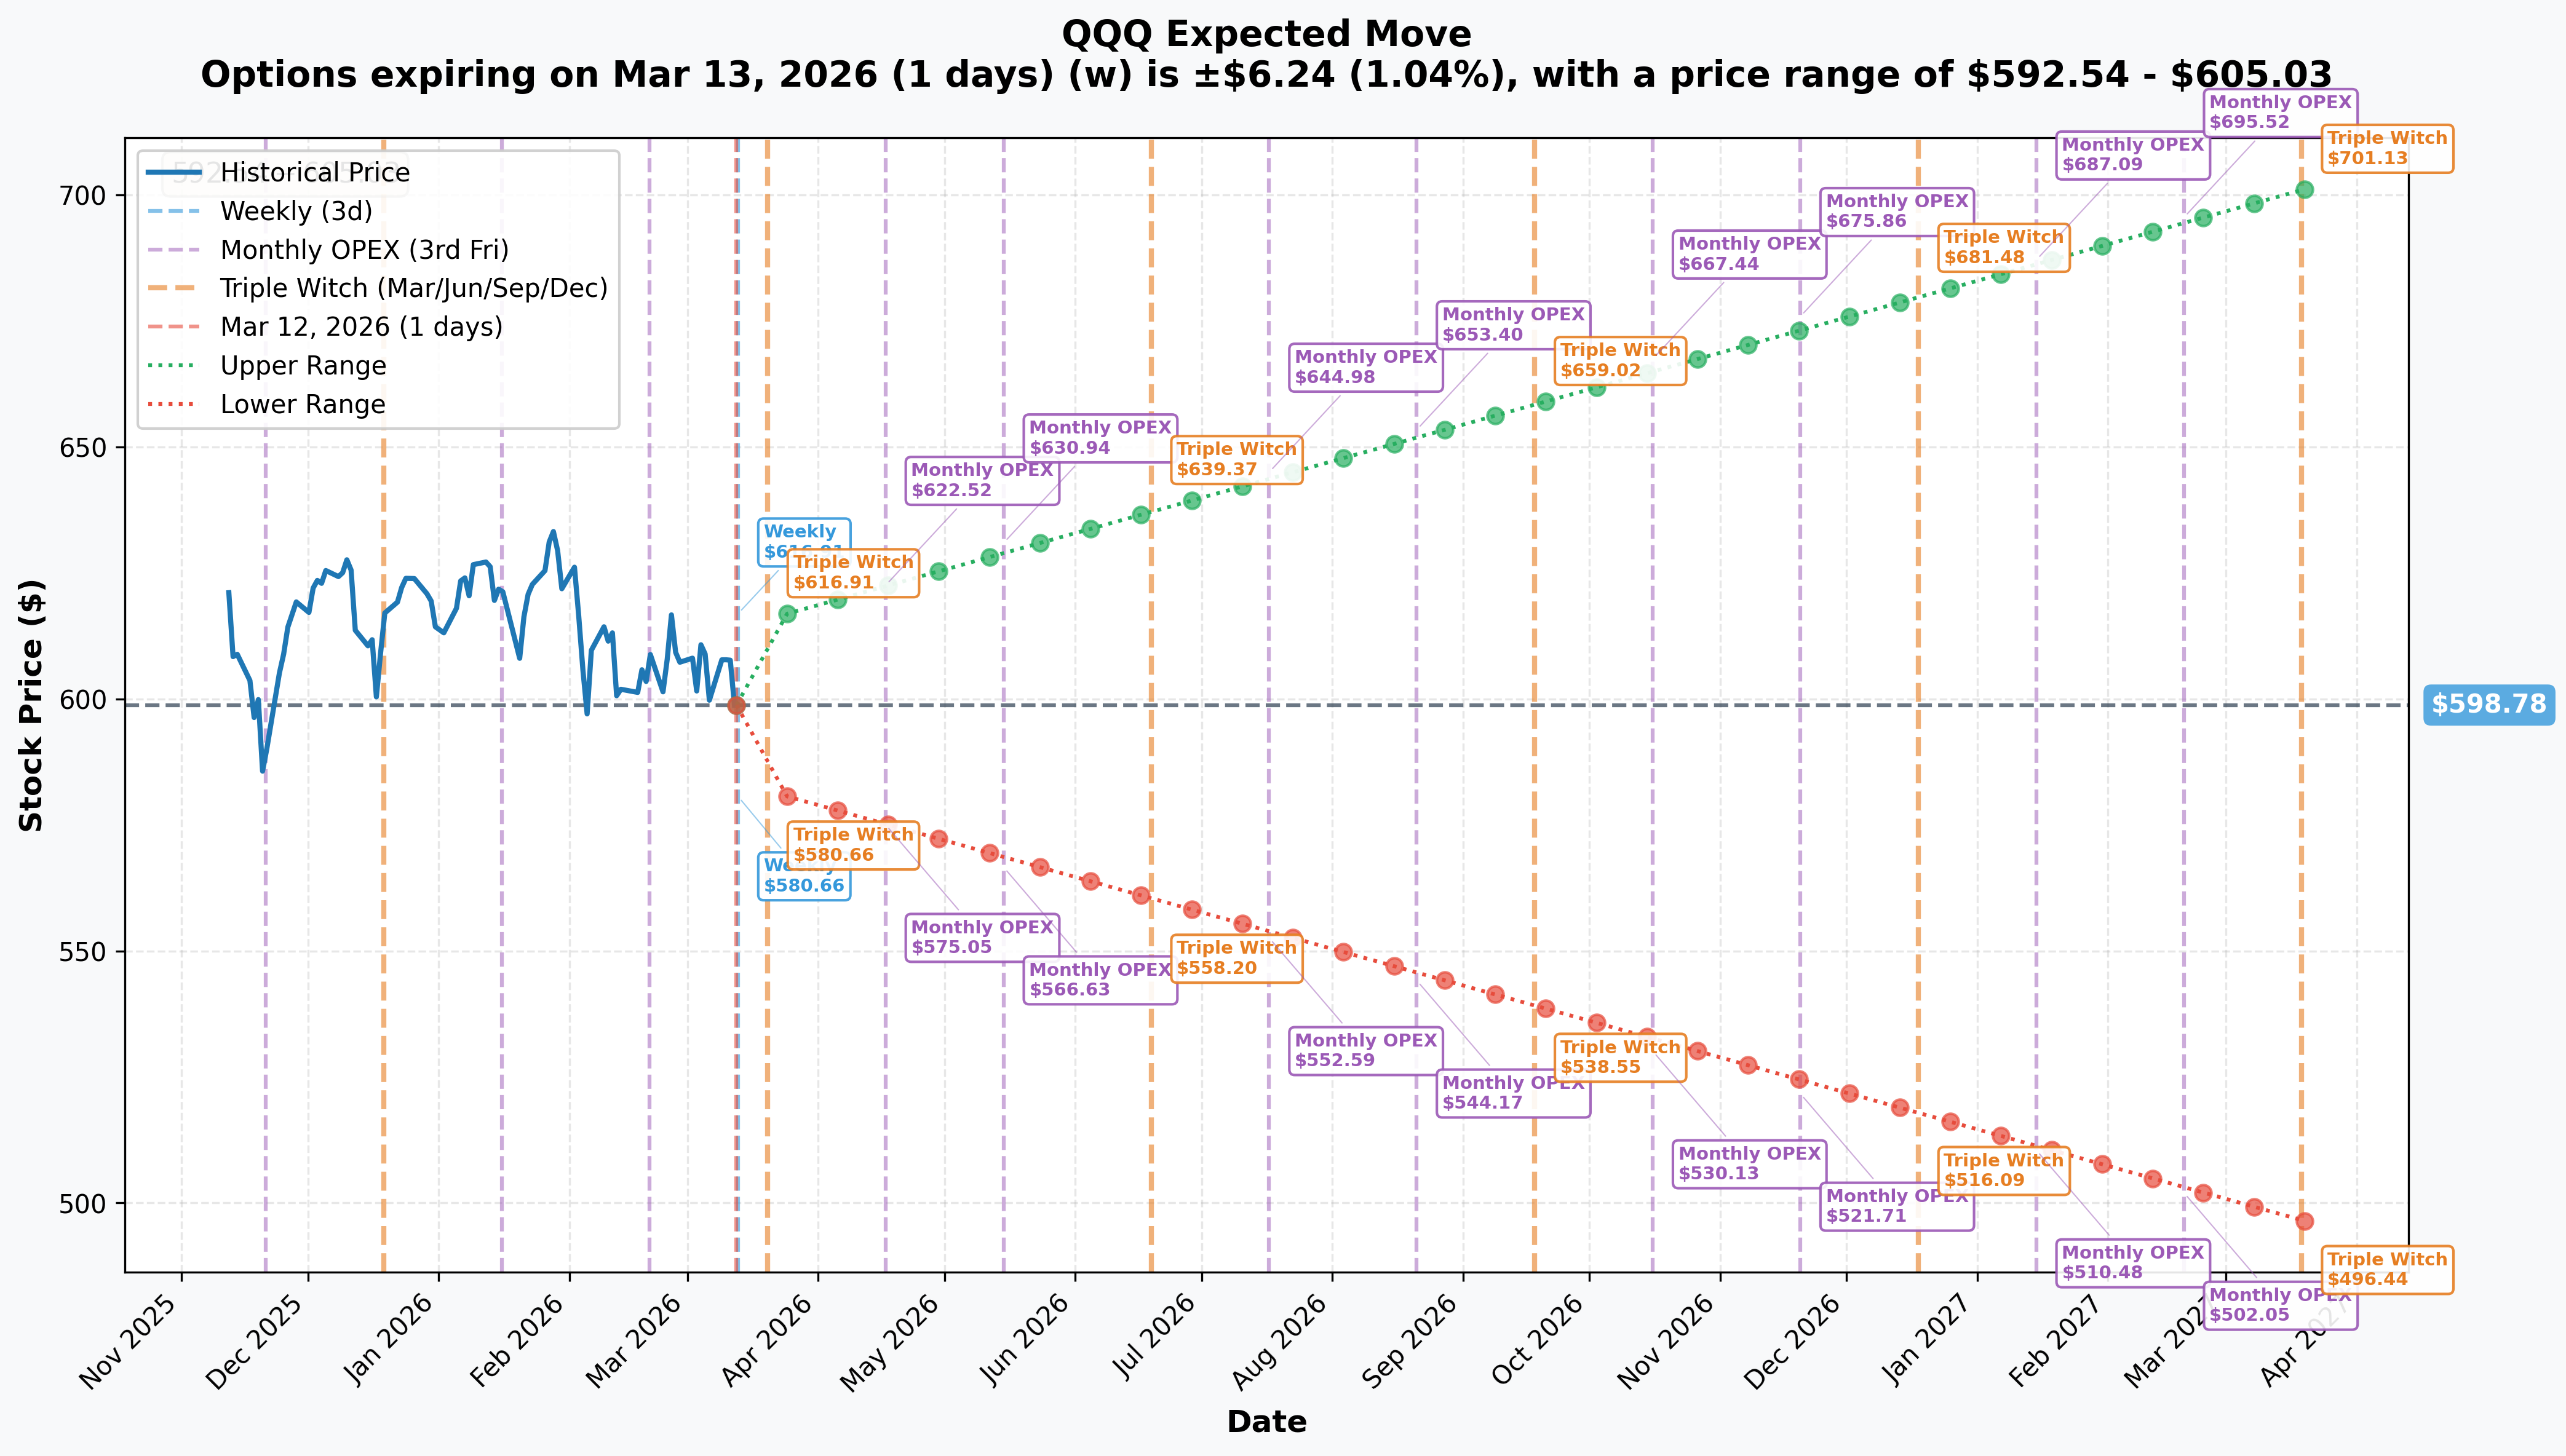
Options market pricing for upcoming expirations:
| Timeframe | Expiry | Days | Implied Move | Range |
|---|---|---|---|---|
| 📅 Weekly | 2026-03-13 | 1 day | ±1.04% / ±$6.24 | $592.54 – $605.03 |
| 📅 Monthly OPEX (Triple Witch) | 2026-03-20 | 8 days | ±2.87% / ±$17.18 | $581.60 – $615.97 |
| 📅 Sep 2026 Triple Witch | 2026-09-18 | ~6 months | ±10.1% / ±$60.47 | $538.55 – $659.02 |
| 📅 Yearly LEAP | 2027-03-19 | 372 days | ±17.09% / ±$102.34 | $496.44 – $701.13 |
What this means:
- For the September 17, 2027 LEAP trade, the implied move framework projects a range of approximately $510–$690 by early 2027 — the $590 strike sits RIGHT in the middle of the realistic downside zone
- The Triple Witch on March 20 (just 8 days away) has a ±$17.18 range — the lower end of $581.60 already puts the $590 strike in play within days
- Options traders are pricing a 17% potential move over the next year — the put buyer is betting they capture a chunk of the downside within their 18-month window
🎪 Catalysts
🔥 Upcoming Catalysts (Next 6 Months — This Is LOADED)
FOMC Meeting — March 17–18, 2026 (6 DAYS AWAY!) 🏦
The Federal Reserve meets March 17–18 with Jerome Powell's press conference at 2:30 PM ET on March 18. Markets assign 92%+ probability of a hold at 3.50%–3.75%. The CRITICAL variable is the updated dot plot — first since December 2025. If the dot plot signals zero cuts in 2026 (due to Iran oil shock inflation), QQQ faces immediate multiple compression. JPMorgan notes this is a binary event for growth tech. The $14M put buyer seems to be positioning AHEAD of this potential shock.
Tesla Q1 2026 Deliveries — ~April 2, 2026 🚗
Tesla (3.97% of QQQ) reports Q1 deliveries around April 2. Any disappointment in Cybercab or EV volume would pressure QQQ's fourth-largest position. TSLA has been among the more volatile contributors to QQQ's recent swings.
Q1 2026 Earnings Season — Late April to Early May (THE MASSIVE ONE) 📊
The most consequential catalyst cluster for QQQ over the next 6 months, representing holdings that total ~27%+ of ETF weight:
| Company | Weight | Expected Date | Key Watch |
|---|---|---|---|
| GOOGL/GOOG | 6.75% | Late April 2026 | Cloud growth vs. $240B backlog; antitrust risk |
| MSFT | 5.86% | Late April 2026 | Azure growth; capacity constraint resolution |
| META | 3.75% | Late April 2026 | $115–135B capex ROI skepticism |
| AMZN | 4.43% | Early May 2026 | AWS growth vs. $200B capex free-cash-flow hit |
| AAPL | 7.51% | Early May 2026 | iPhone demand; AI super-cycle evidence |
| TSLA | 3.97% | ~April 28, 2026 | Cybercab ramp; margin recovery |
Source: Magnificent-7 Earnings Overview — Yahoo Finance
Nvidia Q1 FY2027 Earnings — ~May 20, 2026 🔥
NVDA (8.81% of QQQ) must deliver on its $78 billion guidance — the most important number in AI. Any miss, export control escalation, or weakening demand signal could trigger a broad QQQ drawdown given NVDA is the single largest holding. This is the put trade's single most dangerous catalyst.
FOMC May 6–7 and June 17–18 — Additional Rate Decisions 📅
Two more FOMC meetings within the trade window. June has a 43% market-implied probability of a 25bp cut — bullish if it happens, but the May meeting will digest the first CPI prints capturing Iran oil shock pass-through. Cuts = bad for this put trade; no cuts = helps it.
Apple WWDC 2026 — June 2026 🍎
Apple (7.51% of QQQ) showcases next-generation Apple Intelligence features. A strong AI / iOS 20 announcement could boost QQQ's biggest tech holding and compress the put's value.
📰 Recent Catalysts (Last 3 Months — What We Know)
U.S.–Iran Military Conflict — February 28, 2026 (Ongoing) ⚠️
The U.S. and Israel launched coordinated strikes against Iran (Operation Epic Fury), sending crude oil above $110/barrel on Strait of Hormuz disruption fears. The Dow tumbled 800 points in its worst session on March 5. Elevated oil directly feeds inflation expectations, constraining Fed flexibility and raising the discount rate on all those high-multiple tech names. Morgan Stanley specifically called this out as a risk to tech valuations. This is arguably the single biggest macro tailwind behind this put trade.
February CPI — Released March 11, 2026 📊
CPI came in at 2.4% (in line) and core at 2.5%. No shock — but crucially, this data does NOT yet capture the Iran oil pass-through. March and April CPI prints (releasing in April and May) could be the bombshells that shift the dot plot hawkish. The put buyer knows this.
DeepSeek AI Selloff — Late January 2026 🤖
DeepSeek's R1 model caused Nasdaq-100 to drop 3.6% in a single session as questions emerged about whether U.S. hyperscalers were overspending on AI infrastructure. Nvidia lost $600B in market cap in one day. While markets recovered, the underlying question about AI capex ROI has NOT been resolved — it's a slow-burning structural risk embedded in QQQ.
Record AI Earnings Beats (Dec 2025 – March 2026) ✅
Every major QQQ holding crushed Q4 expectations. NVDA: $68B revenue, +65% YoY. AAPL: $143.8B, +16% YoY. MSFT: Azure +39%. AMZN: AWS +24%. GOOGL: Cloud +48%. Hyperscalers committed $635–$665B combined capex for 2026. The fundamental story is STRONG — which makes paying for 18 months of downside protection very deliberate.
🎲 Price Targets & Probabilities
Using gamma levels, implied move data, catalyst timing, and the macro backdrop:
📈 Bull Case (30% probability)
Target: $630–$660 by September 2027
How we get there:
- ✅ FOMC dot plot on March 18 signals two 2026 cuts, sending tech multiples higher immediately
- 🚀 Iran conflict de-escalates by Q2, oil falls back below $85, inflation risk fades
- 💪 Nvidia delivers on $78B Q1 FY2027 guidance AND raises, validating the AI supercycle
- 💰 Hyperscaler $635–$665B capex commitment translates into tangible AI revenue growth at Mag-7 earnings
- 📊 Google antitrust case settles without structural break-up
- 🎯 QQQ reclaims ATH of $637 and extends toward $660
For the put buyer: Their $14M is essentially a total loss. The position decays as QQQ rallies far away from the $590 strike.
Why only 30%: Multiple macro headwinds (oil, rates, antitrust, DeepSeek) must all resolve favorably simultaneously. The put buyer clearly doesn't think this is the most likely outcome.
🎯 Base Case (40% probability)
Target: $570–$620 (QQQ chops sideways/grinds lower)
Most likely scenario:
- ⚖️ FOMC holds on March 18 with unchanged dot plot (1 cut in 2026), market reaction muted
- 📊 Q1 2026 Mag-7 earnings are OK but capex guides pressure sentiment — Barclays estimates Meta FCF falls 90% from capex levels
- 🛢️ Oil stays $90–$110, CPI drifts up in April–May readings — no cuts materializing
- ❌ QQQ fails repeatedly to break above the $599–$600 gamma wall (33,817 GEX ceiling)
- 📉 Index drifts in the $570–$610 range through mid-2026, breaking down further by year-end
- 🎯 Eventually tests $590 gamma support — the put strike is IN THE MONEY by late 2026
For the put buyer: This is where the trade starts working. The $590 puts gain value as QQQ grinds toward the strike. By September 2027 expiration, a QQQ level of $550–$570 turns this into a solid 2–4x return on the $55.20 paid.
📉 Bear Case (30% probability)
Target: $490–$540 (Multi-Sigma Tech Selloff)
What could go wrong — fast:
- 🚨 Iran oil shock CPI prints (March–April) force the Fed to threaten a HIKE, nuking tech multiples
- 💥 Nvidia Q1 FY2027 misses its $78B guide due to China H20 export controls spreading to Blackwell-class chips — 8.81% of QQQ craters
- ⚖️ Google antitrust remedies order breaks up Google's ad tech — immediate 10–20% GOOGL drop hits QQQ by 0.7–1.4 percentage points on holding-weight alone
- 🤖 DeepSeek follow-on model renders GPT-5 and Gemini 2.0 obsolete — AI capex thesis unravels
- 📉 QQQ breaks through $580, then $570 support — cascade toward implied move lower bound of $496
- 🎢 Global GDP projected at only 0.4% growth in 2026 — tariff-induced consumer slowdown finally bites
Critical support levels to watch:
- 🛡️ $598 — Immediate gamma support (110.97 GEX) — first line of defense, minor
- 🛡️ $595 — Secondary support (127.27 GEX) — more meaningful
- 🛡️ $590 — Major gamma level (183.02 GEX) + this put strike — KEY LINE IN THE SAND
- 🛡️ $580 — Extended support (118.64 GEX) — if this breaks, $570 next
- 🛡️ $570 — Deeper support (106.45 GEX) — panic territory
Put P&L in Bear Case:
- QQQ at $550 on Sept 17, 2027: Puts worth ~$40, return = +$84M on $14M invested (~5x!)
- QQQ at $520 on Sept 17, 2027: Puts worth ~$70, return = +$161M (~11x!)
- QQQ at $590 on Sept 17, 2027: Puts expire at-the-money, loss ≈ −$14M (−100%)
💡 Trading Ideas
🛡️ Conservative: Wait and Watch the $590 Strike Test
Play: Do nothing yet — monitor whether QQQ breaks below the $598/$595 gamma support staircase this week
Why this works:
- 🎯 The $599 wall (33,817 GEX) is a mechanical ceiling right above current price — QQQ needs a serious catalyst to push higher
- ⏰ FOMC on March 18 is 6 days away — the dot plot could be the trigger for the next big move either direction
- 📊 If you already hold QQQ: Consider buying a defined-risk hedge — one March 20 put spread (buy $595/sell $580) for a small premium as FOMC insurance. Costs maybe $2–4 per spread, limits risk to defined premium
- 🔑 Entry trigger: Only enter bearish positions if QQQ breaks below $595 on volume — that confirms the $590 level is in play
Risk level: Low | Skill level: Beginner-friendly | Cost: Minimal (waiting is free!)
Expected outcome: Either FOMC is benign and QQQ bounces (no harm done), or the dot plot shocks hawkish and you enter bearish with confirmation rather than anticipation.
⚖️ Balanced: Medium-Term Put Spread Riding the Macro Narrative
Play: Buy a QQQ put spread targeting the $590–$570 zone through the June 2026 triple witch
Structure: Buy the June 19 $595 put + Sell the June 19 $570 put
Why this works:
- 💰 Defined risk ($25 wide spread = max $2,500 risk per contract) — you know EXACTLY what you can lose
- 📊 Captures the Iran inflation → hawkish FOMC → multiple compression chain of events
- 🎯 June 2026 window captures: March FOMC dot plot, April–May CPI oil-shock reads, and full Mag-7 Q1 earnings season — ALL the macro landmines
- ⚖️ Selling the $570 put finances the trade — you're not betting on a crash, just a controlled pullback to gamma support levels that already exist
Rough P&L estimate:
- 💸 Net debit: ~$6–9 (based on current IV levels)
- 📈 Max profit: ~$16–19 if QQQ is below $570 at June 19 expiration (~2–3x return)
- 📉 Max loss: Net debit paid (~$600–900 per spread)
- 🎯 Breakeven: ~$586–589 (right at the $590 gamma level)
Position sizing: Risk 2–4% of portfolio maximum. This is directional speculation, not hedging.
Risk level: Moderate | Skill level: Intermediate | Timing: Enter after FOMC clarity on March 18
🚀 Aggressive: Copy The Whale — Scaled-Down LEAP Put Position
Play: Buy 1–5 QQQ September 2027 $590 or $580 LEAP puts — a retail-scaled version of the exact $14M trade
Structure: Buy 1–5 contracts of the QQQ September 17, 2027 $590 put
Why this could work:
- 🐋 You're literally copying a 2,500-contract institutional LEAP put trade — same strike, same expiry
- ⏰ 18 months of time gives the macro thesis (inflation → no cuts → tech multiple compression) room to play out
- 📊 The $590 strike is at a MAJOR gamma node (183 GEX) — the market already watches this level
- 💥 If QQQ falls to $540 by Sept 2027, a $590 put purchased at ~$55 could be worth $50 in intrinsic alone — plus remaining time value. Potential 2–3x return
- 🎲 Vol/OI of 22.9x confirms this was a brand-new institutional position — you're getting in near the same price
Real P&L (1 contract = $5,520 cost):
- QQQ at $550 at expiry: Put worth ~$40 intrinsic → loss of ~$1,520 (~27% loss — not great, but manageable)
- QQQ at $530 at expiry: Put worth ~$60 → gain of ~$480 (8% gain — modest)
- QQQ at $490 at expiry: Put worth ~$100 → gain of ~$4,480 (~81% gain)
- QQQ at $600+ at expiry: Put expires near worthless → loss of full ~$5,520 (100% loss)
SERIOUS WARNINGS:
- ⚠️ LEAP puts decay slowly but surely — theta is your enemy every single day you hold
- ⚠️ If QQQ rallies to $640+ in the next 6 months, your put loses 60–70% of value fast
- ⚠️ $55.20 is NOT cheap — you need a REAL move down, not just a dip
- ⚠️ Only attempt if you can AFFORD to lose the entire premium — this is NOT a hedge for most retail traders
Risk level: HIGH (can lose 100% of premium) | Skill level: Advanced only | Max allocation: 1–2% of portfolio
⚠️ Risk Factors
Every trade has landmines — here are QQQ's:
-
🕊️ Iran conflict de-escalation is the bull's best friend: If U.S.–Iran tensions ease and oil drops back below $85, the inflation scare fades, rate cuts return to the calendar, and QQQ could rip back toward $637. The put becomes a costly, slowly decaying position.
-
📈 Nvidia is 8.81% of QQQ — and it's on a tear: NVDA guided Q1 FY2027 to $78B revenue — if they deliver and raise AGAIN in May, the AI supercycle narrative roars back and drags QQQ higher, crushing this put.
-
💸 $635–$665B hyperscaler capex is real money flowing to QQQ's semiconductor holdings: Amazon ($200B), Alphabet ($175–185B), Microsoft ($145B), and Meta ($115–135B) are all spending at record levels to build AI infrastructure. That money flows to Nvidia, Broadcom, and AMD — all inside QQQ.
-
⚖️ Valuation matters, but QQQ has held up: With analyst consensus targets at $756.59 (+26.5% upside) and every major holding beating earnings this cycle, the fundamental case isn't broken — it's just expensive.
-
🌍 Tariffs are a slow burn, not a sudden shock: The 10% global tariff and 145% China rate are already baked into guidance. The U.S.–Taiwan framework (tariffs cut from 20% to 15%) even provided a partial positive for semiconductor supply chains.
-
⏰ Time decay on this put is relentless: At 18 months, daily theta costs aren't catastrophic — but if QQQ stays range-bound at $590–$620 for the next 6 months, the put still loses value every single day.
-
🤔 This COULD be a hedge, not a directional bet: The entity who bought 2,500 contracts may hold $150M+ in QQQ and is simply paying $14M as insurance — the equivalent of 9.2% annual "option premium" to protect a massive position. If the hedge purpose is protection rather than speculation, the trade can expire worthless and still be a "win" for the hedger.
🎯 The Bottom Line
Real talk: When someone writes a $14 million check for an 18-month LEAP put on the world's most liquid tech ETF, they are not doing it lightly. The Vol/OI ratio of 22.9x confirms this is a brand new position — not rolling, not closing — someone OPENED this trade TODAY with full conviction.
What this trade is telling us:
- 🎯 Sophisticated player is paying for protection (or a bearish bet) through September 17, 2027 — capturing the full 2026 macro cycle, 4 earnings seasons, multiple FOMC meetings, Iran conflict resolution (or escalation), and whatever AI capex ROI reality looks like by mid-2027
- ⚖️ At $590 strike against $600.34 spot, they're paying FULL volatility premium — this is not cheap disaster insurance. This is deliberate, near-the-money bearish positioning
- 🐋 The $599 gamma wall sitting just $0.05 above current price (33,817 total GEX — 97% put-driven) validates the concern: the entire options market is deeply bearish QQQ right here
- 📊 The 10-year Treasury at 4.24%, Iran-driven oil above $110, and DeepSeek's ongoing AI disruption threat aren't going away by next week
Three scenarios for YOUR portfolio:
If you own QQQ:
- ✅ Consider trimming 15–25% at current levels ($598–$605) — lock in some of the 1-year +27.78% gain
- 📊 Set a mental stop at $590 — the gamma support level and where the whale struck. Break below with volume = danger zone
- ⏰ FOMC March 18 dot plot is the next binary event — own less going in if you're nervous
If you're watching:
- 👀 March 18 FOMC is your first major decision point — the dot plot will set the tone
- 🎯 A post-FOMC pullback to $580–$590 gamma support would be a more attractive entry for longs — better risk/reward than buying today at the $599 ceiling
- 📊 Watch for Nvidia (May ~20) — if NVDA crushes earnings again, QQQ reclaims $620+ and this whole bearish setup resets
If you're bearish:
- 🎯 The June put spread (buy $595/sell $570) offers defined risk with real upside potential
- 📅 Mark your calendars: March 18 (FOMC), Late April (Mag-7 earnings wave), May 20 (Nvidia)
- ⚠️ Don't chase the exact LEAP put unless you understand time decay and can hold through a 40–60% mark-to-market drawdown
Final verdict: QQQ's AI story is real — but so is the $110/barrel oil, the 4.24% 10-year yield, the AI capex ROI question, and the 33:1 bearish gamma bias sitting right above current price. Someone with serious resources just bet $14M that 18 months is enough time for at least one of these risk factors to crack the Nasdaq. The $599 put gamma wall is the market's report card on this view — and it's grading the bears an A.
This put trade deserves respect. Stay hedged, stay informed, and don't get caught without a plan when the catalysts start firing. 💪
⚠️ Disclaimer: Options trading involves substantial risk of loss and is not suitable for all investors. This analysis is for educational and informational purposes only and does not constitute financial advice or a recommendation to buy or sell any security. Past performance does not guarantee future results. LEAP options can lose their entire value if the underlying ETF moves against the position or remains range-bound through expiration. The unusual activity described reflects a single institutional transaction and may represent hedging rather than directional speculation — the trader's intent and portfolio context are unknown to retail observers. The Vol/OI ratio of 22.9x reflects the specific size of this trade relative to existing open interest at this strike, not a forward probability of profit. Always conduct your own research and consider consulting a licensed financial advisor before making investment decisions. QQQ option liquidity is generally strong, but LEAP strikes may have wider bid-ask spreads. Position sizing should account for the possibility of total premium loss.
About Invesco QQQ Trust: The QQQ ETF tracks the Nasdaq-100 Index, providing concentrated exposure to the 100 largest non-financial companies listed on the Nasdaq Stock Market. With ~$392.6 billion in AUM and approximately 50% technology sector weighting, QQQ is the dominant vehicle for institutional and retail investors seeking leveraged access to U.S. large-cap tech and growth companies. Top holdings include NVDA (8.81%), AAPL (7.51%), MSFT (5.86%), AMZN (4.43%), and TSLA (3.97%).