🐻 SMH $5.3M Bearish Blitz — Whales Are Hedging the Semiconductor Supercycle Hard!
📅 March 26, 2026 | 🔥 Unusual Activity Detected
🎯 The Quick Take
Someone just dropped $5.3 MILLION in pure bearish bets on the semiconductor sector, deploying a near-term put AND a classic collar structure on SMH — all in a single morning. This isn't panic selling from a retail trader; this is a coordinated, institutional-grade strategy that caps upside at $410 while paying heavily to protect against a drop below $380 by May, with an extra near-term put at $367.50 that expires in just 22 days. With SMH down 6.4% in the past week and tariff risk back in the headlines, big money is locking in downside protection at scale.
📊 ETF Overview
VanEck Semiconductor ETF (SMH) is the go-to ETF for semiconductor exposure:
- 💻 What it holds: Top 25 global semiconductor stocks — NVIDIA, TSMC, Broadcom, ASML, Micron
- 💰 AUM: $43.89 billion
- 📈 YTD Performance: +12.9% (as of March 26, 2026)
- 📉 Recent trouble: Fell 6.4% in the week ending ~March 21 — its worst weekly drop since the Liberation Day tariffs of spring 2025
- 🏢 Exchange: NASDAQ
- 🎯 Top 5 Holdings: NVDA (19.4%), TSM (11.6%), AVGO (7.9%), ASML (5.1%), MU (5.0%)
- 📊 Analyst Consensus: Strong Buy — average 12-month target $507.51 (~30% upside to current price)
💰 The Option Flow Breakdown
📊 The Tape
Order Type: Mixed (BTO Standalone + Collar) | Strategy: Near-Term Put + Protective Collar (Bearish Hedge)
| Time | Symbol | Side | Buy/Sell | Call/Put | Strike | Vol | OI | Exp | Size | Premium | Spot | Option Price | Option Symbol |
|---|---|---|---|---|---|---|---|---|---|---|---|---|---|
| 09:46:35 | SMH | MID | BUY | PUT | $367.50 | 2,000 | 18 | 2026-04-17 | 1,365 | $1.1M | $390.82 | $7.91 | SMH20260417P367 |
| 10:36:12 | SMH | MID | SELL | CALL | $410 | 1,400 | 1,300 | 2026-05-15 | 1,249 | $1.9M | $389.68 | $14.83 | SMH20260515C410 |
| 10:36:12 | SMH | MID | BUY | PUT | $380 | 1,500 | 1,300 | 2026-05-15 | 1,249 | $2.3M | $389.78 | $18.52 | SMH20260515P380 |
Total Premium Deployed: $5.3M
🤓 What This Actually Means
Let me break this down in plain English:
Trade 1 — The Near-Term Panic Button (BTO Standalone Put)
- 💸 $1.1M on puts expiring April 17, 2026 — just 22 days away
- 📉 Strike $367.50 is 6% below current price ($390.82 spot) — needs a meaningful drop fast
- 📊 Vol/OI ratio = 111x — there were only 18 contracts of open interest when 2,000 contracts traded. That is 111 times the normal activity. We see this kind of ratio a handful of times a year in a single strike. This is a fresh position, not a hedge rolling from something older.
- ⏰ Breakeven at expiration: ~$359.59 ($367.50 strike - $7.91 premium) — needs SMH to fall 7.8% in 22 days
- 🎯 This is a near-term directional bet — expecting a fast selloff before April 17 OPEX
Trades 2 + 3 — The Collar (STO Call + BTO Put, same size/time)
- 🔒 These two trades executed at the exact same timestamp and size (1,249 contracts each) — this is a textbook COLLAR structure
- 📉 Sell the $410 call (collect $1.9M) — caps upside at $410, says "I don't think we're rallying 5% from here by May 15"
- 🛡️ Buy the $380 put (pay $2.3M) — protects against a drop below $380 ($389.78 spot), so downside is hedged starting at -2.5% from here
- 💰 Net cost of the collar: ~$400K ($2.3M - $1.9M) — nearly a net-zero cost hedge structure
- 📊 Z-scores: 15.03 and 12.43 — both flagged EXTREMELY UNUSUAL. Activity this far above the statistical average occurs very rarely — this is institutional size entering a fresh position, not routine flow.
- 🎯 What this collar says: "I own or am long SMH, I think it goes sideways-to-down by May 15, and I'm willing to cap my upside at $410 in exchange for downside protection from $380"
The Big Picture:
Real talk — this is institutional money running a two-pronged bear strategy:
- A short-dated tactical put in case things break down fast heading into April OPEX
- A longer-dated collar capping upside while paying for protection below $380 into May
The total $5.3M spent isn't all directional premium — the collar is nearly self-financing. But the net message is unmistakably bearish: this trader is not positioned for a semiconductor rally.
📈 Technical Setup / Chart Check-Up
YTD Performance
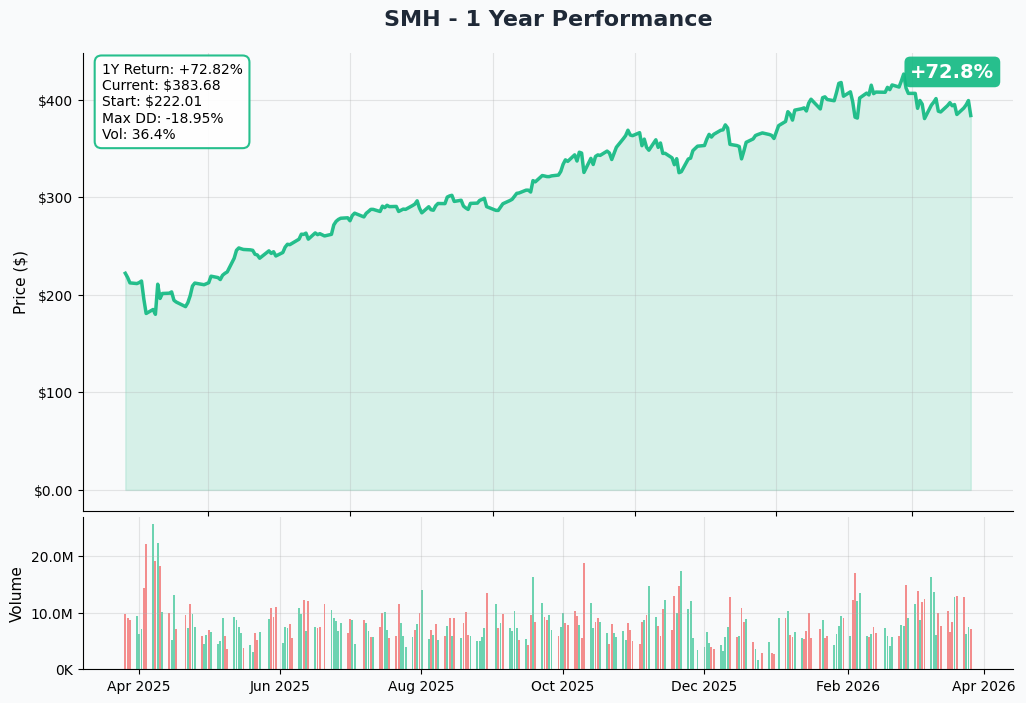
SMH is up +12.9% YTD but the recent action tells a different story from the headline number:
- 🚀 Strong Q1 run: SMH surged in early 2026 on record earnings from NVIDIA, TSMC, and Broadcom fueling optimism
- 📉 Brutal week: Fell 6.4% in the week ending March 21 — the worst weekly drop since the Liberation Day tariff shock of spring 2025
- 🎢 Currently at ~$384 — bouncing off recent lows but momentum is clearly stalling
- 📊 Down from recent highs of ~$430+ — the ETF has given back a significant chunk of its gains
- ⚠️ Pattern: Every tariff headline is now a sell trigger for semiconductors, and the options market is reflecting that fear
Gamma-Based Support & Resistance Analysis
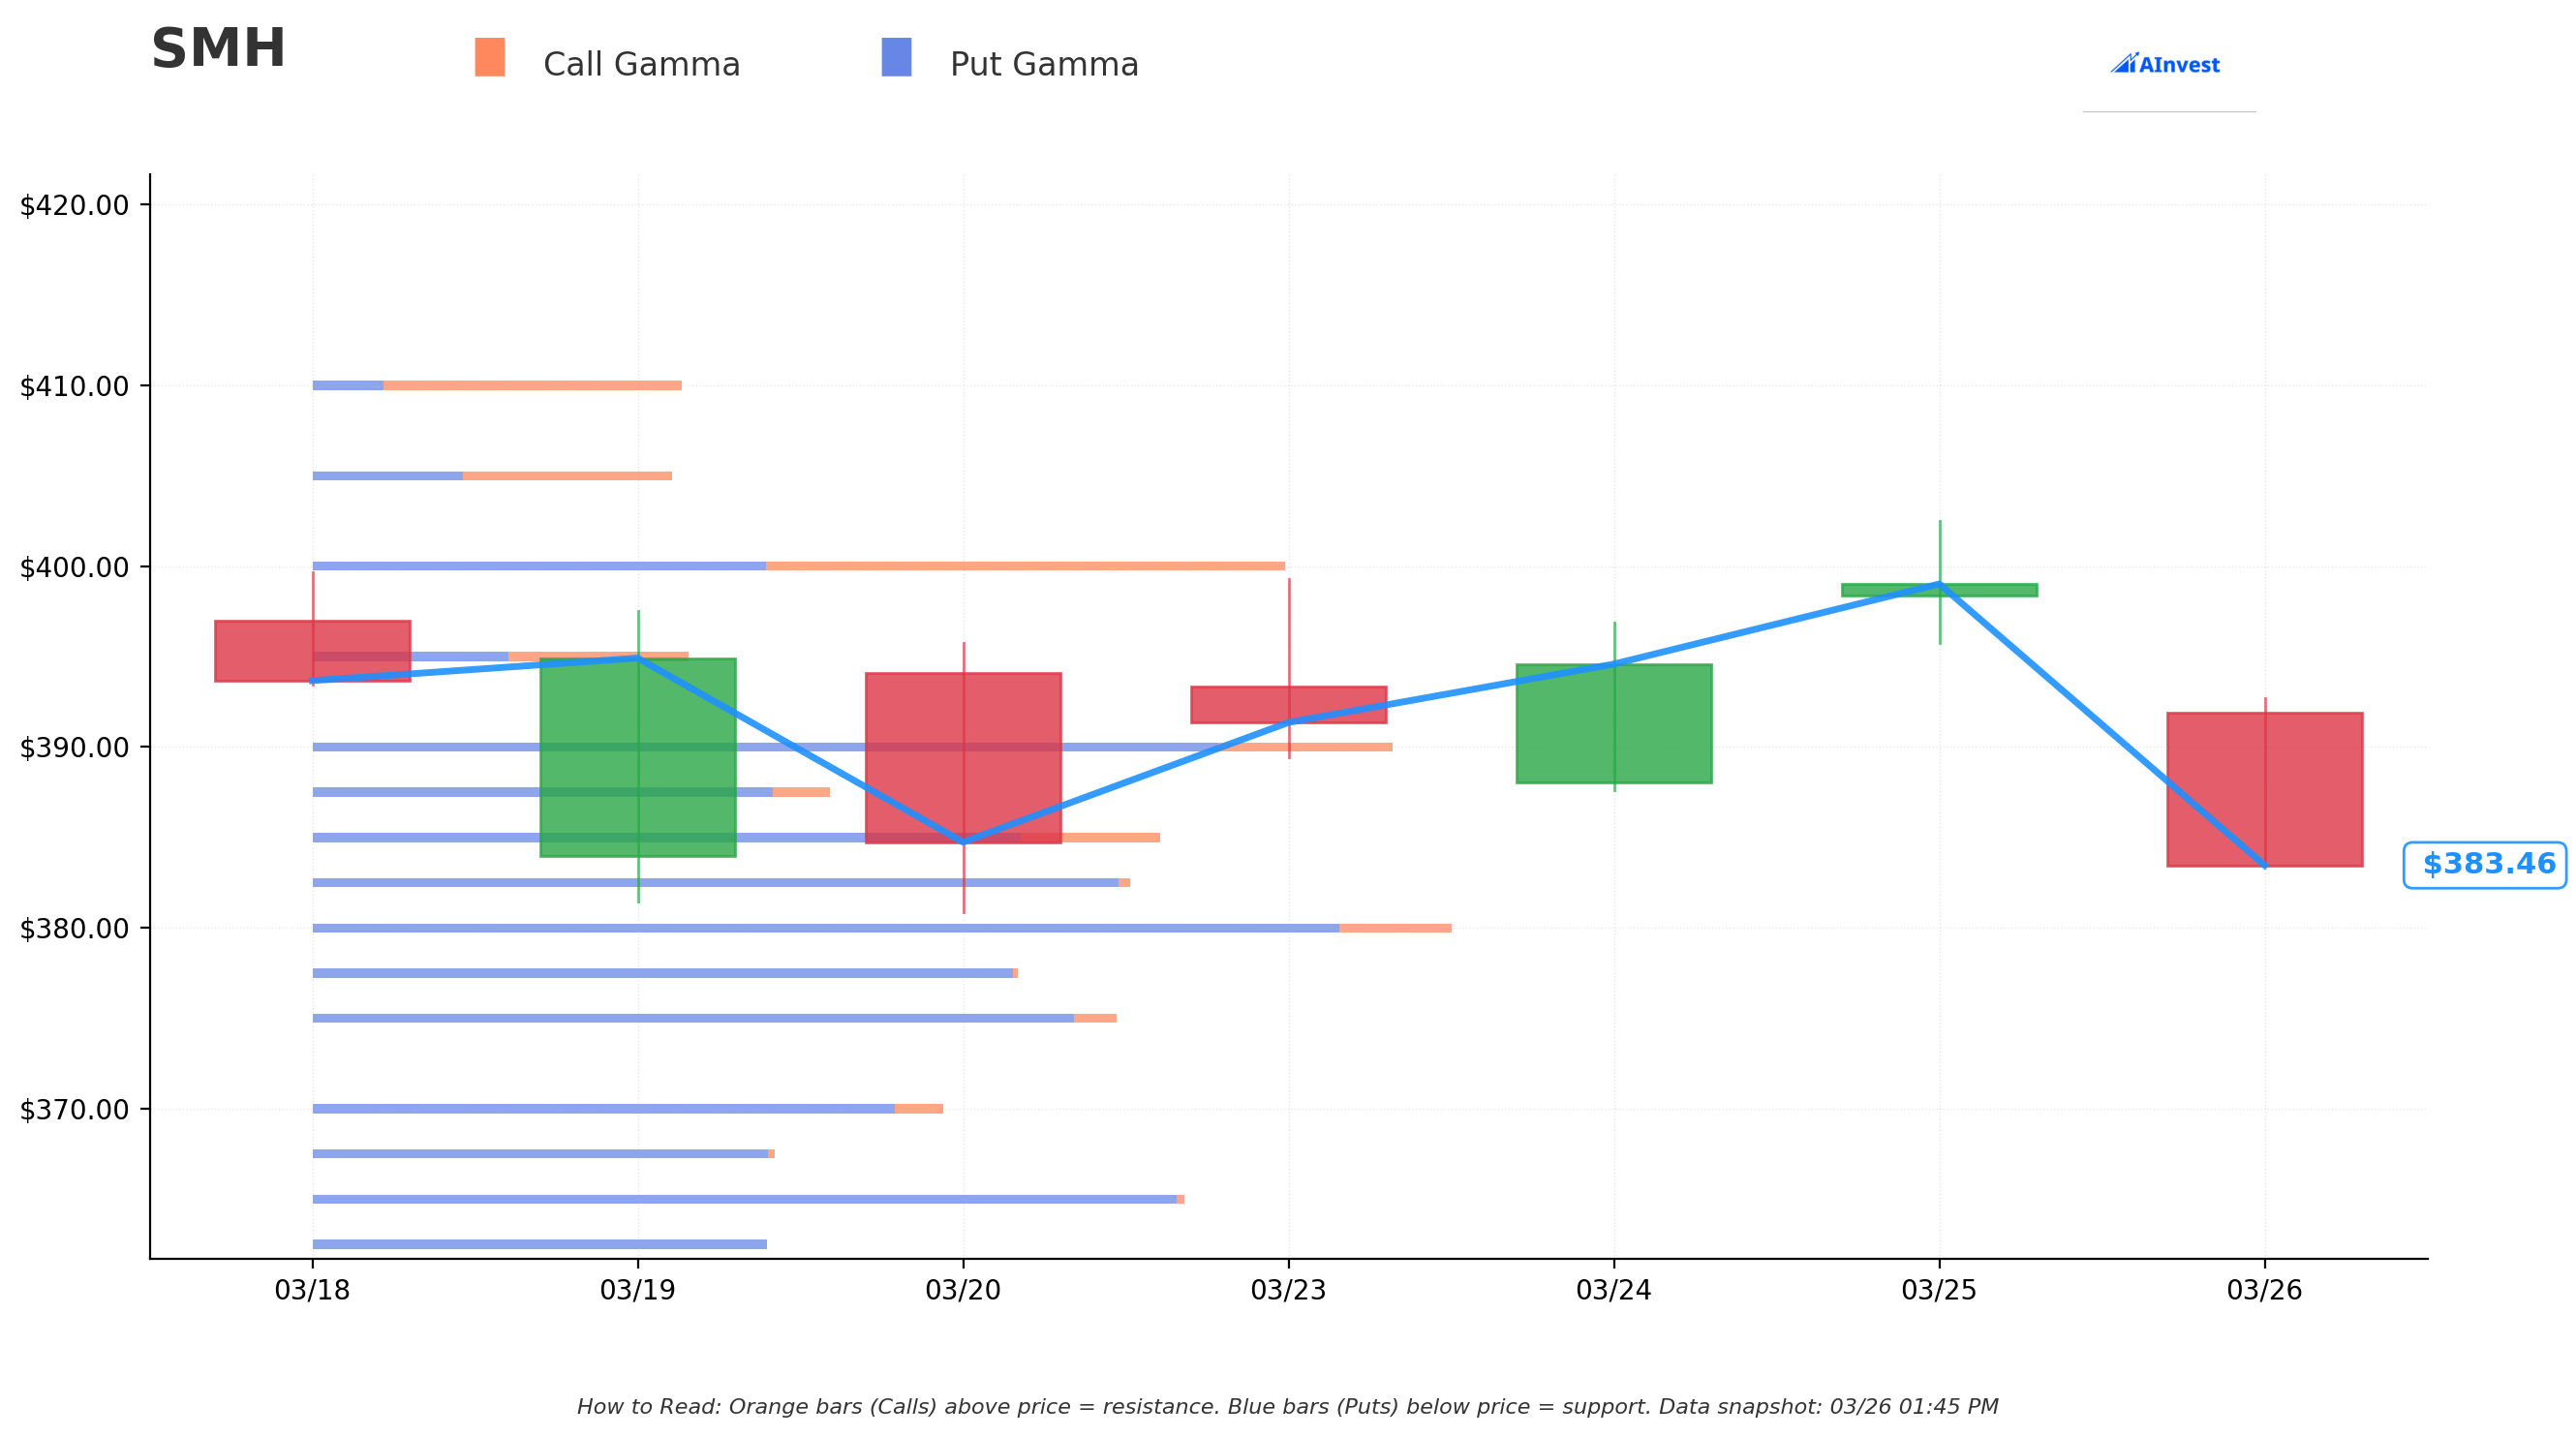
Current Price: ~$383-$391 (intraday range March 26)
The gamma exposure map tells us where options market makers have concentrated positions. Think of these levels as price magnets — stocks tend to get "pinned" near high-gamma strikes and can gap through low-gamma zones.
🔵 Support Levels (Put Gamma = Cushion Below Price):
| Strike | Total GEX | Distance from Price |
|---|---|---|
| $382.50 | 9.56B | 0.2% below — first floor, very close |
| $380.00 | 13.56B | 0.9% below — strongest support nearby |
| $377.50 | 8.36B | 1.5% below |
| $375.00 | 9.58B | 2.2% below |
| $370.00 | 7.53B | 3.5% below |
| $365.00 | 10.46B | 4.8% below — deep support, second strongest overall |
| $360.00 | 8.49B | 6.1% below |
🟠 Resistance Levels (Call Gamma = Ceiling Above Price):
| Strike | Total GEX | Distance from Price |
|---|---|---|
| $385.00 | 10.17B | 0.4% above — first ceiling, very close |
| $390.00 | 12.70B | 1.7% above — strongest resistance |
| $400.00 | 11.54B | 4.3% above |
What this means for traders:
SMH is sandwiched in a tight range. The $382.50-$385 zone is where the battleground is — support and resistance are practically on top of each other. The $390 resistance is the key level to watch: if SMH can't reclaim and hold $390, the path of least resistance is toward $380 and below, which is exactly what these traders are betting on.
Net GEX Bias: Bearish — overall dealer positioning across all strikes is tilted bearish, meaning market makers may sell into rallies and the ETF could struggle to hold ground above $385-$390.
The big collar trades today put the $380 strike squarely at the strongest gamma support level. That's not a coincidence — this trader knows exactly where the floor is priced.
Implied Move Analysis
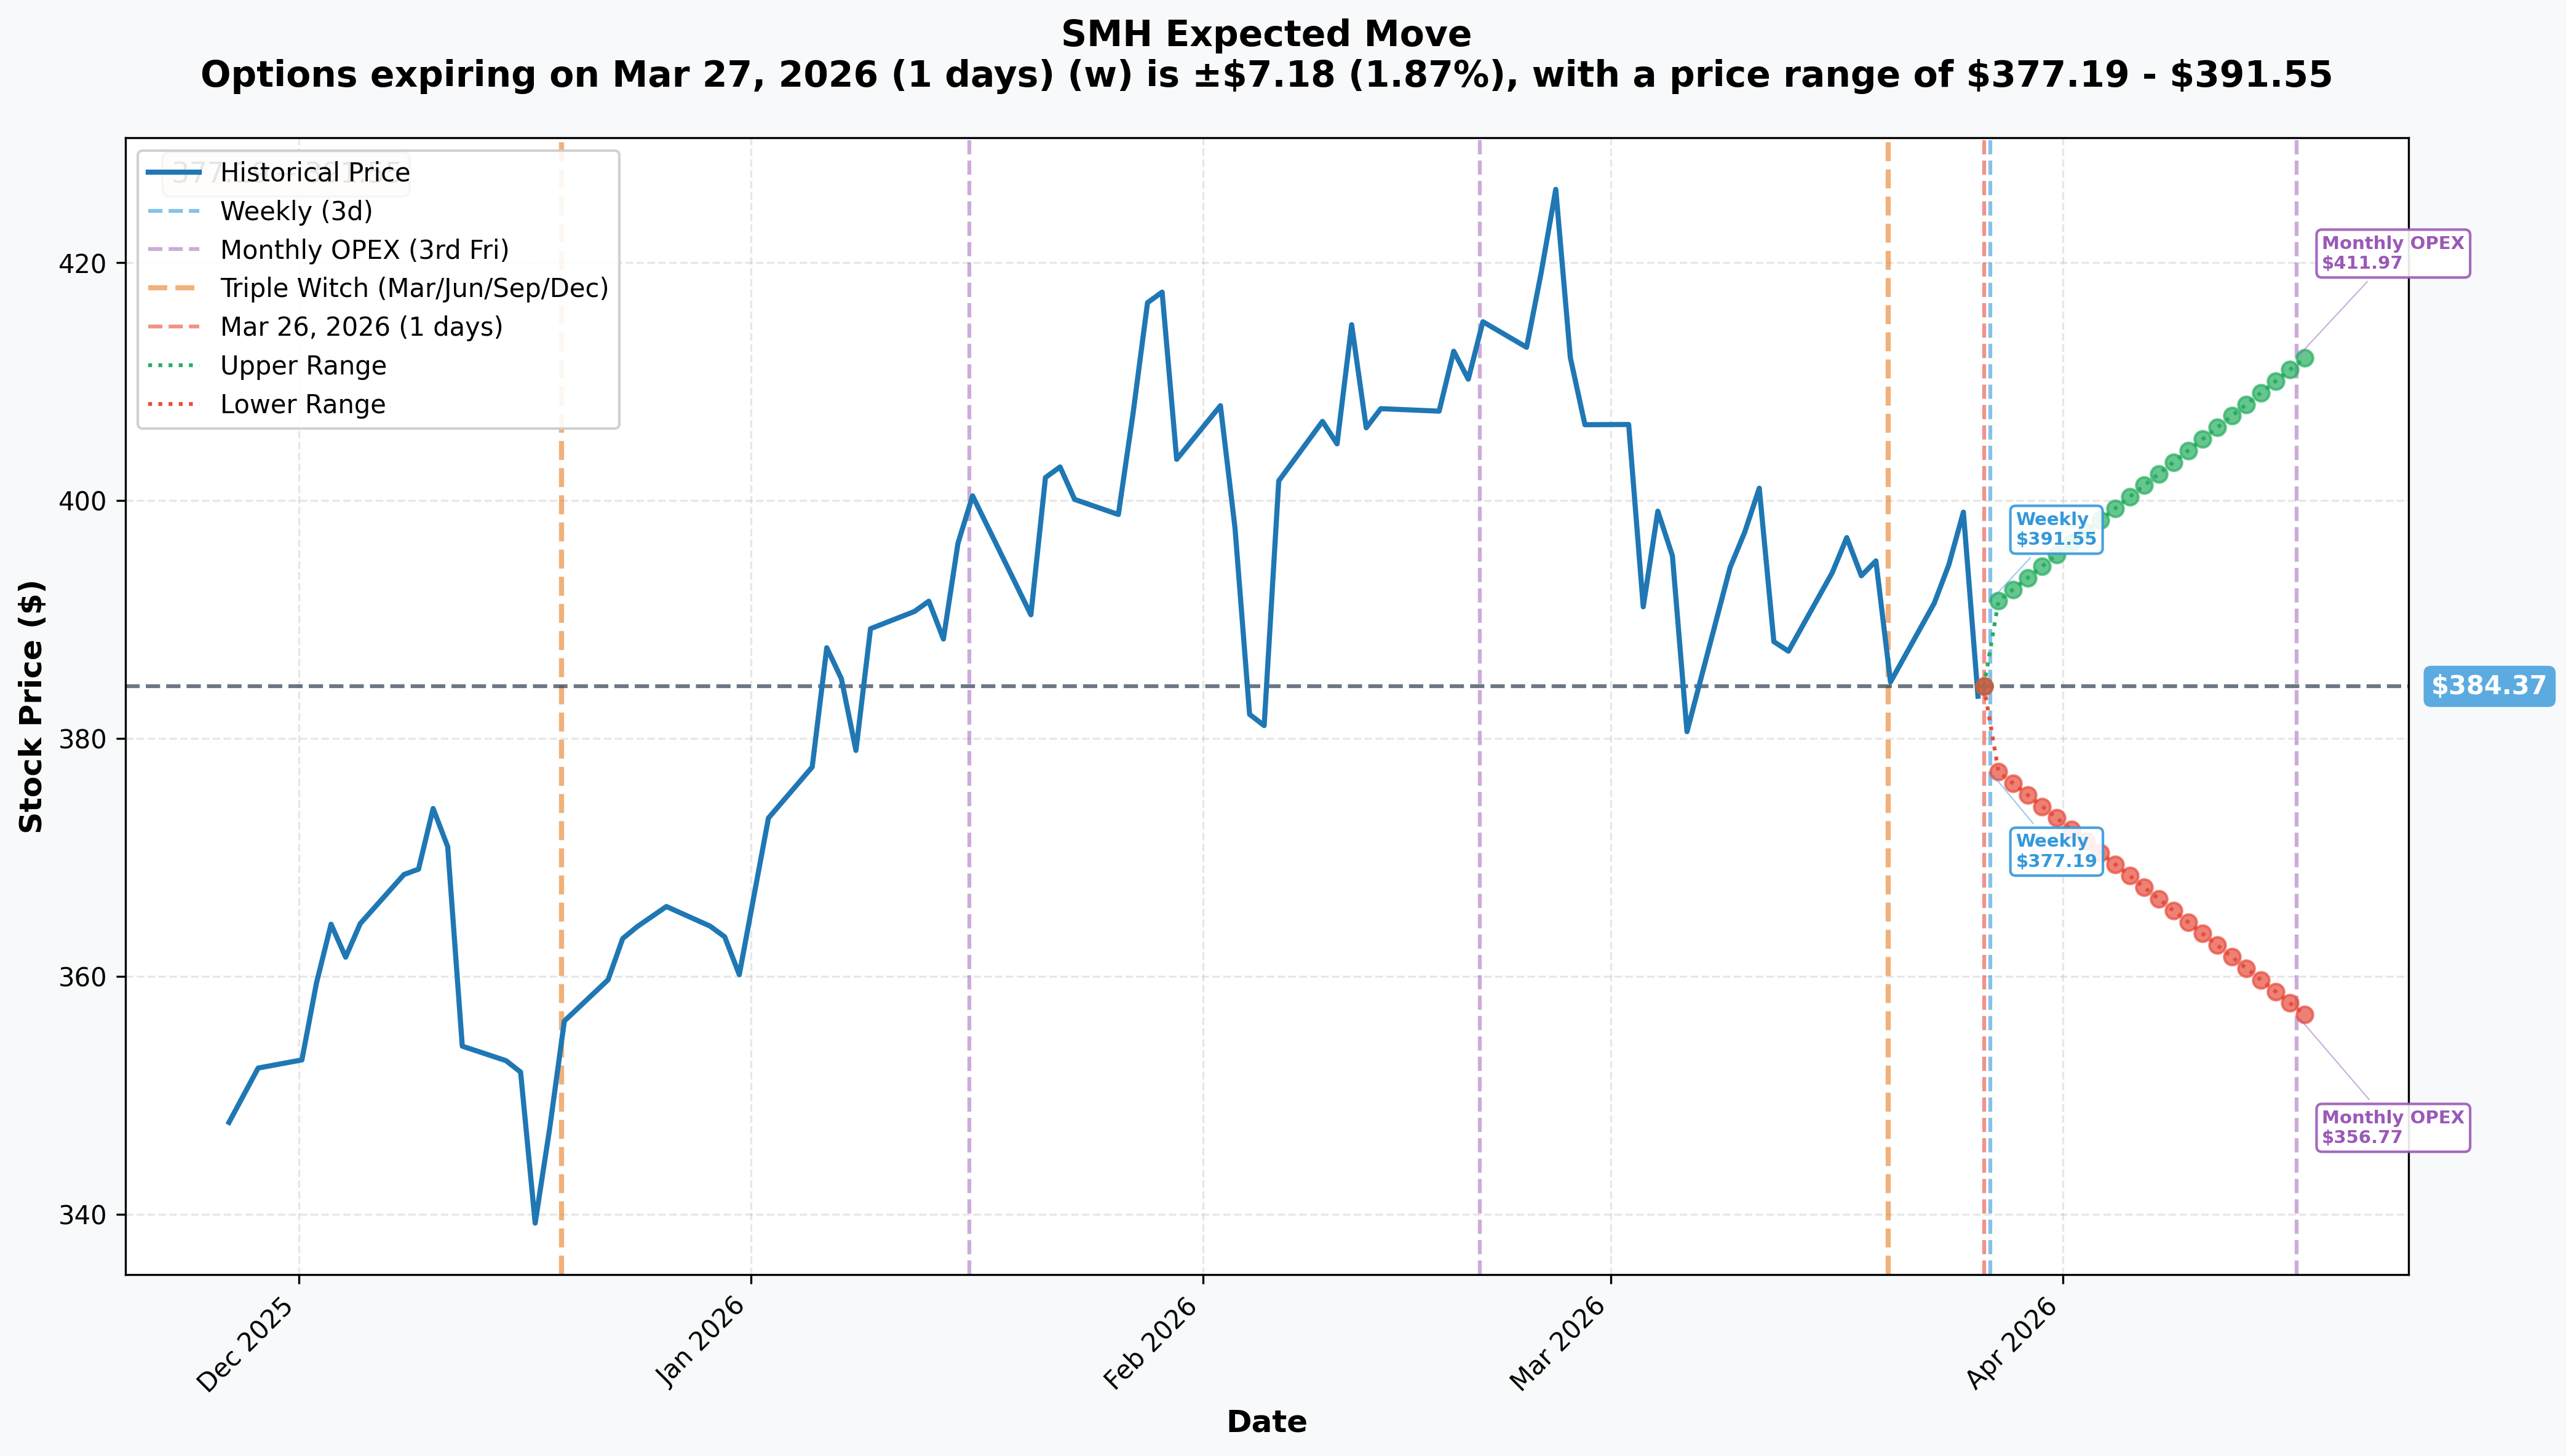
What options are pricing for upcoming expirations:
- 📅 Weekly (March 27 — 1 day): ±$7.18 (±1.87%) → Range: $377.19 to $391.55
- 📅 Monthly OPEX (April 17 — 22 days): ±$27.60 (±7.18%) → Range: $356.77 to $411.97
Translation for the trades today:
- The April 17 PUT at $367.50 sits inside the implied move lower range of $356.77. Options market is pricing a ~28% probability of SMH reaching or breaching $367.50 by expiry — it's not a slam dunk but it's absolutely within the distribution.
- The May 15 collar structure ($380 put / $410 call) brackets the April implied move range very neatly. The $380 put is $23 below current price (within the ±$27.60 monthly range), and the $410 call is $20 above (just above the upper range).
Key insight: The collar was constructed with laser precision around the April OPEX implied move ranges. The trader is essentially saying: "I expect SMH to trade within these bands — but I want downside protection if the lower end breaks."
🎪 Catalysts
Full catalyst research: SMH Catalyst Report
🔥 Upcoming Catalysts (April–September 2026)
TSMC Q1 2026 Earnings — Expected ~April 16, 2026 📊
This is the most immediate major catalyst — landing right at the April 17 put expiration. The timing of Trade 1 screams that this trader is positioned for a potential TSMC earnings disappointment or cautious guidance. TSMC guided Q1 2026 revenue to $34.6-$35.8B, but any slip in guidance for Q2 — especially on AI utilization or tariff impact — could kneecap SMH. Key watch: AI demand mix, gross margin trajectory, and any commentary on US tariff exposure.
ON Semiconductor Q1 2026 Earnings — May 4, 2026 📊
A minor but relevant data point for the broader chip cycle heading into the May 15 expiration on the collar. ON Semi is exposed to the slower-moving auto/industrial chip cycle rather than AI, which has been under pressure.
NVIDIA Q1 FY2027 Earnings — ~May 27, 2026 🚀
This is AFTER the May 15 collar expiration but will dominate market psychology in the weeks leading up to it. NVIDIA guided $78B ±2% for Q1 FY2027, and the Vera Rubin GPU ramp commentary will be the most important catalyst for the entire sector. Any pre-earnings anxiety (as analysts start debating whether NVIDIA can beat again) could pressure SMH into May 15.
NVIDIA Vera Rubin GPU Launch — Q2–Q3 2026 🚀
The biggest product catalyst in semiconductors this year. Vera Rubin (R200) offers 5x Blackwell inference performance with HBM4 + NVLink 6. If the ramp hits schedule, it would be a massive bull catalyst. But a single whisper of delay could trigger a multi-percent selloff across SMH.
Micron Q3 FY2026 Earnings — ~June 2026 💾
Micron guided Q3 revenue to ~$33.5B (+200% YoY) — a bar so high it will be scrutinized intensely. HBM4 execution, DRAM pricing, and NAND recovery are the key metrics.
Global Semiconductor Industry Approaching $1 Trillion 🌍
WSTS forecasts $975B in global semiconductor sales for 2026, +25% YoY. This milestone crossing could generate positive sentiment but also raise questions about peak cycle timing.
✅ Recent Catalysts (Already Happened)
SMH Weekly Drop of 6.4% — Week Ending March 21, 2026 📉
This was the proximate trigger for today's unusual activity. The ETF suffered its worst weekly decline since the Liberation Day tariffs of spring 2025, driven by renewed tariff anxiety and rotation out of high-multiple tech.
Broadcom Q1 FY2026 Earnings — March 4, 2026 (Beat) ✅
Broadcom delivered $19.31B vs $19.18B consensus, with AI revenue up 106% YoY to $8.4B. Q2 guidance of ~$22B with $10.7B in AI chip revenue gave the sector a tailwind — but the stock's reaction was muted, suggesting much was already priced in.
Micron Q2 FY2026 Earnings — March 18, 2026 (Massive Beat) ✅
Micron crushed it: $23.86B vs $20.07B consensus, EPS $12.20 vs $9.31 consensus, cloud memory up 160%. HBM4 production underway. Despite the blowout, SMH still fell in the week that followed — showing that even great news is struggling to move the sector higher.
NVIDIA Q4 FY2026 Earnings — ~February 26, 2026 (Beat + Big Guidance) ✅
$68.1B revenue (+73% YoY), Q1 guidance of $78B. The results were exceptional. But the market's inability to rally on multiple record quarters suggests something fundamental has shifted in sentiment.
Trump 25% Tariff on Re-Exported Chips — January 14, 2026 ⚠️
The tariff hit a narrow category of chips for re-export, with separate broader chip duties signaled. Broad 10% tariffs already in effect; advanced chip exemption is considered fragile. This is the #1 macro overhang on the sector right now.
🎲 Price Targets & Probabilities
Using gamma levels, implied move data, the collar structure, and the catalyst calendar, here's how the scenarios play out:
📉 Bear Case — Collar Thesis Validated (45% probability)
Target: $355–$375 by May 15, 2026
How we get there:
- 😰 TSMC April earnings show tariff headwinds or soft Q2 guidance → SMH breaks below $380 gamma support
- 📉 Tariff escalation targeting advanced chips causes sector-wide selloff
- ⚠️ Hyperscalers cutting or delaying AI capex due to ROI uncertainty triggers multiple compression
- 📊 Break below $380 (heaviest nearby gamma support) opens a path to $365 (next major support level)
- 🎢 Near-term put at $367.50 pays out, collar put at $380 starts earning intrinsic value
Trade 1 P&L at $360 by April 17: Put intrinsic value = $7.50, paid $7.91 → small loss on the put itself, but the position makes money if SMH drops below $359.59 Trade 2+3 P&L at $370 by May 15: Collar is in-the-money on the put side by $10/share → 1,249 contracts × $10 × 100 = $1.24M profit on the put, call expires worthless (premium collected kept)
This is the scenario this institutional trader has set up for.
🎯 Base Case — Range-Bound Chop (40% probability)
Target: $378–$395 through May 15, 2026
Most likely scenario:
- 🔄 SMH oscillates between the $380-$390 gamma zone as tariff news comes and goes
- 📊 TSMC earnings are in-line, no major positive or negative surprises
- ⚖️ Market treads water ahead of NVIDIA earnings in late May
- 💸 Near-term put at $367.50 expires mostly worthless (loses most/all of $1.1M premium)
- 🎯 Collar sits near breakeven — the $380 put loses value slowly but the $410 call sold retains its time premium
Trade P&L: Near-term put likely a near-total loss. Collar: short call retains value, put loses value — net small loss or near breakeven on the collar.
📈 Bull Case — Collar Acts as the Floor (15% probability)
Target: $400–$412 by May 15, 2026
What would get us here:
- 🚀 Tariff exemptions extended for advanced semiconductors → relief rally
- 💪 TSMC April earnings smash expectations with record AI utilization commentary
- 🤖 NVIDIA Vera Rubin pre-launch buzz creates momentum into Q1 NVIDIA earnings
- 📈 SMH breaks above $390 resistance, gamma levels at $400 and above become the next targets
Trade P&L in bull scenario:
- Near-term put ($367.50) expires worthless → -$1.1M loss
- Collar: short $410 call approaches strike and costs money; $380 put worthless → net collar loss widens toward the $400K net debit paid + additional mark-to-market losses
- This is the trader's pain scenario, but the $410 cap means unlimited loss protection stops there — max loss on the collar is capped at strike differential ($410-$380 = $30/share × 1,249 × 100 = $3.75M minus premium received)
💡 Trading Ideas
🛡️ Conservative: "Sleep Well Through Earnings" — Long Put Spread
Play: Buy the SMH May 15, 2026 $385 put, sell the SMH May 15, 2026 $370 put
Structure: $385/$370 bear put spread, expiring May 15
Why this works:
- 📊 Captures the same bearish thesis as the big institutional collar but at a fraction of the cost
- 🛡️ Defined risk: maximum loss is the net debit paid (roughly $5-7 per spread at current prices)
- 💰 Max profit: $15 per spread minus debit paid if SMH closes below $370 at expiry
- 🎯 The $380 level is the strongest nearby gamma support — if it breaks, $370 is next natural destination
- ⏰ Expires same day as the institutional collar — you're riding alongside the whale
Position sizing: Risk 2-4% of portfolio. 10 spreads at ~$6 each = ~$6,000 risk for ~$9,000 max profit.
Risk level: Moderate (defined risk) | Skill level: Intermediate
⚖️ Balanced: "TSMC Earnings Insurance" — Near-Term Bear Put Spread
Play: Buy the SMH April 17, 2026 $380 put, sell the SMH April 17, 2026 $365 put
Structure: $380/$365 bear put spread, expiring April 17 (same as Trade 1)
Why this works:
- 📅 TSMC earnings fall right around April 16 — if they disappoint, SMH could drop hard going into OPEX
- 🎯 The $380 strike is where gamma support lives — a break there could trigger accelerated selling toward $365-$370
- 💸 Spreads cost far less than the outright $367.50 puts the institutional buyer purchased
- 📊 Risk/reward roughly 2:1 if SMH drops from $384 to below $365 by April 17 expiry
- ⏰ 22 days is tight but it's exactly the window the institutional flow is targeting
Position sizing: 10-15 spreads at ~$5-7 each = $5,000-$10,500 risk.
Risk level: Moderate-High (needs a move in 22 days) | Skill level: Intermediate
🚀 Aggressive: "Short the Chip Surge" — Outright May Put
Play: Buy the SMH May 15, 2026 $375 put outright
Why this works (and why it's risky):
- 💥 Higher delta than the spread — more responsive to a drop in SMH
- 🎯 $375 is between the $377.50 and $370 gamma support levels — a break through $380 would take it through multiple gamma floors quickly
- 📊 Same May 15 expiration as the institutional collar — mirrors the big money timeframe
- 🚀 If SMH drops to $355 by May 15, a $375 put starting around ~$15 would be worth ~$20, a ~33% gain
- ⏰ 50-day timeframe gives room for the TSMC catalyst AND broader tariff news to play out
Why it could blow up:
- 💸 Outright puts are expensive — you're paying for directional exposure plus volatility premium
- 📈 If SMH rips back above $395-$400, the put loses value quickly
- ⏰ Theta (time decay) works against you every day the trade is open
- 📊 Breakeven at expiration is roughly $375 minus premium paid — SMH needs to fall meaningfully
Position sizing: Risk ONLY what you can afford to lose completely. 5-10 contracts max.
Risk level: HIGH | Skill level: Advanced
⚠️ Risk Factors
Don't get caught flat-footed by these:
-
📈 Tariff resolution = instant rally: The single biggest risk to the bear thesis is a US-China trade deal or tariff exemption extension for advanced chips. Any positive trade headline could gap SMH back above $390-$400 instantly, wiping out bearish positions.
-
🤖 NVIDIA Vera Rubin pre-launch excitement: Vera Rubin launches Q2-Q3 2026 with 5x Blackwell inference performance. Any major pre-launch demo or benchmark release could spark a sharp sector rally well before the May 15 expiration.
-
💰 Hyperscaler capex is not slowing: Combined 2026 AI infrastructure capex is approaching $700B. Meta, Google, Microsoft, and Amazon have not blinked. If Q1 earnings from hyperscalers reconfirm AI spending, SMH could rip to new highs.
-
📊 Analyst consensus is strongly bullish: 22 buy ratings, 0 sells, average target of $507.51. That's 30% upside to current price. The institutional puts may be a hedge against a long position — not a pure short. Even the big money may be net long on semiconductors overall.
-
🏭 SMH concentration risk cuts both ways: NVIDIA at 19.4% of the fund means a single blowout NVIDIA print could outrun all this bearish positioning. One stock can move the whole ETF.
-
⏰ Time decay on the near-term put is brutal: The $367.50 April 17 put expires in 22 days. With SMH at ~$384 and the strike at $367.50 — that's 4.5% out of the money. Theta will eat into this position quickly if SMH doesn't move. The $7.91 premium will decay noticeably each passing day.
-
🌍 Geopolitical tail risk: Taiwan Strait tensions remain an existential risk for TSMC and the global chip supply chain. This is actually a risk for the bears too — a geopolitical shock could cause extreme market dislocation that isn't straightforwardly bearish on the ETF.
-
💸 Growth is real even if stretched: Micron just reported $23.86B (blew away the $20.07B estimate), cloud memory revenue up 160%. Broadcom AI revenue up 106% YoY. The underlying business is growing explosively — this is not a traditional short thesis.
🎯 The Bottom Line
Real talk: $5.3 million moved into bearish SMH structures today, and the construction of these trades tells a very specific story. The near-term put at $367.50 is a tactical bet on downside into TSMC earnings (due around April 16, right at expiration). The collar — selling the $410 call and buying the $380 put for nearly zero net cost — is a classic "I've made money and I'm protecting it" move. Together they say: "I don't think SMH is rallying from here in the next 7 weeks, and I'll pay to protect myself below $380."
What the flow tells us:
- 🎯 The institutional player is NOT positioned for a continued rally in semiconductors near-term
- 🔒 The collar's near-zero net cost means this is almost certainly protecting an existing long position, not a naked short
- 📊 TSMC earnings (~April 16) is the primary catalyst being hedged against — the near-term put expiry timing is too precise to be a coincidence
- ⚠️ The Z-scores on the May 15 trades (15.03 and 12.43) confirm this is genuinely unusual institutional positioning — activity this elevated relative to historical norms is a clear signal that informed money is moving
What this means for you:
If you're already long SMH:
- 📊 Consider a similar cheap collar structure — the May 15 structure cost this trader roughly $400K net on $125M+ of notional exposure. That's an efficient hedge.
- 🎯 Watch the $380 level closely — that's where gamma support is strongest and where this trader is paying to be protected. A break below $380 changes the picture.
- ⏰ Mark ~April 16 (TSMC earnings) as your first major risk checkpoint
If you're looking for a bearish entry:
- 🛡️ Use spreads, not naked puts — the institutional put at $367.50 has a brutal 22-day clock
- 📅 The May 15 timeframe captures both TSMC and ON Semi earnings AND the setup into NVIDIA's late May report
- 🎯 The $380 gamma support level is your line in the sand — if SMH holds above it, the bear thesis needs revisiting
If you're watching from the sidelines:
- 👀 This is a high-quality signal that big money is nervous about near-term semiconductor momentum despite the outstanding fundamental backdrop
- 📊 The disconnect between record earnings (Micron, NVIDIA, Broadcom all crushing it recently) and bearish options flow suggests this is about macro risk (tariffs, multiples) rather than fundamentals
- 🎢 Buckle up for TSMC earnings — it's the make-or-break moment for this whole setup
Key dates to mark:
- 📅 ~April 16, 2026 — TSMC Q1 2026 earnings (the prime catalyst for Trade 1)
- 📅 April 17, 2026 — Near-term $367.50 put expiration — moment of truth
- 📅 May 4, 2026 — ON Semiconductor Q1 2026 earnings
- 📅 May 15, 2026 — Collar expiration — both the $410 call and $380 put expire
- 📅 ~May 27, 2026 — NVIDIA Q1 FY2027 earnings — the big post-collar catalyst
Final verdict: The semiconductor industry is printing record numbers, but tariff risk and stretched multiples are making smart money nervous about the near-term. Someone with serious conviction just put $5.3M into bearish structures that target a 2.5-7% pullback from here over the next seven weeks. You don't need to mirror this trade — but you should take the warning seriously, watch your stop levels at $380, and stay hedged going into TSMC's April earnings.
The sector's fundamentals are as strong as they've ever been. The near-term risk/reward? That's a different conversation entirely. 💀
Disclaimer: Options trading involves substantial risk of loss and is not suitable for all investors. This analysis is for educational purposes only and does not constitute financial advice. Collar strategies, spreads, and outright put purchases all carry the risk of total loss of premium paid. Past unusual options activity does not guarantee future price movement in the indicated direction. Always conduct your own due diligence and consult a licensed financial advisor before making any trading decisions.
About VanEck Semiconductor ETF (SMH): SMH tracks the MVIS US Listed Semiconductor 25 Index, providing concentrated exposure to the 25 largest US-listed semiconductor companies. With $43.89B in AUM and top holdings including NVIDIA (19.4%), TSMC (11.6%), and Broadcom (7.9%), SMH is the benchmark vehicle for semiconductor sector exposure. Up 12.9% YTD but facing headwinds from tariff policy and valuation concerns heading into Q2 2026.