🛡️ SMH $17M Semiconductor Tail Hedge — A Year-Out LEAP Put Crossed as Insurance on a +60% YTD Run
📅 June 11, 2026 | 🔥 Unusual Activity Detected
✅ Updated 2026-06-12: Next-day OPRA OI confirms the open — open interest rose 127 → 2,027 (Δ +1,900 ≈ the 2,000 traded). The year-out semiconductor tail hedge is confirmed on the books.
🎯 The Quick Take
At 09:47:49 this morning, a desk quietly crossed a $17M block of SMH $550 puts expiring June 17, 2027 — a year-out out-of-the-money LEAP, negotiated off the open book with a known counterparty. The VanEck Semiconductor ETF is sitting on a +60.6% gain this year and semis now make up ≈18% of the S&P 500 — more than double the dot-com peak. This isn't a panic trade. This is a desk with a large semiconductor book paying $17M to buy one year of insurance against a catastrophic drawdown. With NVDA Q2 earnings on August 26 and a freshly demonstrated ability to erase $1.3 trillion in chip market cap in a single session, the timing makes complete sense.
📊 ETF Overview
VanEck Semiconductor ETF (SMH) is the go-to institutional vehicle for concentrated semiconductor exposure:
- AUM: ≈$5.6 billion
- Sector / Industry: Technology — Semiconductors
- What it holds: The top 25 U.S.-listed semiconductor companies, with NVDA (15.55%), TSMC (9.78%), Micron (7.28%), AMD (7.22%), and Intel (6.56%) making up nearly half the fund. The top 10 holdings alone exceed two-thirds of total assets — this is a highly concentrated, AI-accelerator-dominant bet (Macroaxis).
- YTD Performance: +60.6%, last trade ≈$599.49 — one of the biggest ETF moves in the market this year.
- Why it matters for hedgers: With semis at ≈18% of the S&P 500, an SMH put isn't just a semiconductor hedge — it's a meaningful broad-market tail hedge. A chip sector drawdown now drags the whole index (24/7 Wall St.).
💰 The Option Flow Breakdown
The Tape — June 11, 2026 @ 09:47:49: 🤝 Block Cross
| Time | Buy/Sell | Call/Put | Expiration | Premium | Strike | Volume | OI | Size | Spot | Option Price | Option Symbol |
|---|---|---|---|---|---|---|---|---|---|---|---|
| 09:47:49 | BUY | PUT | 2027-06-17 | $17M | $550 | 2,000 | 127 | 2,000 | $592.09 | $83.54 | SMH20270617P550 |
Flow type: 🤝 BLOCK CROSS — this trade was executed as a single-leg cross, with 99% of tape prints bearing the cross condition code. A broker matched a buyer and seller off the open book — there is a known counterparty. This is not aggressive lit-book sweeping, not a panic slam into the ask. The desk "crossed" this block deliberately, at a pre-negotiated price, through a facilitated channel. Language matters here: the right words are "crossed," "negotiated," "a desk positioned" — not "slammed" or "panic bought."
✅ RESOLVED — Next-Day OI Confirms the Open (2026-06-12)
| Snapshot | Open Interest |
|---|---|
| Pre-print baseline (EOD 2026-06-10) | 127 |
| Resolving (EOD 2026-06-11) | 2,027 |
| Δ | +1,900 (≈ the 2,000 traded) |
Open interest ROSE by ≈1,900, matching the trade size — the $550 June-2027 put opened as a fresh position. The semiconductor tail hedge / insurance is confirmed on the books.
🤓 What This Actually Means — Plain English
Let's decode this carefully, because the framing matters a lot.
This is not a prediction that SMH is about to crash. An out-of-the-money put LEAP ≈7% below spot with a one-year runway is a portfolio tail hedge — the options equivalent of buying homeowner's insurance on a house you love and plan to keep. You're not betting the house burns down. You're protecting against the possibility.
Here's the geometry: with SMH trading at $592.09, the $550 strike is ≈7% below current price. The desk paid $83.54 per share ($17M total) for the right to sell SMH at $550 anytime up to June 17, 2027. For that put to be fully "in the money" at expiration, SMH would need to fall below $550 — a move of ≈7% from today's spot. For the put to be profitable (net of premium paid), SMH would need to fall below roughly $466 ($550 − $83.54), a drawdown of ≈21% from today's level.
That sounds steep — until you remember that the Philadelphia Semiconductor Index fell ≈10.3% in a single session on June 5 because Broadcom's AI guide merely met rather than beat expectations. In that context, a 21% drawdown over twelve months is not a far-fetched tail risk — it's the scenario you insure against precisely because you don't expect it but can't afford not to.
Order type: BTO — Buy to Open. The desk opened a fresh long put position. They are now the buyer of protection, not the seller.
Why a year-out LEAP put specifically?
- ≈12 months captures every major near-term binary: NVDA Q2 (August 26), AVGO Q3 (early September), hyperscaler Q2 capex prints (late July–early August), any China H200 policy shift, and Burry's January 2027 SOXX puts expiry.
- Long-dated OTM puts benefit from a spike in implied volatility even before the strike is reached — if the market panics, the put gains value fast from rising vol (vega exposure), not just delta.
- A cross execution signals the desk had a counterparty ready — someone was willing to sell this insurance at $83.54. That's not unusual: market makers and volatility sellers routinely take the other side of institutional tail hedges.
Confidence on the open/close call: HIGH. Size 2,000 ≫ prior OI 127 makes this a tape-confirmed open. The ⏳ callout above is standard procedure; the math here is as clean as it gets.
📈 Technical Setup / Chart Check-Up
YTD Performance
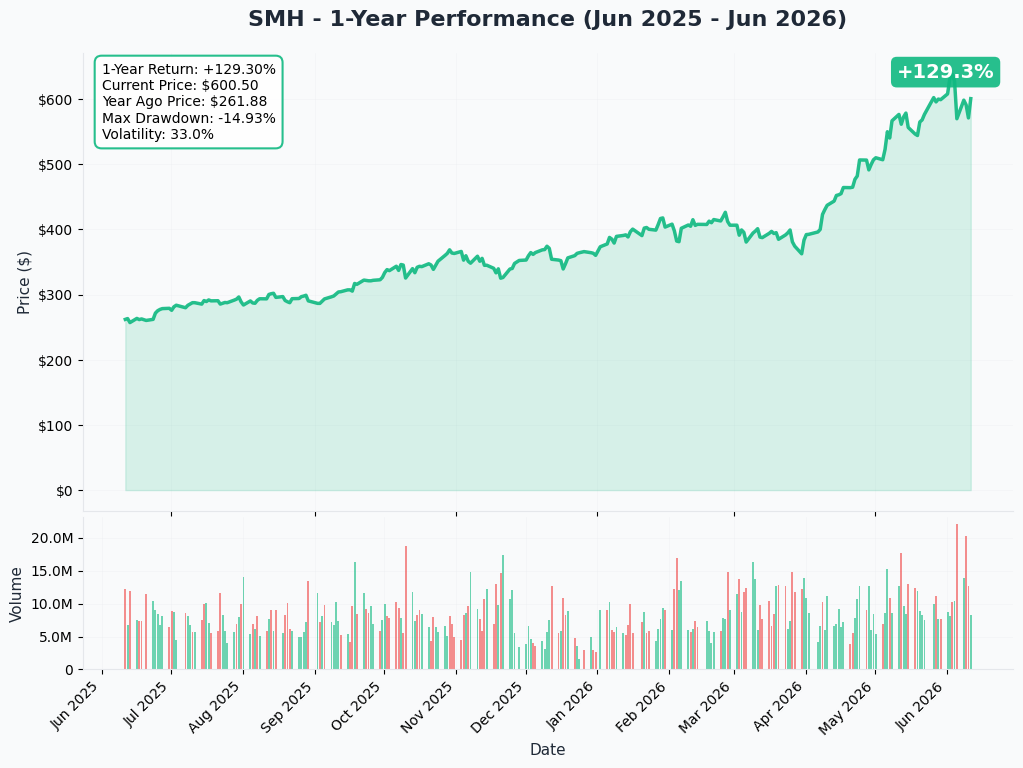
SMH has been one of the market's defining trades in 2026 — up +60.6% year-to-date, last trading around $599.49. The chart shows a sustained, nearly uninterrupted uptrend from the January lows, fueled by AI-infrastructure spending that drove NVDA (+85% revenue), TSMC (+40% revenue), and AVGO AI (+143% revenue) to record quarters in quick succession.
Key observations:
- 📈 +60.6% YTD — one of the top ETF gainers in the market, putting the sector at the most stretched levels vs its 200-DMA since the 2000 dot-com peak (CNBC)
- ⚠️ June 5 rout: The ETF absorbed a sharp single-session drawdown as the SOX fell ≈10.3% after Broadcom's Q2 guide — a wake-up call that proved the market fragility beneath the headline gains
- 📊 Recovery but fragility visible: SMH bounced back toward $600 but the June 5 move permanently reset risk perception for anyone running a large semi book — exactly the audience for today's hedge
This is the chart of someone who is very right on a position and knows the higher you go, the further there is to fall. Today's $17M cross is the insurance premium.
Gamma-Based Support & Resistance
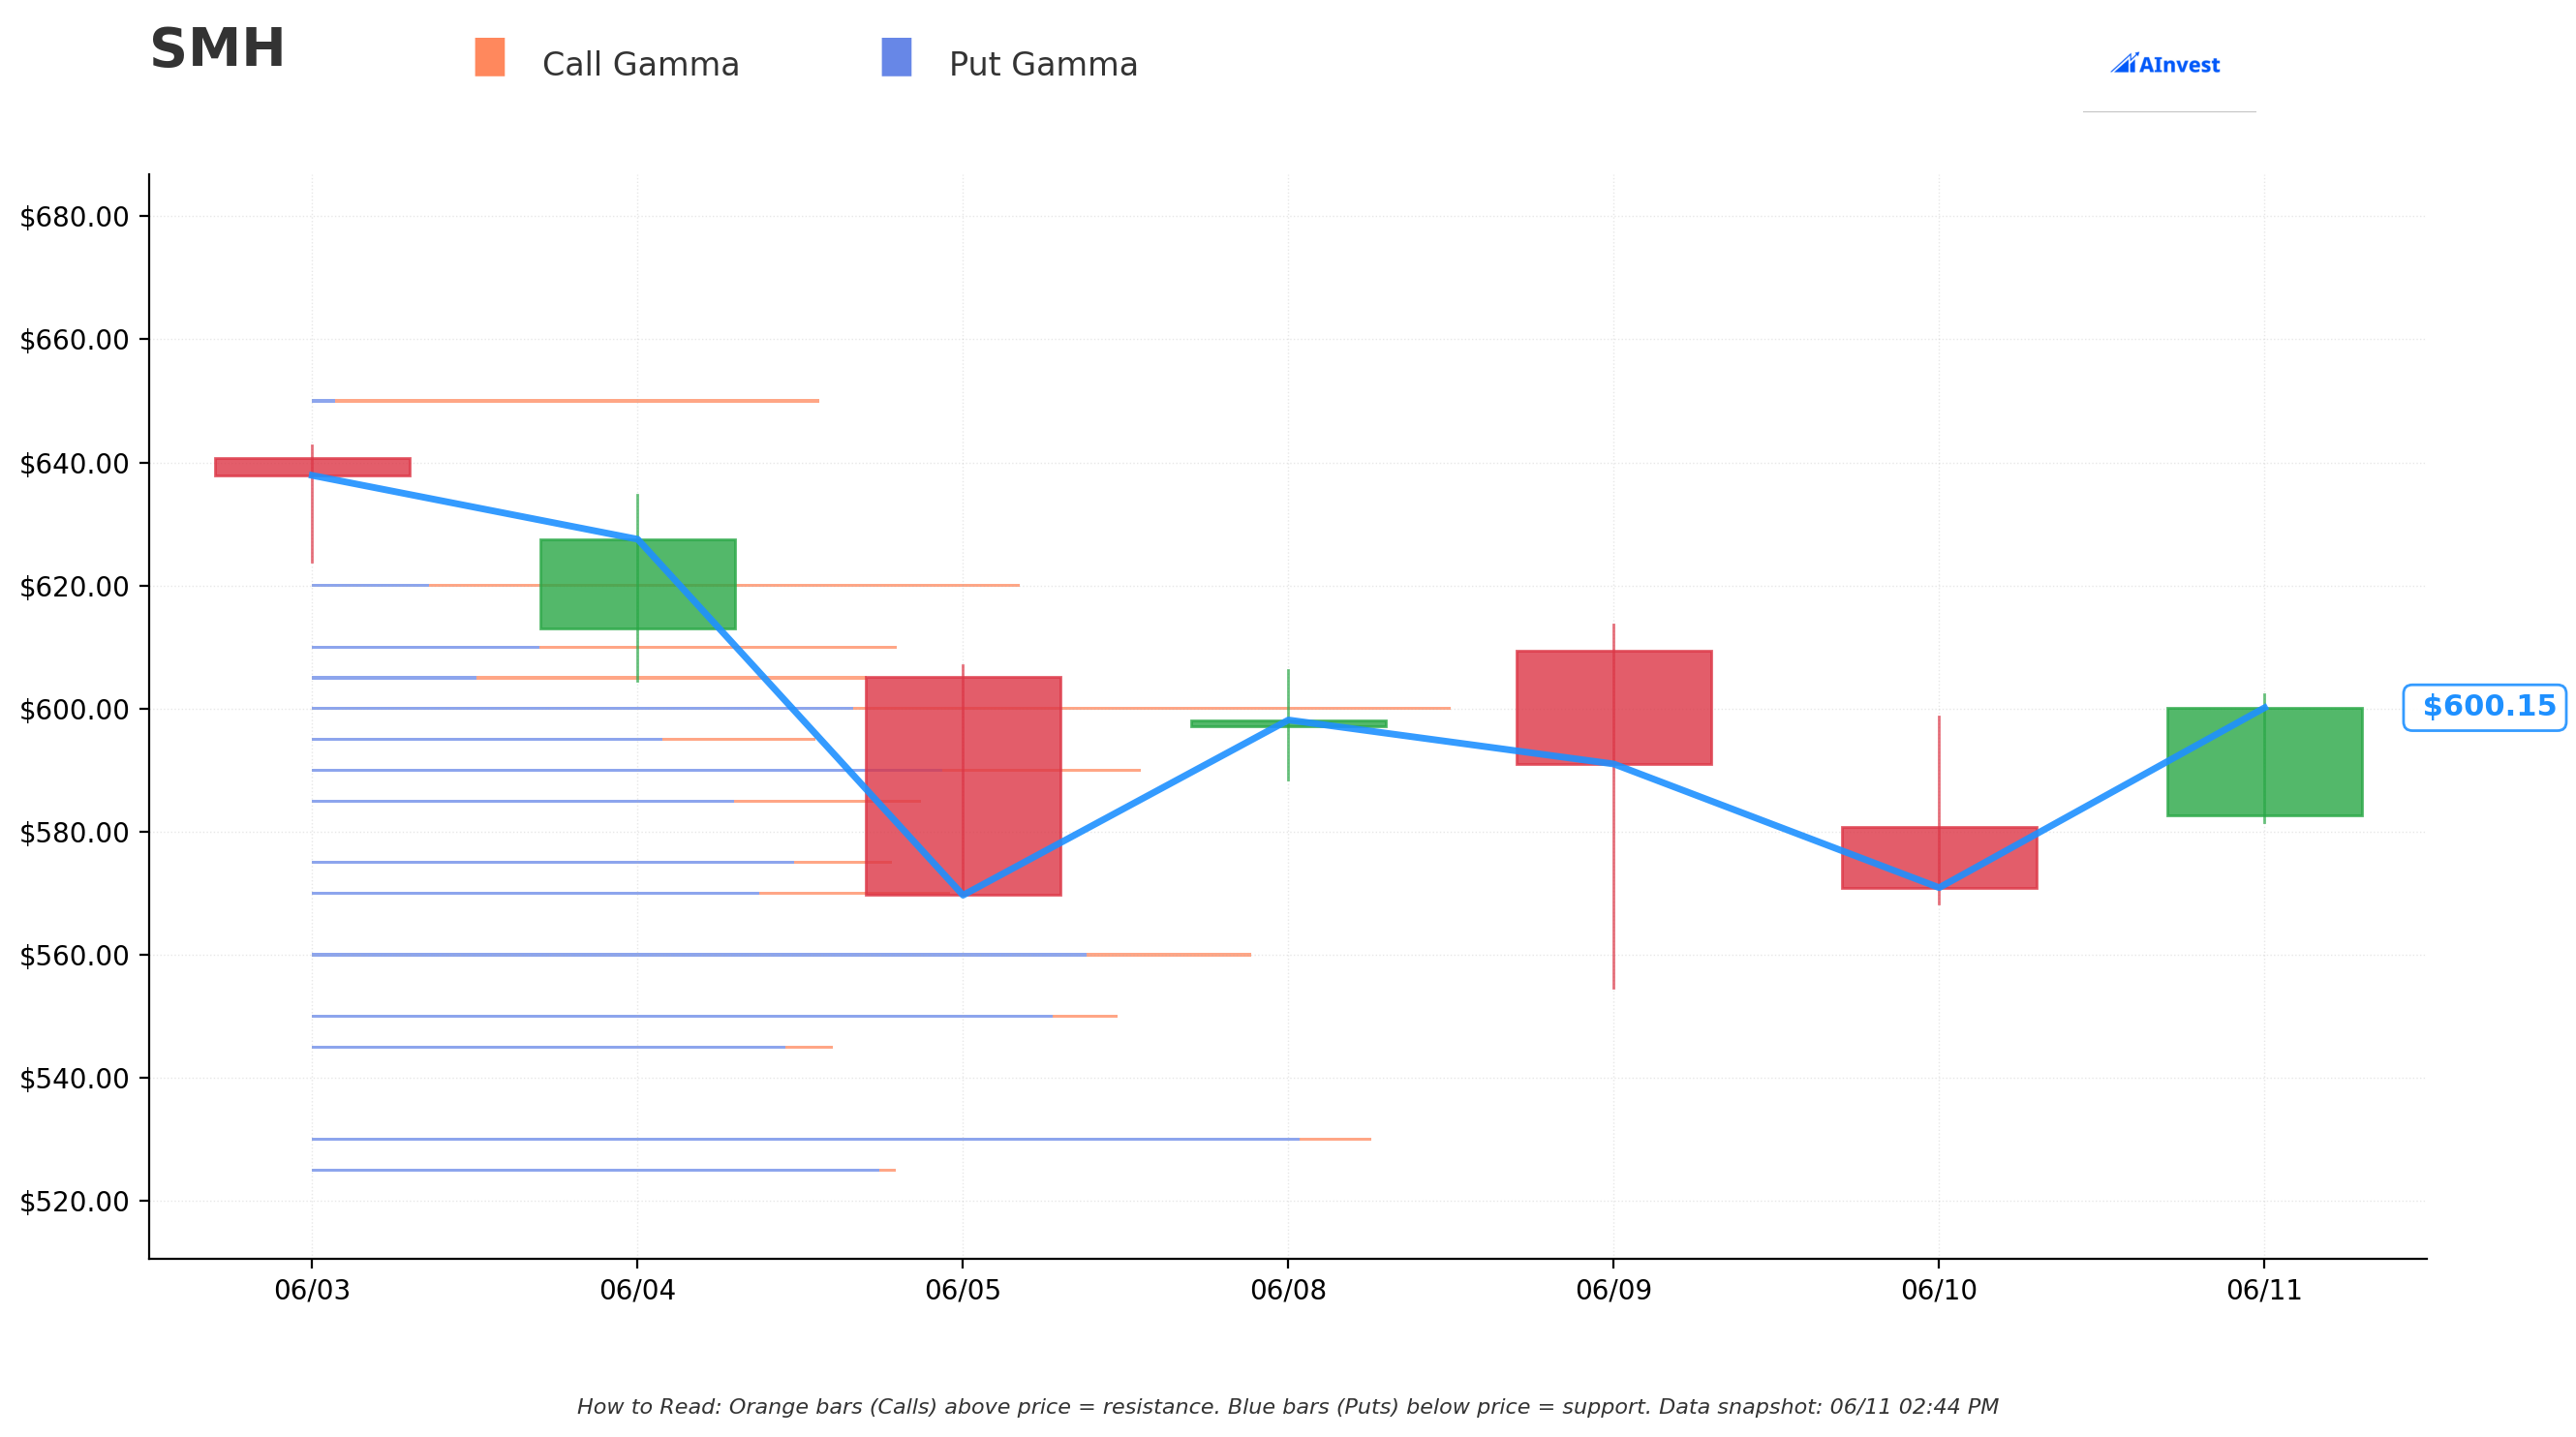
Current Spot: ≈$600.28
The gamma exposure map reveals a well-structured set of levels around current price:
🔵 Support Levels (Put Gamma Below Price):
- $600 — First Support. A key gamma floor immediately below current spot. Market makers with short put exposure at this strike will tend to buy dips as SMH approaches $600, creating a natural sticky level.
- $590 — Secondary Support. The next meaningful put gamma cluster. A breach of $600 would likely see the ETF gravitate toward $590 as the next floor.
- $560 — Intermediate Support. Deeper put gamma shelf. A sustained move below $590 would likely target this zone.
- $550 — Key Lower Support Shelf. This is exactly where today's put hedge is struck. The $550 level carries meaningful put open interest — it's not a random strike. The desk chose a level where the options market already has established positioning, which supports liquidity if they ever want to unwind.
- $530 — Extended Support. Below $550, the next notable gamma floor.
🟠 Resistance Levels (Call Gamma Above Price):
- $605 — Immediate Resistance. The first call gamma wall above current spot. Overhead selling pressure from market makers hedging short calls here.
- $610 — Secondary Resistance. A clean break of $605 would face another wall at $610.
- $620 — Extended Resistance. The upper gamma ceiling for the near-term range.
Translation for traders: SMH is trading in a zone where the gamma structure provides natural near-term support around $590–$600. For the $550 put hedge to become an "in the money" position, the ETF would need to break through multiple support shelves — $600, $590, $560 — sequentially. That's exactly the scenario being insured against, not predicted.
Implied Move Analysis
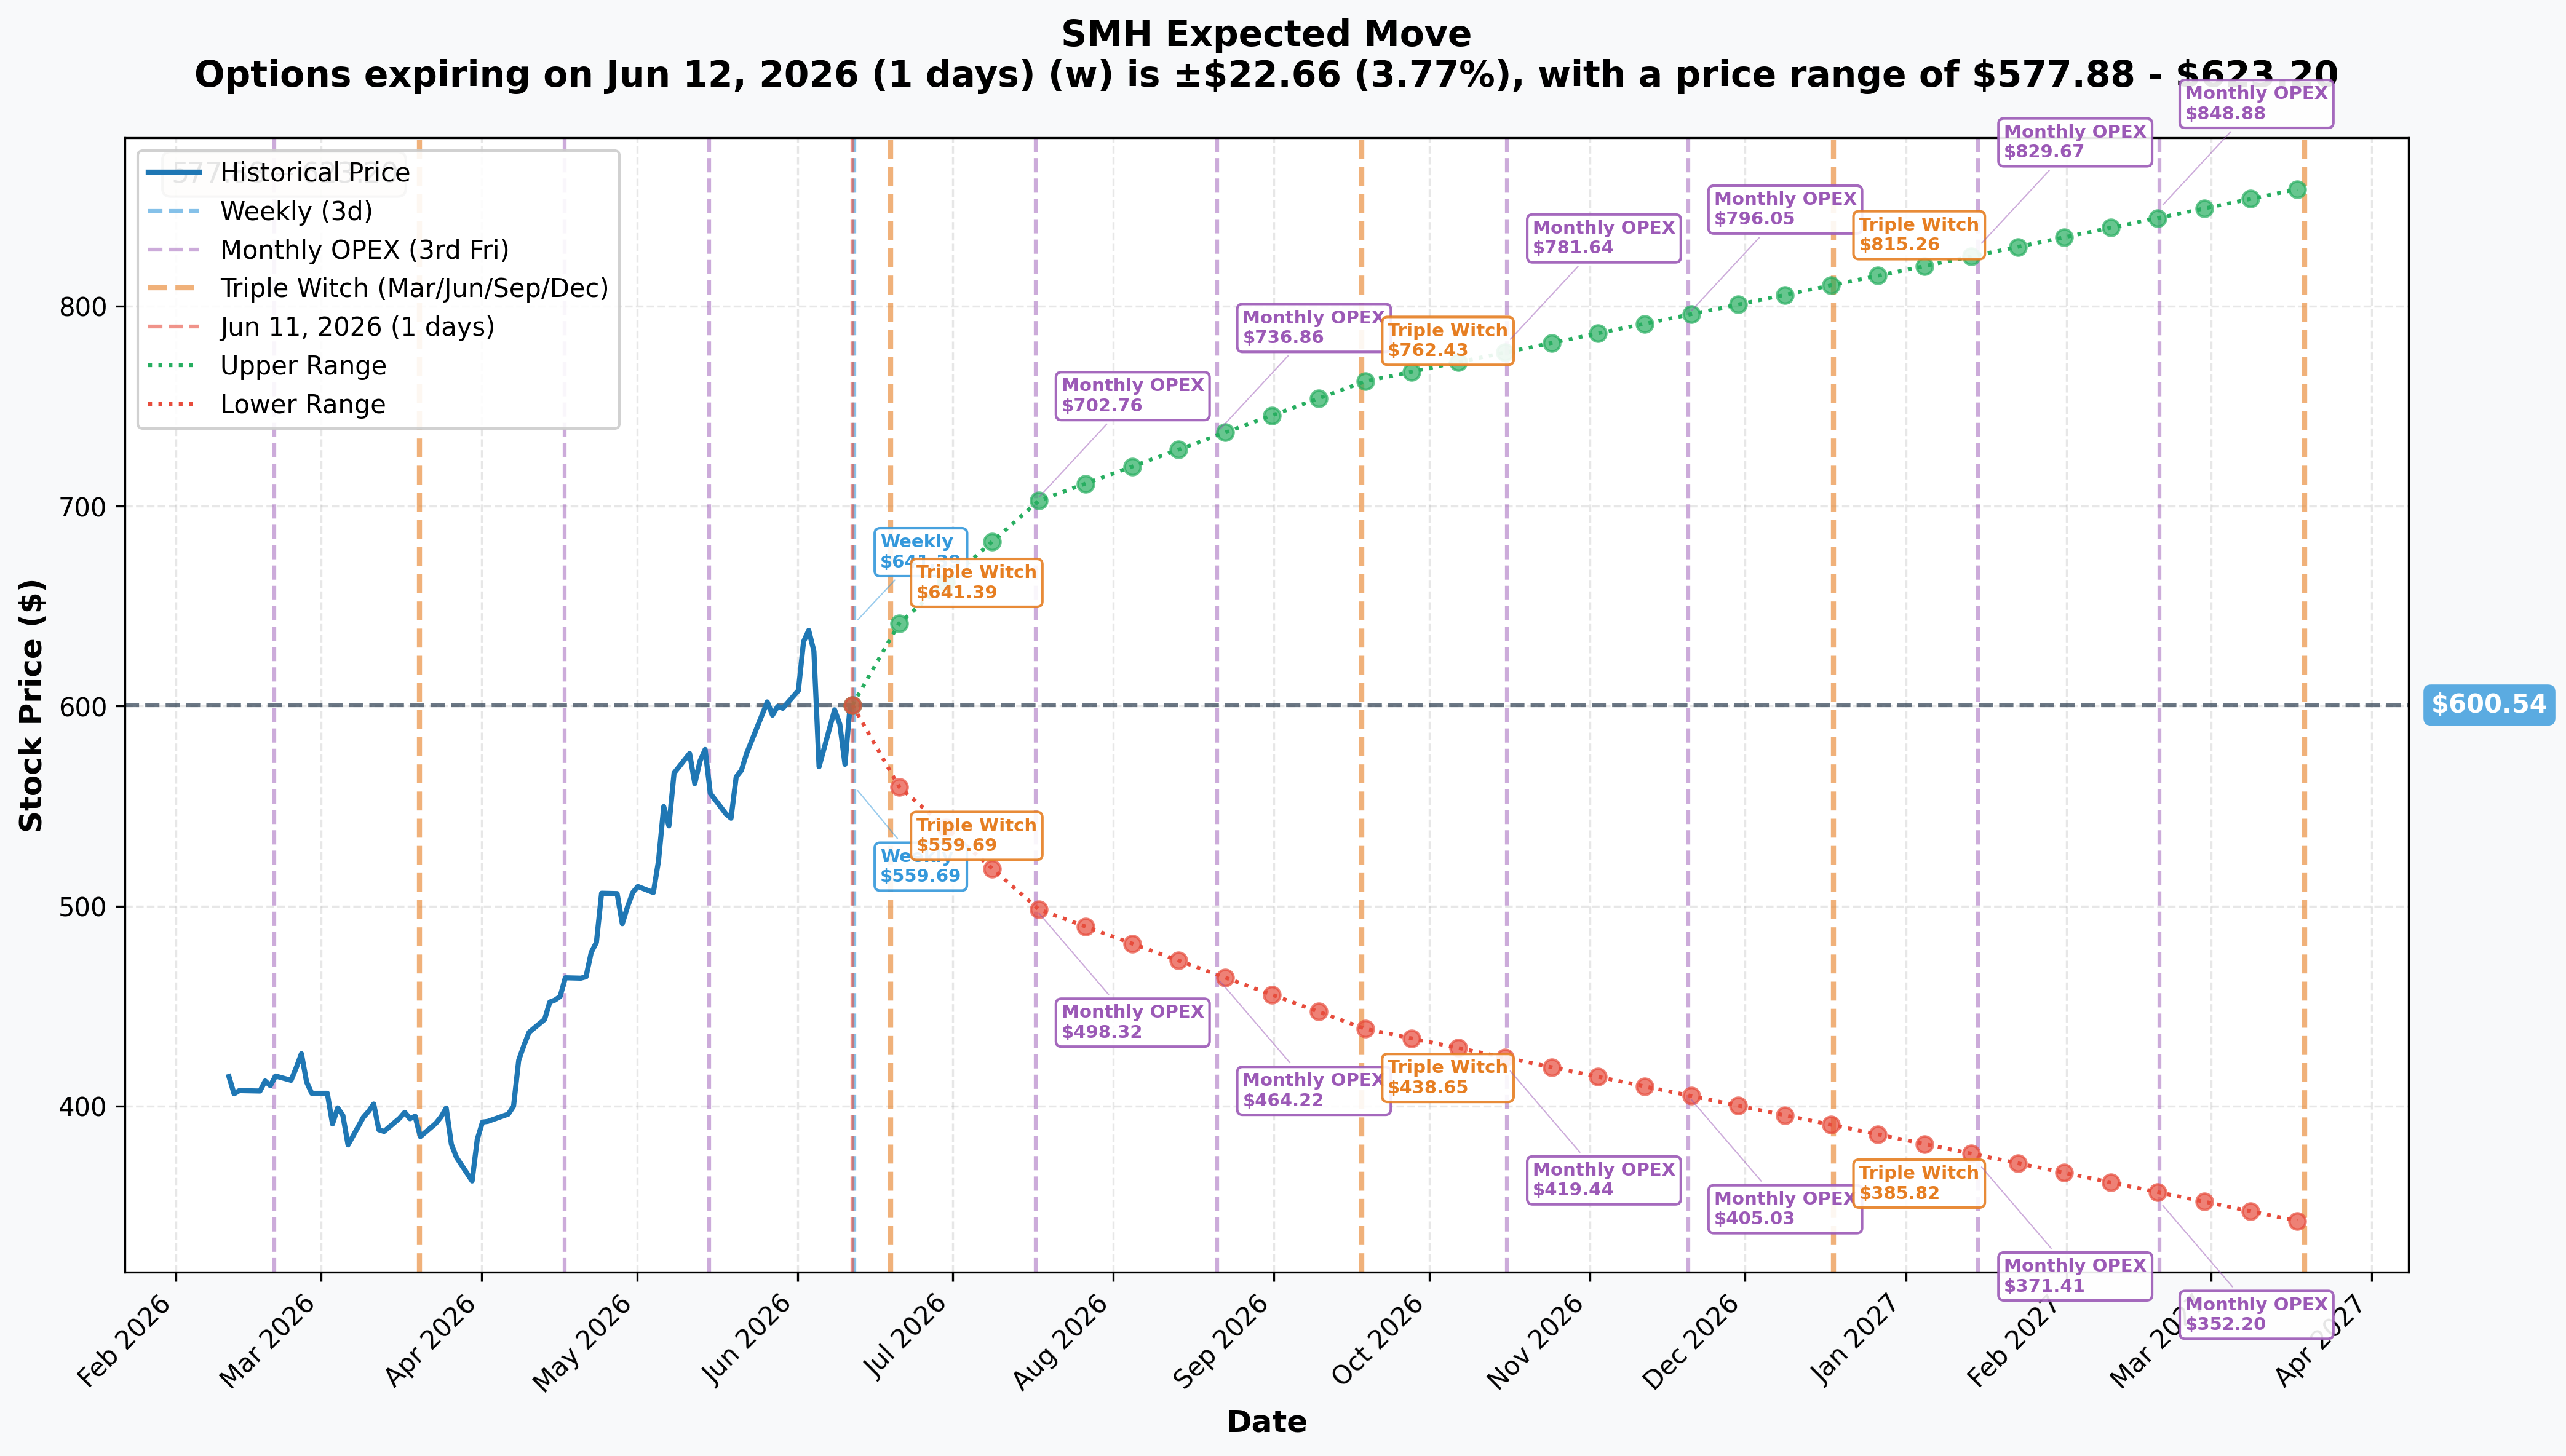
The options market is pricing in progressively wider uncertainty bands as you look further out — and the numbers confirm why a one-year LEAP put at $550 is meaningful protection rather than a lottery ticket:
- 📅 Monthly OPEX (7/17 — ≈36 days): ±17% → Range $498.32 – $702.76
- 📅 Quarterly (≈90 days): ±27% → Range $438.65 – $762.43
- 📅 LEAP (2027-03, ≈9 months): ±43% → Range $341.53 – $859.55
The monthly implied move lower bound of $498.32 already puts the $550 strike inside the one-month options probability cone. The quarterly lower bound of $438.65 shows that the market's own pricing considers a drawdown well through $550 to be within the realm of possibility over three months. The LEAP lower bound of $341.53 shows the options market is pricing significant skew to the downside over a year.
Put plainly: the $550 strike at $83.54 is not cheap insurance. But it's insurance that sits within the options market's own one-year probability distribution. The desk isn't buying a lottery ticket — they're buying coverage for a scenario the market explicitly prices as non-trivial.
🎪 Catalysts
Already Happened — The Context That Makes This Hedge Rational
The June 5, 2026 Chip Rout — $1.3 Trillion Erased in One Session The SOX fell ≈10.3% on June 5, its steepest single-day drop since 2020, erasing over $1.3 trillion in chip-sector market cap. NVDA shed ≈6%, AMD −10.86%, Intel −11.28%. The trigger: Broadcom's Q2 2026 results were objectively exceptional (revenue +48% YoY, AI semiconductor revenue +143% YoY) — but the Q3 AI guide of $16.0B fell short of the ≈$17.2B estimate. "Priced for perfection" met one quarter of normal. The sector went into freefall. For any institution sitting on +60% YTD SMH gains, this session was a visceral reminder of what a real drawdown feels like.
NVDA Q1 FY2027 — Earnings That Sent the Stock Lower NVIDIA reported Q1 FY2027 on May 20: revenue $81.6B (+85% YoY), Data Center $75.2B (+92%), non-GAAP EPS $1.87 (+140% YoY). A near-perfect print. The stock slid anyway. When a company beats on every metric and the stock goes down, the market is telling you something important about positioning and expectations — which is exactly the environment where you buy tail hedges.
TSMC Q1 2026 — Raising the Bar Higher TSMC reported +40.6% revenue YoY, raised its full-year 2026 outlook above 30%, and raised capex to the high end of $52–56B. Magnificent fundamentals. Also the kind of "peak cycle" language that makes long-term hedgers nervous.
Semis Are Now 18% of the S&P 500 — 2x the Dot-Com Peak 24/7 Wall St. documented that semiconductor stocks now constitute ≈18% of the S&P 500 — more than double their peak concentration during the dot-com bubble. This index concentration means that hedging SMH is also, in effect, hedging the broad market against an AI-capex deceleration scenario.
Michael Burry's SOXX Puts — The Same Thesis, Made Explicit Michael Burry disclosed January 2027 SOXX puts struck at $330 while SOXX traded ≈$455 — a ≈27% OTM tail hedge with an ≈9-month horizon. He explicitly drew a 1999–2000 dot-com parallel, noting the SOX was trading >40% above its 200-DMA. Today's SMH $550 LEAP put is structurally nearly identical — OTM, year-out, on a semiconductor index vehicle. Institutional tail-hedging of the AI-semi complex is now a recognizable positioning theme.
Upcoming Catalysts — The Risk Calendar Through Mid-2027
NVIDIA Q2 FY2027 Earnings — August 26, 2026 📅 Wall Street Horizon has confirmed the date. Consensus revenue per management's own guide: $91.0B ±2% (≈$89.2B–$92.8B); EPS forecast ≈$2.07. This is the single biggest binary for SMH given NVDA's 15.55% weight. Any commentary about AI-capex deceleration, hyperscaler order softness, or China export headwinds could be the catalyst that finally cracks the AI trade. The desk's $17M hedge sits directly in the window of this print.
Broadcom Q3 FY2026 Earnings — Early September 2026 📅 Broadcom guided Q3 AI revenue at $16.0B (+200% YoY) and reiterated >$100B FY2027 AI revenue. A second consecutive "in-line, not raised" print would confirm that the AI-demand parabola has flattened — a structural reset for the entire sector, not just AVGO.
Hyperscaler Q2 2026 Earnings — Late July to Early August 📅 Microsoft, Amazon, Alphabet, and Meta combined ≈$725B of capex in Q1 2026 — growing ≈80% while revenues grew ≈15.5%. Morgan Stanley projects >$400B of hyperscaler debt issuance; Amazon FCF is projected to turn negative. The Q2 capex guidance from even one major hyperscaler is a potential cascade trigger. These prints land squarely within the LEAP's window.
China H200 Shipment Resolution 📅 Commerce cleared ≈10 Chinese firms to buy NVDA H200s but deliveries remain stuck in legal limbo. NVDA's own guidance assumes zero China Data Center revenue. A re-tightening of export controls would remove an upside catalyst rather than trigger a massive new downside — but escalation remains a live tail risk within the LEAP's one-year window.
Memory-Cycle Inflection 📅 DRAM contract prices rose 58–63% QoQ and NAND 70–75% QoQ in Q2 2026 — the largest moves in a decade. SK Hynix sees the shortage lasting into late 2027. Classic late-cycle blow-off patterns end abruptly.
🎲 4-Reader Interpretation
🚀 YOLO Trader
This cross is your template, not your trade — someone already paid $17M for the exactly-right structure. But if you want to express a bearish or hedging view on the semiconductor sector, OTM LEAP puts on SMH are the vehicle. The $550 strike is "chosen intelligently" — at a key gamma shelf, with one year of time, capturing every major binary. If you want a smaller version of the same thesis, a $500 or $520 LEAP put would cost significantly less premium per contract and give you further-OTM convexity. Know going in: if SMH stays above $550, the put expires worthless — 100% loss of premium. Size this as insurance (1–3% of portfolio), not a core position. The implied vol environment means LEAPs aren't cheap right now.
📊 Swing Trader
The $600 and $590 gamma support levels are your near-term key reads. If SMH loses $600 on a close and can't reclaim it, the next stop is $590 — and a sustained break of $590 opens a faster move toward $560. The August 26 NVDA earnings is the critical catalyst for the next directional leg. For a defined-risk bearish swing, a put spread (e.g., buy the $580 put / sell the $550 put in July or August expiry) lets you target the near-term gamma support break without paying full LEAP premium. Risk: a reversal above $610 would suggest the $605 resistance is giving way and the bull leg continues.
🛡️ Premium Collector
With SMH range-bound in the $590–$605 gamma corridor, covered-call writing against existing SMH shares at the $610 strike (next resistance) in the June or July expiry can generate income while the sector consolidates. Cash-secured puts near the $590 gamma support level (June/July expiry) could also work — the gamma structure suggests market makers will defend $590 aggressively, making it a defensible put-selling level. Caution: the August 26 NVDA earnings will spike implied vol sharply — avoid running naked short premium into that event. Close or roll before August expiry approaches.
🌱 Entry-Level / Beginner
Here's the plain English version of what happened: an institution paid $17 million for the right to sell the VanEck Semiconductor ETF at $550 per share anytime between now and June 17, 2027. The ETF is trading at ≈$592 today — so the ETF has to fall ≈7% just to reach the strike, and further still for the put to be profitable net of the $83.54 premium paid. The buyer is NOT predicting a crash. They almost certainly own a large position in semiconductor stocks (or a fund holding them) that has gained a lot of value in 2026. They're paying $17M as insurance — just like you might pay for car insurance even though you don't expect to crash your car. This is called a "portfolio tail hedge." The options structure is a long LEAP put: long-dated, out-of-the-money, large premium. If SMH stays above $550 for a year, the $17M expires worthless — the "insurance premium" is paid and the book is protected. If semis have a bad year and SMH falls to $466 or below, the puts pay off and offset the losses on the underlying portfolio.
⚠️ Risk Factors
Options trading involves substantial risk of loss and is not suitable for all investors. Here are the specific risk factors for this trade and the broader semiconductor thesis:
The Hedge Could Expire Worthless — That's the Point, But Still a Risk If SMH continues to rally or stays above $550 through June 2027, the $17M premium is fully spent. For a typical retail trader, $83.54 per contract (the option price) represents a meaningful outlay per contract relative to account size — this is why "portfolio hedging" in this form is mainly an institutional activity. Don't size it as a directional trade unless you're comfortable losing 100% of premium.
AI Fundamentals Remain Genuinely Strong — This Is NOT a "Sell Everything" Signal Every major chip name beat or set records in recent quarters: NVDA +85% revenue, AVGO AI revenue +143%, TSMC raising its full-year outlook above 30%. A tail hedge is a positioning overlay, not a directional short thesis. The bull narrative on AI hardware is intact for now.
Hyperscaler Capex Sustainability — The Real Macro Risk Microsoft, Amazon, Alphabet, and Meta spent ≈$725B in Q1 2026 capex with revenues growing ≈5x slower. 80–90% of firms use AI but fewer than 40% have scaled beyond pilots — adoption is broad but shallow. Any capex-guide cut from a single hyperscaler cascades into SMH revenue estimates for every holding.
Circular Financing Risk
Over $800B in arrangements where chipmakers and clouds fund the AI startups that buy their products — with OpenAI on track to lose ≈$14B in 2026. Critics draw explicit dot-com vendor-financing parallels. Widening CDS spreads in the AI ecosystem are the early strain signal to watch.
China / Export-Control Reversal NVDA's own Q2 guide assumes zero China Data Center revenue. A re-tightening on H200 shipments is more an upside cap than new downside, but escalation into Taiwan/TSMC supply chain disruption remains a live tail risk over a 12-month window.
What the OPRA Tape CANNOT Tell Us We know the mechanism (🤝 block cross), the structure (single-leg OTM LEAP put, BTO), size (2,000 contracts), price ($83.54), and that it's a confirmed open. We do not know the buyer's identity, the size of their underlying long book, whether this is a standalone hedge or part of a larger collar/structured position, or their breakeven threshold for rolling vs holding. We interpret the tape — we don't read minds.
🎯 The Bottom Line
Here's the deal: a desk with meaningful semiconductor exposure just paid $17 million to protect one year of runway against a catastrophic drawdown on SMH — a fund up +60.6% YTD, concentrated in an industry that proved it can lose $1.3 trillion in a single session on an in-line earnings guide.
Read this trade for what it is: institutional portfolio management by someone still bullish enough on semiconductors to hold a large position, but disciplined enough to buy protection at the peak. It is not a signal that the AI trade is over. It is a signal that at ≈18% of the S&P 500, a chip sector drawdown is now a systemic risk — and one worth insuring.
What to watch:
- 📅 Late July to Early August: Hyperscaler Q2 2026 earnings — the capex sustainability stress test. Any guide-cut from Microsoft, Amazon, or Alphabet cascades directly into NVDA/SMH revenue estimates.
- 📅 August 26, 2026 (after market): NVDA Q2 FY2027 earnings — the single biggest binary for SMH. Consensus at $91.0B ±2%; any AI-capex deceleration commentary is the most probable catalyst for a drawdown through $560 and toward $550.
- 📅 Early September 2026: Broadcom Q3 FY2026 — second consecutive in-line guide (no raise) would confirm peak-cycle pricing.
- 📅 January 2027: Burry's SOXX $330 puts expiry — a key market sentiment / positioning focal point mid-window.
- 📅 June 17, 2027: SMH LEAP $550P expiration.
- ✅ June 12 OPRA OI snapshot (RESOLVED): SMH Jun-2027 $550P OI rose 127 → 2,027 (Δ +1,900 ≈ the 2,000 traded) — the full block confirmed as a fresh opening position.
If you own SMH or semiconductor stocks: The $600 and $590 gamma levels are your near-term support map. A clean hold above $600 into the August NVDA print signals the bull structure is intact. A sustained break of $590 opens the door toward $560 and tests the $550 put zone where today's hedge is positioned. The August 26 NVDA earnings is the most important date on your calendar — everything hinges on guidance language around AI capex.
If you're watching from the sidelines: The implied move data puts SMH at ±17% over the next month — a $498–$703 range. The options market is pricing real two-sided uncertainty. Patient entry on a pullback toward the $590–$600 gamma support zone, ahead of a confirmed NVDA beat, offers a better risk-adjusted entry than chasing near the $620 resistance ceiling.
If you're running a large semi book: Today's trade is your peer group telling you what they think about tail risk right now. A one-year OTM LEAP put at 7% below spot for $83.54 — roughly 14% of the current ETF price — is the cost of sleeping well through twelve months of binary events. That cost-to-protection ratio is a personal decision, but the trade size ($17M) signals this is not a casual overlay.
A $17M negotiated block cross on a year-out put, placed 8 days after a $1.3T single-session chip wipeout, the morning after SMH has added +60.6% year-to-date. Insurance isn't panic. It's discipline.
Disclaimer: Options trading involves substantial risk of loss and is not suitable for all investors. This analysis is for educational and informational purposes only and does not constitute financial advice or a recommendation to buy or sell any security. The SMH June 2027 $550 put requires SMH to fall ≈7% to reach the strike and a further ≈14% decline from strike to reach breakeven net of premium — the position can and likely will expire worthless if SMH remains above $550. Past unusual options activity does not guarantee future returns. Always conduct your own due diligence and consider consulting a licensed financial advisor before making any trading decisions. Open/close classification was confirmed by next-day OPRA open interest data (EOD June 11: OI rose 127 → 2,027, Δ +1,900 ≈ the 2,000 traded).
Last updated: June 12, 2026