🐋 SMH $16M Semiconductor Breakout Bet — Block Cross on the $620 Call into a Catalyst-Packed September
📅 June 12, 2026 | 🔥 Unusual Activity Detected
✅ Updated 2026-06-15: Next-day OPRA OI confirms the open — open interest rose 711 → 3,230 (Δ +2,519 ≈ the 2,500 traded). The long $620 call block is confirmed on the books.
🎯 The Quick Take
Someone just crossed a $16 million block of SMH $620 calls expiring September 18, 2026 — a moderately bullish, deliberate bet that the VanEck Semiconductor ETF pushes through its near-term gamma resistance before NVDA's Q2 earnings on August 26. The $620 strike sits ≈1.5% above spot right now — not a moonshot, a targeted call on a specific directional move. Three hard catalysts (NVDA S&P 500 inclusion June 22, Micron earnings June 24, NVDA Q2 earnings August 26) all land before expiration, giving this trade a packed event calendar to run on.
📊 ETF Overview
VanEck Semiconductor ETF (SMH) is the benchmark institutional vehicle for concentrated semiconductor exposure:
- AUM: ≈$70.87 billion (as of June 11, 2026)
- Sector / Industry: Technology — Semiconductors
- What it holds: The top 25 U.S.-listed semiconductor companies. Top holdings: NVIDIA (15.18%), Taiwan Semiconductor / TSMC (9.62%), Micron (7.50%), Intel (7.07%), AMD (7.00%), Broadcom (6.29%). The top six names alone represent ≈52% of the fund — this is a concentrated, AI-accelerator-dominant vehicle, not a diversified tech play.
- YTD Performance: +69% — one of the strongest ETF runs in the market in 2026, driven by the AI-infrastructure buildout across GPUs, foundry, HBM memory, and custom ASIC
- 52-Week Range: $256.05 – $642.77
- Why it matters for this trade: At ≈$611 spot with the $620 call only 1.5% OTM, the desk is not asking for a moon shot. They're positioning for a modest continuation move through gamma resistance, with three near-term catalysts serving as the engine.
💰 The Option Flow Breakdown
The Tape — June 12, 2026 @ 09:59:06: 🤝 Block Cross
| Time | Buy/Sell | Call/Put | Expiration | Premium | Strike | Volume | OI | Size | Spot | Option Price | Option Symbol |
|---|---|---|---|---|---|---|---|---|---|---|---|
| 09:59:06 | BUY | CALL | 2026-09-18 | $16M | $620 | 2,500 | 711 | 2,500 | $611.34 | $64.00 | SMH20260918C620 |
Flow type: 🤝 BLOCK CROSS — this trade was executed as a single-leg block cross. A broker matched a buyer and a seller off the open book — there is a known counterparty. The desk "crossed" this block deliberately, at a pre-negotiated price, through a facilitated off-exchange channel. This is NOT an aggressive lit-book sweep, not a desk slamming the ask in a panic. The right language for a cross is "crossed," "negotiated," "facilitated block" — not "slammed" or "swept." Weigh the open/close confirmation and strike geometry over the raw dollar headline when interpreting a cross.
✅ RESOLVED — Next-Day OI Confirms the Open (2026-06-15)
| Snapshot | Open Interest |
|---|---|
| Pre-print baseline (EOD 2026-06-11) | 711 |
| Resolving (EOD 2026-06-12) | 3,230 |
| Δ | +2,519 (≈ the 2,500 traded) |
Open interest ROSE by 2,519, matching the 2,500 contracts traded — the Sep-2026 $620 call block opened as a fresh long position. The size-vs-OI math (2,500 vs 711 prior) is confirmed: this is a new long-call position crossed with a known counterparty, BTO-confirmed.
🤓 What This Actually Means — Plain English
Let's decode this trade carefully, because the mechanism matters as much as the premium.
A $64 call on a $611 ETF — the geometry first. With SMH at $611.34, the $620 strike is ≈$8.66 out of the money — only ≈1.5% above current price. A $64 premium for a slightly-OTM call with roughly 98 days to expiration tells you two things: (1) implied volatility is elevated after the June 5 rout, and (2) the desk isn't betting on a distant moonshot — they're buying a call they expect to become in-the-money relatively soon.
The breakeven math: The desk paid $64 per share for the right to buy SMH at $620. To break even at expiration (September 18), SMH needs to close above $684 ($620 + $64). That's a ≈11.9% move from today's $611.34 spot. That said, most institutional call buyers like this are NOT planning to hold to expiration — they're playing for the call to gain value as SMH moves toward and through $620 on a catalyst, then selling the position at a profit well before expiry.
Order type: BTO — Buy to Open. Size 2,500 ≫ OI 711 — the desk opened a fresh long call position. They are now the buyer of upside, not a seller collecting premium.
Why a September expiry specifically? The timing is deliberate and elegant:
- 📅 June 22 — NVIDIA S&P 500 inclusion creates forced mechanical buying of the largest SMH holding
- 📅 June 24 — Micron (≈7.5% of SMH) fiscal earnings; sold out of HBM for several quarters, consensus expecting record margins
- 📅 August 26 — NVIDIA Q2 FY2027 earnings; the single most important print for SMH given NVDA's 15.18% weight; company guided $91.0B ±2%, Street EPS ≈$2.07
All three of these land before September 18 expiry. The desk is giving themselves three shots at a catalyst pop before the calls expire. That's disciplined construction.
Why a cross instead of a lit sweep? A cross signals the desk had a counterparty ready — a seller who was willing to sell 2,500 September $620 calls at $64. In large block trades, crossing off the open book minimizes market impact and secures price without tipping the hand to the tape. The desk got what they wanted at a negotiated price. That's not unusual for a $16M block — it's standard institutional execution.
This is a moderately bullish positioning call. Not a panic buy, not a "to the moon" YOLO. A measured, catalyst-anchored long-call position on the sector's dominant benchmark, structured to capture three specific binary events before expiry. The $620 strike sits right at the first gamma resistance wall — if any of those catalysts pops SMH through $620, the call dynamics change materially (gamma and delta both accelerate).
Confidence on the open/close call: HIGH. Size 2,500 is ≈3.5x prior OI 711 — the math is clean. Refer to the ⏳ callout above for the next-day OI confirmation.
📈 Technical Setup / Chart Check-Up
YTD Performance
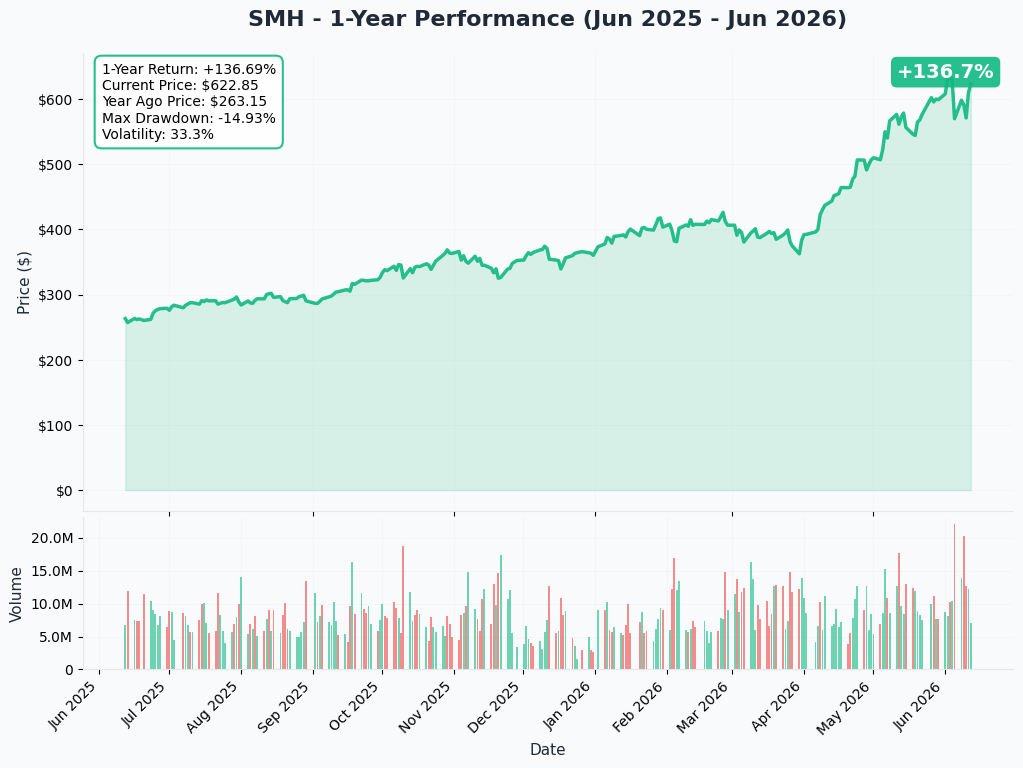
SMH is up +69% year-to-date in 2026 — one of the top ETF performers in the market, last trading around $611.34. The chart tells the story of an AI-infrastructure-driven sustained uptrend interrupted by one violent reset.
Key observations:
- 📈 +69% YTD — a run fueled by NVDA Data Center +92% YoY, TSMC +30% full-year guidance, and ≈$630–725B of confirmed 2026 hyperscaler capex (Tom's Hardware)
- ⚠️ June 5 rout: The SOX crashed >6% in a single session, erasing over $1.3 trillion in chip-sector market cap — triggered by Broadcom's AI-networking miss and a "maintained-not-raised" 2027 guide; AMD fell −10.86%, Intel −11.28%
- 📊 Recovery into June 12: SMH bounced back sharply starting June 8, aided by Jensen Huang framing the drop as a buying opportunity and anticipation of the NVDA S&P inclusion
- 🔭 Current position: Trading at $611.34, with the $620 gamma resistance wall directly overhead — the strike the desk just bought
The +69% run leaves the sector stretched. SOXX forward P/E sits near the top of its 10– and 30-year distribution and RSI has been deep in overbought territory. But "expensive" and "broken" are different things — and three packed catalysts still sit ahead of September expiry.
Gamma-Based Support & Resistance
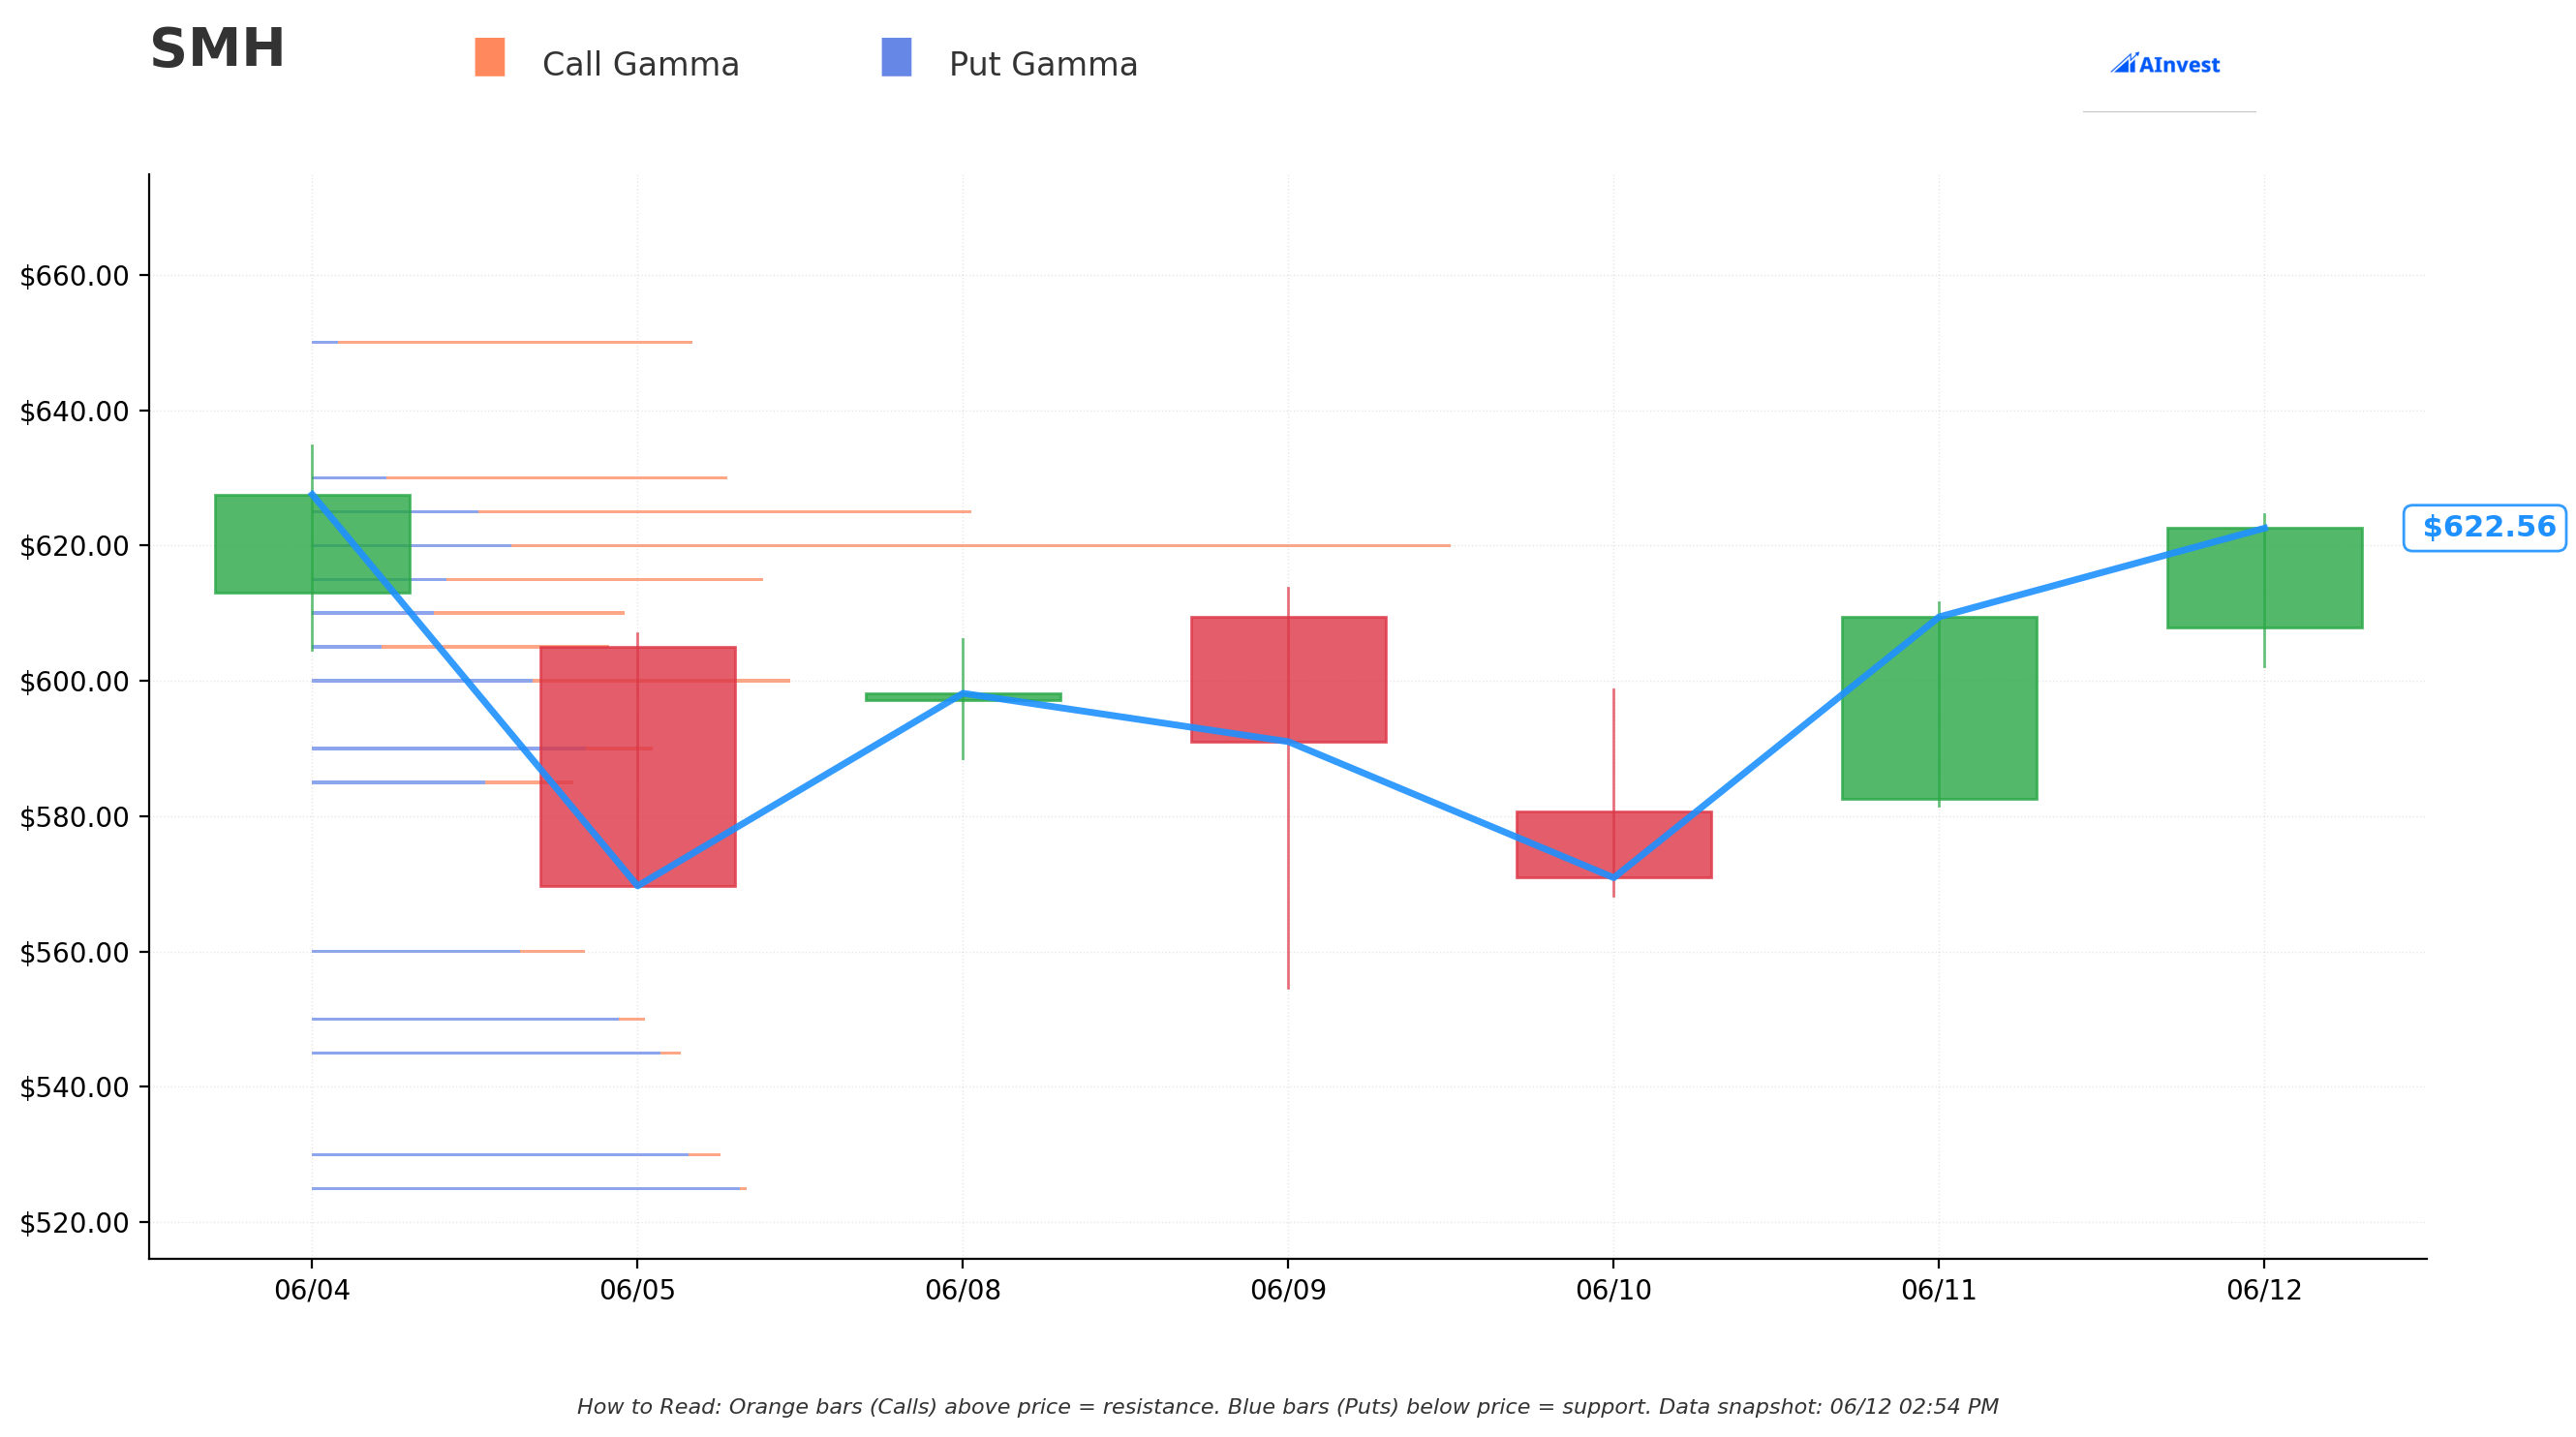
Current Spot: ≈$611.34
The gamma exposure map is particularly relevant to this trade because the $620 call strike sits directly at the first major call gamma resistance wall — the desk bought the strike the market makers are most actively hedging above.
🟠 Resistance Levels (Call Gamma Above Price):
- $620 — First Gamma Resistance Wall. This is the strike in play — the first meaningful call gamma ceiling above current spot. Market makers with short call exposure here will sell the ETF as it approaches $620, creating a sticky lid. A catalyst-driven break through $620 is the primary trigger for this call to accelerate in value. Once SMH pushes through, market-maker delta hedging flips from selling to buying, which can create a "magnetic" move through the level.
- $625 — Secondary Resistance. The next call gamma shelf above $620. A clean break of $620 would likely see SMH gravitate toward $625 as the next overhead level.
- $650 — Extended Resistance. Upper gamma ceiling for the medium-term range. A strong NVDA Q2 beat on August 26 is the most likely catalyst to test this level.
🔵 Support Levels (Put Gamma Below Price):
- $615 — Immediate Support. The first meaningful put gamma shelf just below current spot. Market makers will tend to buy dips as SMH approaches $615, cushioning short-term pullbacks.
- $610 — Secondary Support. The next put gamma cluster below $615. A break below $610 on a weak close would shift near-term momentum.
- $600 — Key Support Zone. The major round-number gamma floor, the level that held during the June 8 recovery and remains the clearest line in the sand for bulls.
Translation for this trade: The desk bought the $620 call at the exact resistance level the gamma structure identifies as the near-term ceiling. If NVDA's S&P inclusion (June 22) or Micron's earnings (June 24) push SMH through $620, the market-maker hedging dynamic flips bullish — and the call accelerates. That's the play.
Implied Move Analysis
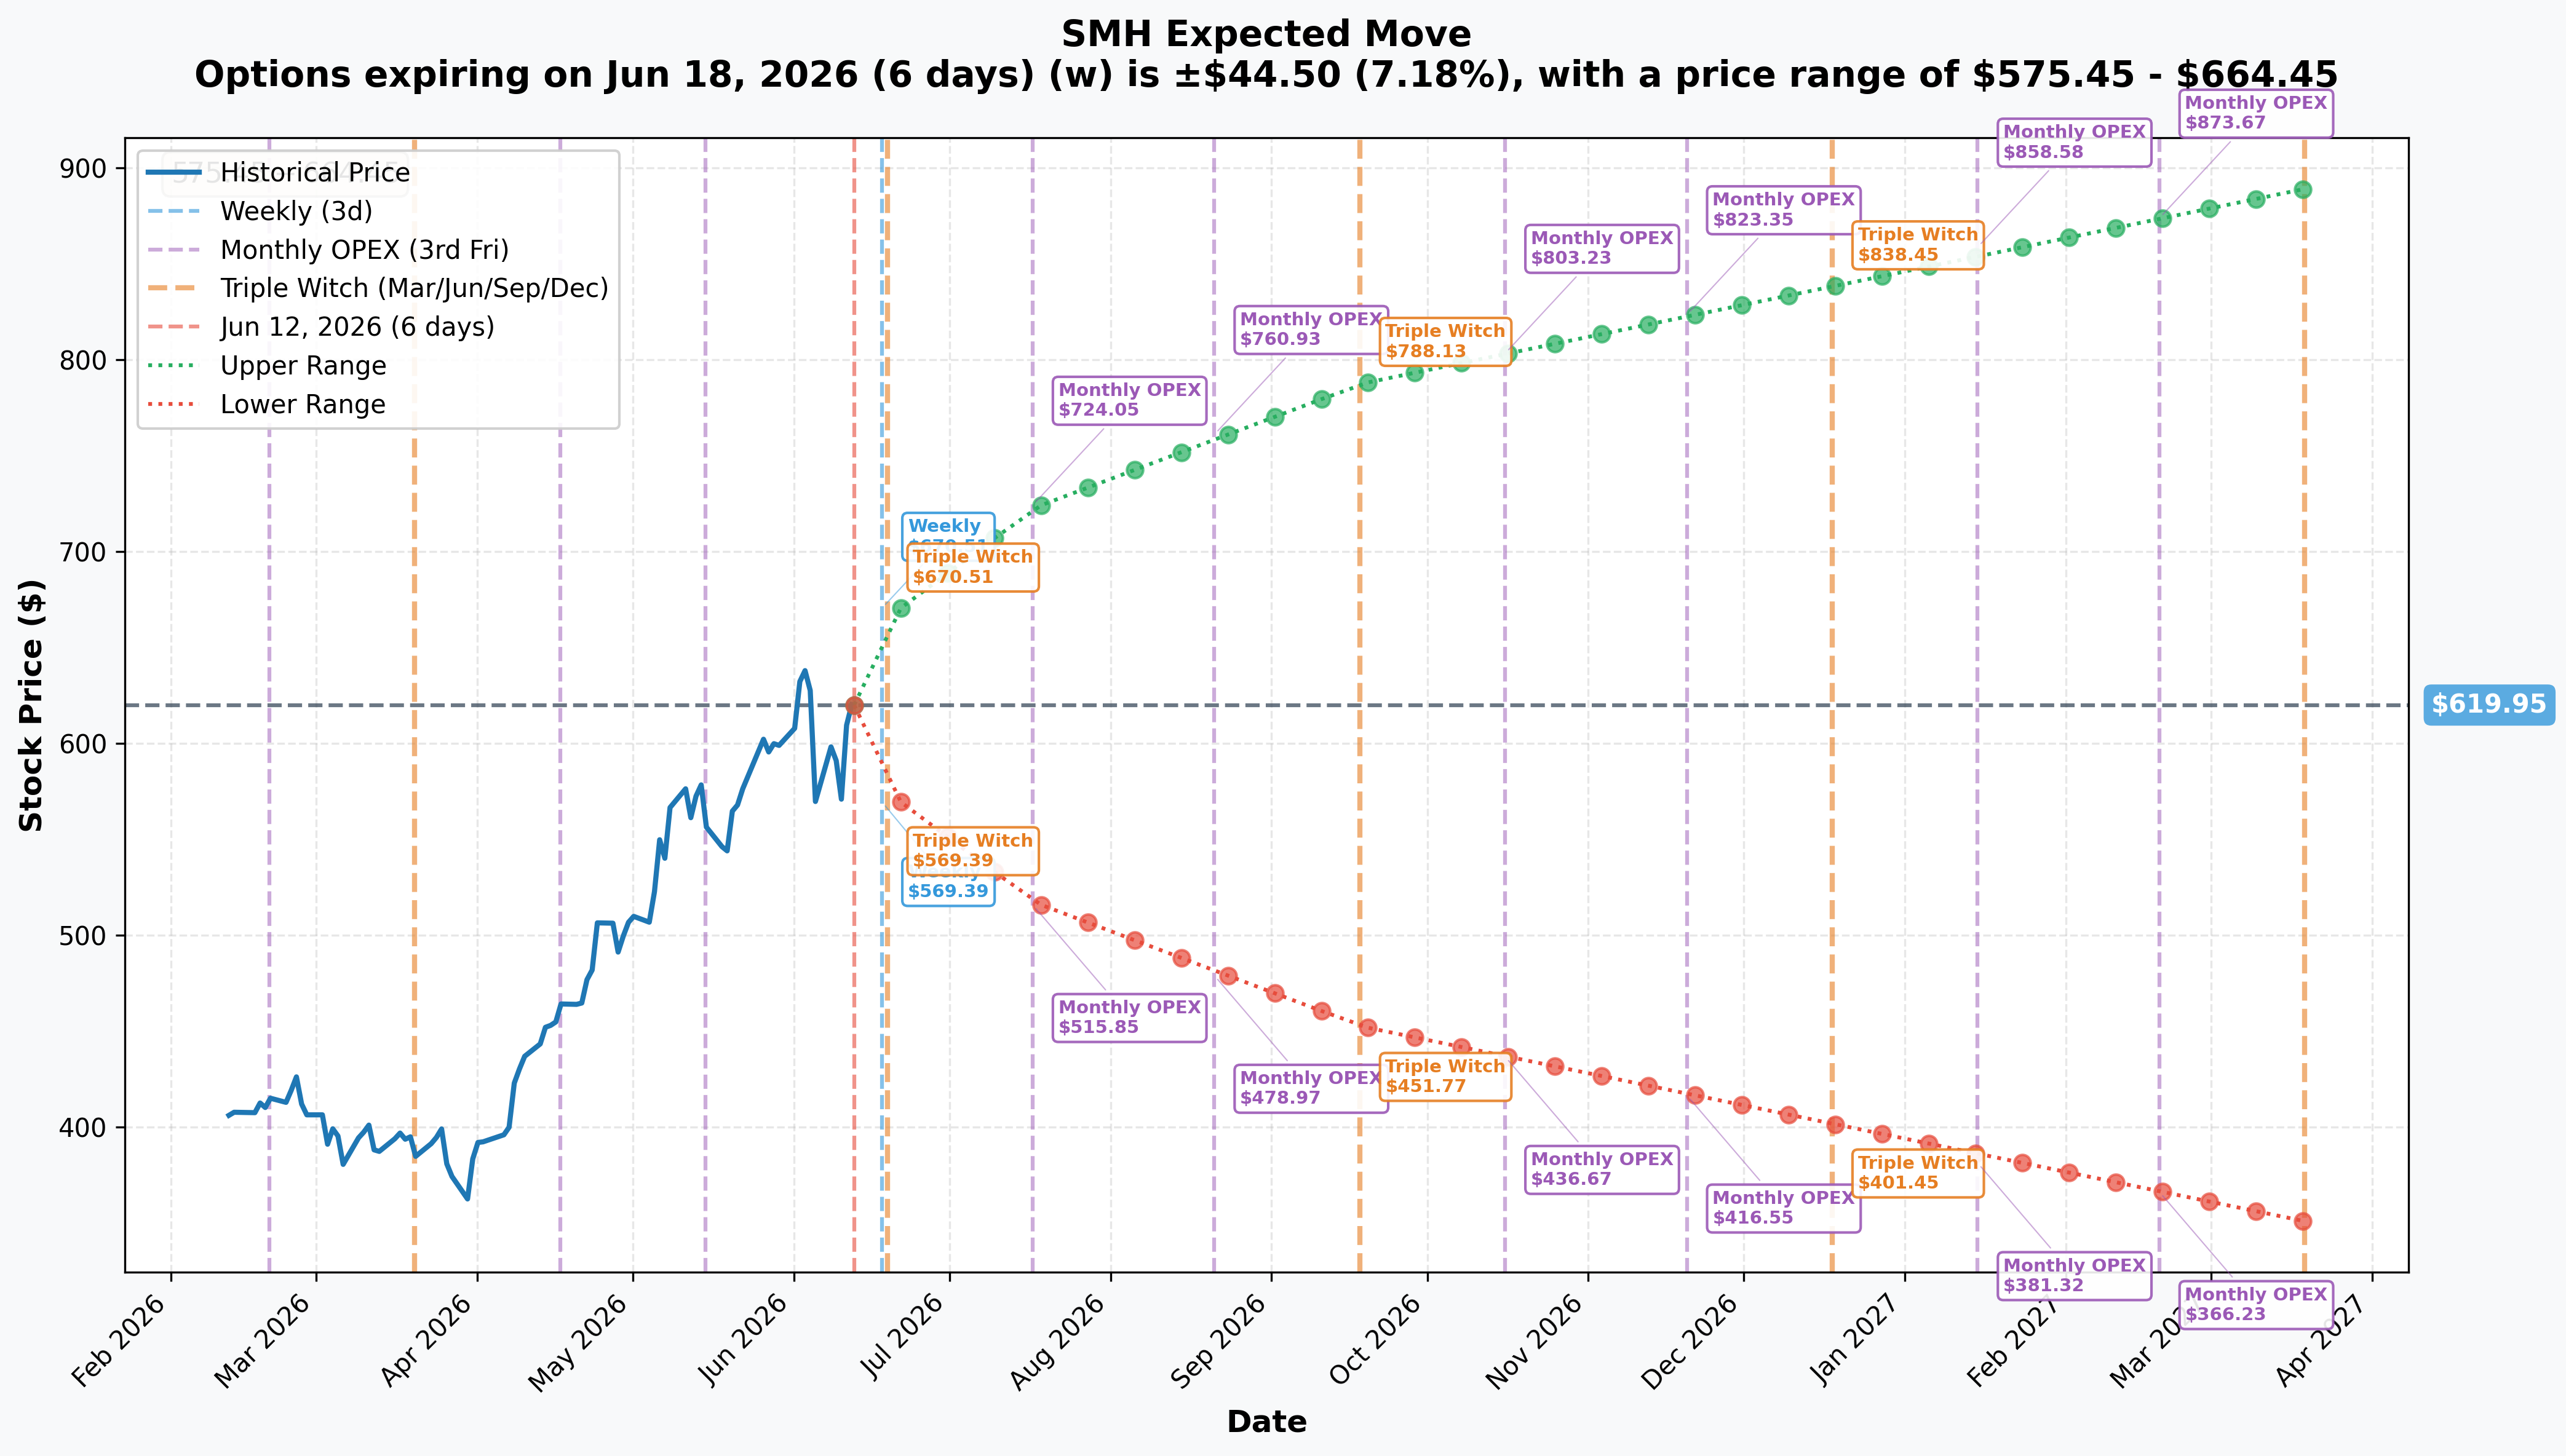
The options market is pricing in meaningful two-sided uncertainty through the September expiry — and the implied move range directly frames whether the $620 call has room to run:
- 📅 Monthly OPEX (July 17 — ≈35 days): ±16.63% → Range $516.87 – $723.03
- 📅 Quarterly / Sep-18 expiry (≈98 days): ±27.04% → Range $452.33 – $787.57
The monthly implied move upper bound of $723.03 puts the $620 strike comfortably inside the one-month probability cone. The September upper bound of $787.57 tells you the options market explicitly prices SMH trading well through $620 as a plausible outcome before the calls expire.
Put plainly: the $620 strike is NOT a lottery ticket — it sits well within the market's own priced distribution for the next 98 days. The question is whether one of the three catalysts (NVDA S&P inclusion, Micron earnings, NVDA Q2) provides the engine to get there.
🎪 Catalysts
Already Happened — The Context Behind This Trade
The June 5, 2026 Chip Rout — $1.3 Trillion Erased Semiconductor stocks lost over $1.3 trillion in market cap in a single session on June 5 — the SOX fell >6%, AMD dropped −10.86%, Intel −11.28%. The trigger: Broadcom's Q2 2026 results showed AI semiconductor revenue of $10.8 billion (+143% YoY) — genuinely exceptional — but the Q3 AI networking revenue guide of ≈$4.1B fell ≈14% short of the ≈$4.8B expected, and CEO Hock Tan maintained rather than raised the 2027 AI outlook. The sector was priced for continuous upward revisions. One in-line print and the complex went into freefall. The sharp June 8 recovery — helped by Jensen Huang publicly calling it a buying opportunity — reset SMH back toward $610–$615 and sets up today's $620 call bet.
NVIDIA Q1 FY2027 — The Print That Still Left Traders Uneasy NVDA reported Q1 FY2027 on May 20: revenue $81.6B (+85% YoY), Data Center $75.2B (+92% YoY), non-GAAP EPS $1.87. A near-perfect quarter. The company guided Q2 at $91.0 billion ±2% and authorized an $80B share buyback. Objectively bullish. Yet the stock moved cautiously. That "beat and guide up but the stock barely moved" dynamic is exactly what you see when the market is nervous about the ceiling — which is the environment where moderately bullish September call buyers step in to position for the next leg.
TSMC Q1 2026 — The Foundry Backbone TSMC reported $35.90B Q1 revenue (+58.3% net income YoY), raised its 2026 full-year guide above +30%, and set Q2 revenue guidance of $39.0–$40.2B. Capex for 2026 is $52–56B, ≈32% above 2025, with 70–80% directed to advanced nodes. TSMC is the foundry chokepoint that benefits regardless of which chip designer wins — and its strength underpins the bull case for SMH's second-largest holding.
Hyperscaler Capex — The Demand Foundation Microsoft, Amazon, Alphabet, and Meta have committed ≈$630–725B in 2026 capex, roughly 75–80% of it tied directly to AI infrastructure. Amazon alone is tracking toward ≈$200B in 2026 capital expenditures, versus $125B in 2025. This is the demand engine under every SMH constituent's revenue guide — and it remains intact.
Upcoming Catalysts — Three Hard Dates Before September 18 Expiry
1. 📅 NVIDIA S&P 500 Index Inclusion — June 22, 2026 Index-tracking funds will be forced to buy billions in NVDA shares as the stock is added to the S&P 500 — creating mechanical, non-discretionary demand for the largest SMH holding (15.18% weight). This is a structural, timing-anchored catalyst with forced buying rather than earnings guesswork. Likely to provide a near-term positive bid for SMH directly.
2. 📅 Micron (MU) Fiscal Earnings — June 24, 2026 Micron is ≈7.5% of SMH and has stated it is sold out of HBM for several quarters — its entire 2026 HBM capacity was booked under binding contracts before the year began. Consensus is ≈$33.5B revenue at ≈81% gross margins. MU has already begun volume shipments of HBM4 36GB 12-high, aligned with NVIDIA's Vera Rubin roadmap. A clean beat here directly validates the AI-memory trade and removes one of the June 5 selloff narratives (the "deepening memory-chip crisis"). MU is up ≈70% in 2026 — and a strong print on June 24 is a two-week runway for SMH to test $620 before NVDA earnings.
3. 📅 NVIDIA Q2 FY2027 Earnings — August 26, 2026 (the big one) NVDA Q2 earnings land August 26 — roughly 3 weeks before the September 18 expiry of this call. Consensus: $91.0B ±2% revenue, Street EPS ≈$2.07. Key watch items: Blackwell/Blackwell-300 ramp, gross-margin trajectory, any restoration of China H20 revenue, and whether the data-center run-rate re-accelerates above the $75.2B Q1 baseline. This is the single biggest binary for SMH given NVDA's 15.18% weight. A beat-and-raise would almost certainly break SMH through $620 and toward the $625–$650 gamma resistance zone — leaving the call well in the money with 3 weeks still on the clock. A miss or in-line-not-raised print replicates the June 5 dynamic and likely sends the call toward zero.
4. 📅 Broadcom Q3 FY2026 Earnings — Early September 2026 AVGO guided Q3 AI revenue at $16.0B (+200% YoY). The June 5 selloff was triggered by AVGO's guide meeting but not raising expectations — a second consecutive in-line guide with no raise would confirm the AI-networking parabola has flattened. This print lands just before the September 18 expiry — a potential late-cycle catalyst that could send SMH in either direction in the final two weeks of the call's life. Call holders should be watching AVGO's September print closely.
🎲 4-Reader Interpretation
🚀 YOLO Trader
The desk bought 2,500 contracts — $16M notional — for a strike only 1.5% above spot with three catalysts in the window. This is the aggressive version of a "catalyst call" — buying OTM calls ahead of a known binary event (NVDA Q2 on Aug 26 is the whale catalyst). If you want a smaller version of the same thesis, the SMH Sep-18 $620C at ≈$64 per contract gives you identical leverage with defined max loss (100% of premium if SMH closes below $620 at expiry). A closer strike (like the $615C) gives you faster delta response but less leverage; a further strike (like $630C or $640C) costs much less but needs a bigger move. Know going in: if NVDA's Aug 26 print is in-line-not-raised (the June 5 scenario), this call likely goes to near zero fast. Size it as a catalyst bet, not a core position.
📊 Swing Trader
Your near-term map is the $615/$620 gamma zone. A clean close above $615 with follow-through through $620 on a catalyst (NVDA inclusion June 22, Micron June 24) would be the confirmation signal that the gamma resistance is giving way. For a defined-risk swing, a call debit spread (e.g., buy Sep $620C / sell Sep $650C) captures the upside move while cutting premium outlay — you sacrifice upside above $650 but the net cost is a fraction of a naked call. The $620/$650 spread costs less, and your max profit is the $30 spread width. If SMH is struggling to hold $610 into June 22, a step back and re-entry closer to the $600 gamma support offers better risk/reward.
🛡️ Premium Collector
With SMH grinding toward the $620 gamma wall, covered-call writing against existing SMH shares at the $625 strike (July or August expiry) collects premium while the ETF consolidates below resistance. Cash-secured puts near the $600–$610 gamma support zone can also generate income — market makers are defending those levels aggressively. Critical warning: the August 26 NVDA earnings will spike implied volatility sharply going into the print — avoid running naked short premium into that binary. Close or roll short premium positions before August expiry approaches, or use a spread to cap your risk on the August print.
🌱 Entry-Level / Beginner
Here's the plain English version: the desk paid $16 million for the right to "own" SMH at $620 per share anytime up to September 18, 2026. The ETF is at ≈$611 today — so SMH needs to move up ≈1.5% just to reach the strike, and up ≈11.9% (to $684) for the calls to be profitable net of the $64 premium. The buyer thinks three upcoming events — NVIDIA joining the S&P 500 (June 22), Micron's earnings (June 24), and NVIDIA's Q2 earnings (August 26) — have a good chance of pushing SMH up enough for the call to gain in value. If all three go well and SMH rallies to $640 before expiry, the calls could be worth ≈$20–$30 per contract as a rough illustration — that's a meaningful gain on the $64 paid. If semis sell off or NVDA disappoints on Aug 26, the call loses value fast. The "block cross" tag means a real buyer AND a real seller both agreed on this price — it's not one trader shouting at the market.
⚠️ Risk Factors
Options trading involves substantial risk of loss and is not suitable for all investors. Here are the specific risks for this trade and the semiconductor setup:
The "Priced for Perfection" Problem — The June 5 Lesson Broadcom's Q2 results were objectively excellent (+48% YoY revenue, AI revenue +143% YoY) — yet the sector erased $1.3T in a day because one guide line was in-line instead of raised. The exact same risk applies to NVDA's August 26 print. If Jensen delivers $91B but doesn't raise the Q3 guide meaningfully, based on how the market treated Broadcom, SMH could retreat sharply — and the Sep-18 $620 calls would lose most of their value with 3 weeks left on the clock.
Valuation Stretch SOXX forward P/E sits near the top of its 10– and 30-year range. MarketBeat's consensus analyst target of $614.82 implies only marginal upside from current spot. "Expensive" sectors can stay expensive — but they also mean-revert aggressively when sentiment shifts. With overbought RSI readings on SMH and most top holdings, a catalyst disappointment has amplified downside in a frothy tape.
China / Export-Control Overhang NVDA disclosed a $4.5B Q1 FY2026 charge on H20 inventory and ≈$8B of foregone orders due to export restrictions. NVDA's own Q2 guide assumes zero China Data Center revenue. Any re-tightening of export controls caps the upside catalyst from a China deal, while escalation toward TSMC/Taiwan supply-chain risk is the live tail risk over this option's 98-day window.
Micron June 24 — A Known Unknown Micron is sold out of HBM and consensus is at ≈$33.5B revenue. A beat is largely expected — which means a miss, or a guide that spooks on smartphone demand or DRAM pricing, could trigger the next sector-wide flush right after the NVDA S&P inclusion euphoria fades. MU is ≈7.5% of SMH — enough to move the ETF meaningfully.
Hyperscaler Capex Sustainability Combined 2026 hyperscaler capex of ≈$630–725B is growing ≈5x faster than revenues. 80–90% of firms use AI but fewer than 40% have scaled beyond pilots — the adoption is broad but shallow. Any single hyperscaler trimming Q3 capex guidance in its late-July earnings cascades directly into NVDA/SMH revenue estimates.
What the OPRA Tape CANNOT Tell Us We know the mechanism (🤝 block cross, single-leg), the structure (long September $620 call, BTO), size (2,500 contracts), price ($64 per share), and that size ≫ OI makes this almost certainly a fresh open. We do NOT know: the buyer's identity, whether this is a standalone directional bet or part of a larger collar or spread, whether the seller (the known counterparty on the cross) is a market maker or another institution, or the desk's specific price target. We read the tape — we cannot read minds.
🎯 The Bottom Line
Here's the deal: a desk just crossed a $16 million block of September $620 calls on SMH — a moderately bullish, catalyst-targeted bet that the semiconductor sector's benchmark ETF breaks through its first gamma resistance wall before three hard event dates: NVDA S&P inclusion June 22, Micron earnings June 24, and NVDA Q2 earnings August 26.
This is not a "sky is the limit" call. It's a focused event-driven long on a sector that's up +69% YTD, just bounced from a sharp selloff, and has the most important quarterly earnings event in the market landing 3 weeks before expiry.
What to watch:
- 📅 June 22 — NVIDIA S&P 500 Index Inclusion: Forced mechanical buying of NVDA — the ETF's top holding. A structural bid for SMH in the days leading up to and including the inclusion date.
- 📅 June 24 — Micron Fiscal Earnings: The HBM-memory read-through. A beat from MU clears the last remaining June 5 selloff narrative and gives SMH a two-week runway to test $620 ahead of NVDA.
- 📅 August 26 — NVIDIA Q2 FY2027 Earnings: The marquee event — consensus $91.0B ±2% revenue. A beat-and-raise sends SMH through $620 and into the $625–$650 gamma zone with the calls well in the money. An in-line-not-raised prints the June 5 script all over again.
- 📅 Early September — Broadcom Q3 FY2026: AVGO guided Q3 AI revenue at $16.0B (+200% YoY). A beat-and-raise here would add a final tailwind in the last two weeks of the call's life. A repeat maintained-not-raised outcome would test the $615–$610 support zone.
- 📅 September 18 — SMH Sep-18 $620C Expiry: The clock on these calls. Everything resolves here.
- ⏳ Tomorrow pre-market (≈06:30 ET) — Next-Day OI Confirmation: Expected: SMH Sep-18 $620C OI rises from 711 to ≈3,200 (Δ ≈+2,500). That confirms the full block as a clean fresh opening position.
If you own SMH or semiconductors: The $620/$625 gamma resistance zone is your near-term ceiling to watch. A clean catalyst-driven close above $620 (especially post-NVDA inclusion) shifts the gamma structure bullish and signals the next leg up toward $650. A failure to hold $610 would put $600 back in play as the key support level.
If you're watching from the sidelines: The June 24 Micron print is a lower-risk entry signal — if MU beats and SMH holds above $615 in the session, the September call thesis looks intact and the next major catalyst (NVDA Aug 26) is still 8 weeks away. The implied move data prices a $516–$723 range for July — patience around $600–$610 support before chasing into gamma resistance offers better risk/reward than buying the headline today.
If you're a skeptic: The June 5 selloff happened on record-good earnings. The market is priced for perfection, and analyst consensus targets at $614.82 imply the stock has already priced in most of the good news. The same catalyst that the call buyer is counting on (NVDA Aug 26) is equally capable of triggering another $1.3T-scale selloff if the guide disappoints. The $64 premium represents about 10% of SMH's current share price — that's not a cheap call.
A $16M negotiated block cross on September $620 calls, placed 7 days after a $1.3T single-session chip wipeout, with three hard catalysts packed into the next 98 days. Moderately bullish. Deliberately timed. Watching $620 like a hawk.
Disclaimer: Options trading involves substantial risk of loss and is not suitable for all investors. This analysis is for educational and informational purposes only and does not constitute financial advice or a recommendation to buy or sell any security. The SMH September 18, 2026 $620 call requires SMH to rise ≈1.5% to reach the strike and a further ≈10.3% above the strike to break even net of premium at expiration — the position can and will expire worthless if SMH closes below $620 on September 18, 2026. Past unusual options activity does not guarantee future returns. Open/close classification is based on tape-verified size (2,500) vs prior OI (711) — next-day OPRA OI snapshot (expected pre-market June 13) is the definitive confirmation. Always conduct your own due diligence and consider consulting a licensed financial advisor before making any trading decisions.
Last updated: June 12, 2026
Last updated: 2026-06-15 — next-day OPRA OI resolved the open (OPEN confirmed).