🎯 SPY Massive $42M Complex Calendar Spread - Smart Money Year-End Positioning! 📊
📅 December 30, 2025 | 🔥 Unusual Activity Detected
🎯 The Quick Take
Someone just deployed a $42.4 MILLION complex calendar spread structure on SPY at 13:33 today - a sophisticated 4-leg position spanning this week and next week's expiration. This isn't a simple directional bet, it's an institutional-grade volatility and calendar spread play executed with military precision across 151,000 total contracts at spot $687.80. Translation: Professional money is positioning for specific near-term price action into the new year while managing risk through the holiday period!
📊 ETF Overview
SPDR S&P 500 ETF Trust (SPY) is the world's largest and most liquid ETF, tracking the S&P 500 Index:
- Assets Under Management: $718-726 billion (world's most traded ETF)
- Current Price: $687.85 (near all-time high of $690.38 from Dec 24)
- 52-Week Range: $481.80 - $691.66
- YTD Performance: +17.8% to +19%
- Expense Ratio: 0.09%
- Dividend Yield: ~1.06%
- Primary Holdings: Tracks 500 largest U.S. companies, heavily weighted toward Magnificent 7 tech stocks (34% of index)
💰 The Option Flow Breakdown
The Tape (December 30, 2025 @ 13:33:19):
| Time | Symbol | Side | Buy/Sell | Type | Expiration | Premium | Strike | Volume | OI | Size | Spot | Option Price |
|---|---|---|---|---|---|---|---|---|---|---|---|---|
| 13:33:19 | SPY | ASK | BUY | CALL $693 | 2026-01-09 | $11M | $693 | 45K | 1.5K | 44,166 | $687.80 | $2.41 |
| 13:33:19 | SPY | BID | SELL | CALL $701 | 2026-01-09 | $2M | $701 | 44K | 1.8K | 44,166 | $687.80 | $0.46 |
| 13:33:19 | SPY | BID | SELL | CALL $678 | 2026-01-02 | $23M | $678 | 22K | 42K | 22,083 | $687.80 | $10.50 |
| 13:33:19 | SPY | ASK | BUY | CALL $687 | 2026-01-02 | $6.4M | $687 | 40K | 43K | 22,083 | $687.80 | $2.90 |
Total Premium: $42.4M
🤓 What This Actually Means
This is a COMPLEX CALENDAR/DIAGONAL SPREAD - one of the most sophisticated options structures used by institutional traders! Here's the breakdown:
Near-Term Weekly Leg (Jan 2 expiration - 3 days away):
- 💸 SOLD 22,000 contracts of $678 calls for $23M premium (in-the-money, collecting massive premium)
- 📈 BOUGHT 40,000 contracts of $687 calls for $6.4M premium (at-the-money, delta hedge)
- 🎯 Net credit on this weekly spread: $16.6M collected
Longer-Dated Weekly Leg (Jan 9 expiration - 10 days away):
- 📈 BOUGHT 45,000 contracts of $693 calls for $11M premium (out-of-the-money)
- 📉 SOLD 44,000 contracts of $701 calls for $2M premium (far out-of-the-money)
- 💰 Net debit on this spread: $9M paid
Net Position Cost: $16.6M collected - $9M paid = $7.6M NET CREDIT received
What's really happening here:
This trader is executing a sophisticated volatility arbitrage play:
- 🎢 Calendar spread component: Selling near-term premium (high theta decay over 3 days into year-end) while buying longer-term options (10 days, capturing more gamma/vega)
- 📊 Diagonal spread structure: Different strikes create directional bias - they want SPY to move UP but in a controlled range
- ⏰ Time decay monetization: The Jan 2 short calls decay FAST (3 days = massive theta burn), while Jan 9 longs decay slower
- 💎 Volatility play: If volatility drops into year-end (typical), near-term options lose value faster than long-term
Ideal scenario for this trade:
- 📈 SPY rallies moderately to $690-695 range by Jan 2 (the short $678 calls expire worthless or with minimal loss, the $687 longs profit)
- 🚀 Then SPY continues to $693-700 by Jan 9 (the $693 longs print, the $701 shorts stay out-of-the-money)
- 💤 Volatility remains subdued through holiday period
- 📉 Time decay works in their favor on the net short gamma position
Unusual Score: 🔥 EXTREME - The complexity and scale of this multi-leg structure is EXTREMELY unusual. The Jan 2 short call trade alone has a Z-score of 1.99, while the Jan 9 legs show Z-scores of 226.72 and 159.79 (EXTREMELY UNUSUAL). This is institutional desk activity, not retail.
📈 Technical Setup / Chart Check-Up
YTD Performance Chart
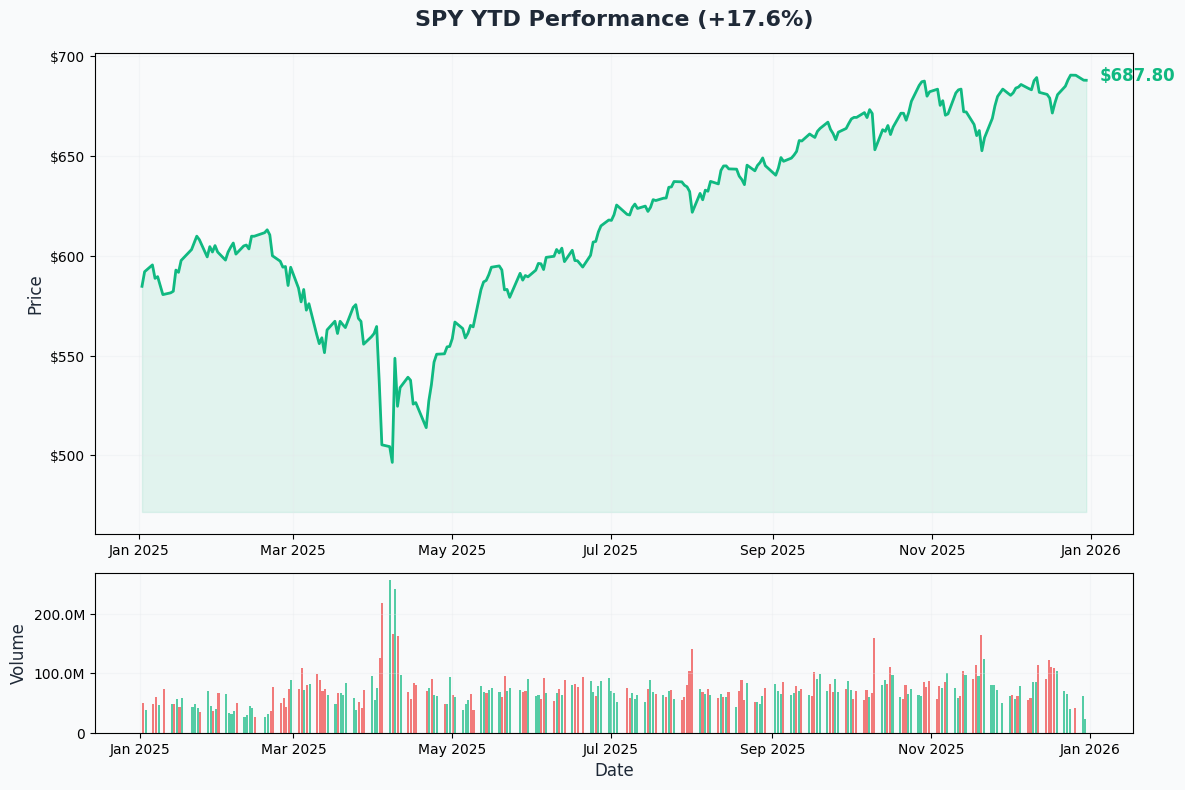
SPY has delivered a strong +17.8% to +19% return in 2025, recovering from April's sharp tariff-induced selloff. The ETF hit an all-time high of $690.38 on December 24, just 6 days ago, before pulling back slightly to current levels around $687.85.
Key observations:
- 🎯 Near all-time highs: Trading just 0.4% below record levels set last week
- 📈 Strong year-end rally: Up significantly from $481.80 yearly low in April during tariff crisis
- 🎢 Volatility spike recovery: April 3 saw -4.88% drop, followed by April 9's historic +9.52% rally (largest since 2008)
- 💪 Resilient uptrend: Multiple pullbacks bought aggressively throughout Q3 and Q4
- 🎄 Santa Claus rally window: Currently in the traditional Santa rally period (Dec 24 - Jan 3)
Gamma-Based Support & Resistance Analysis
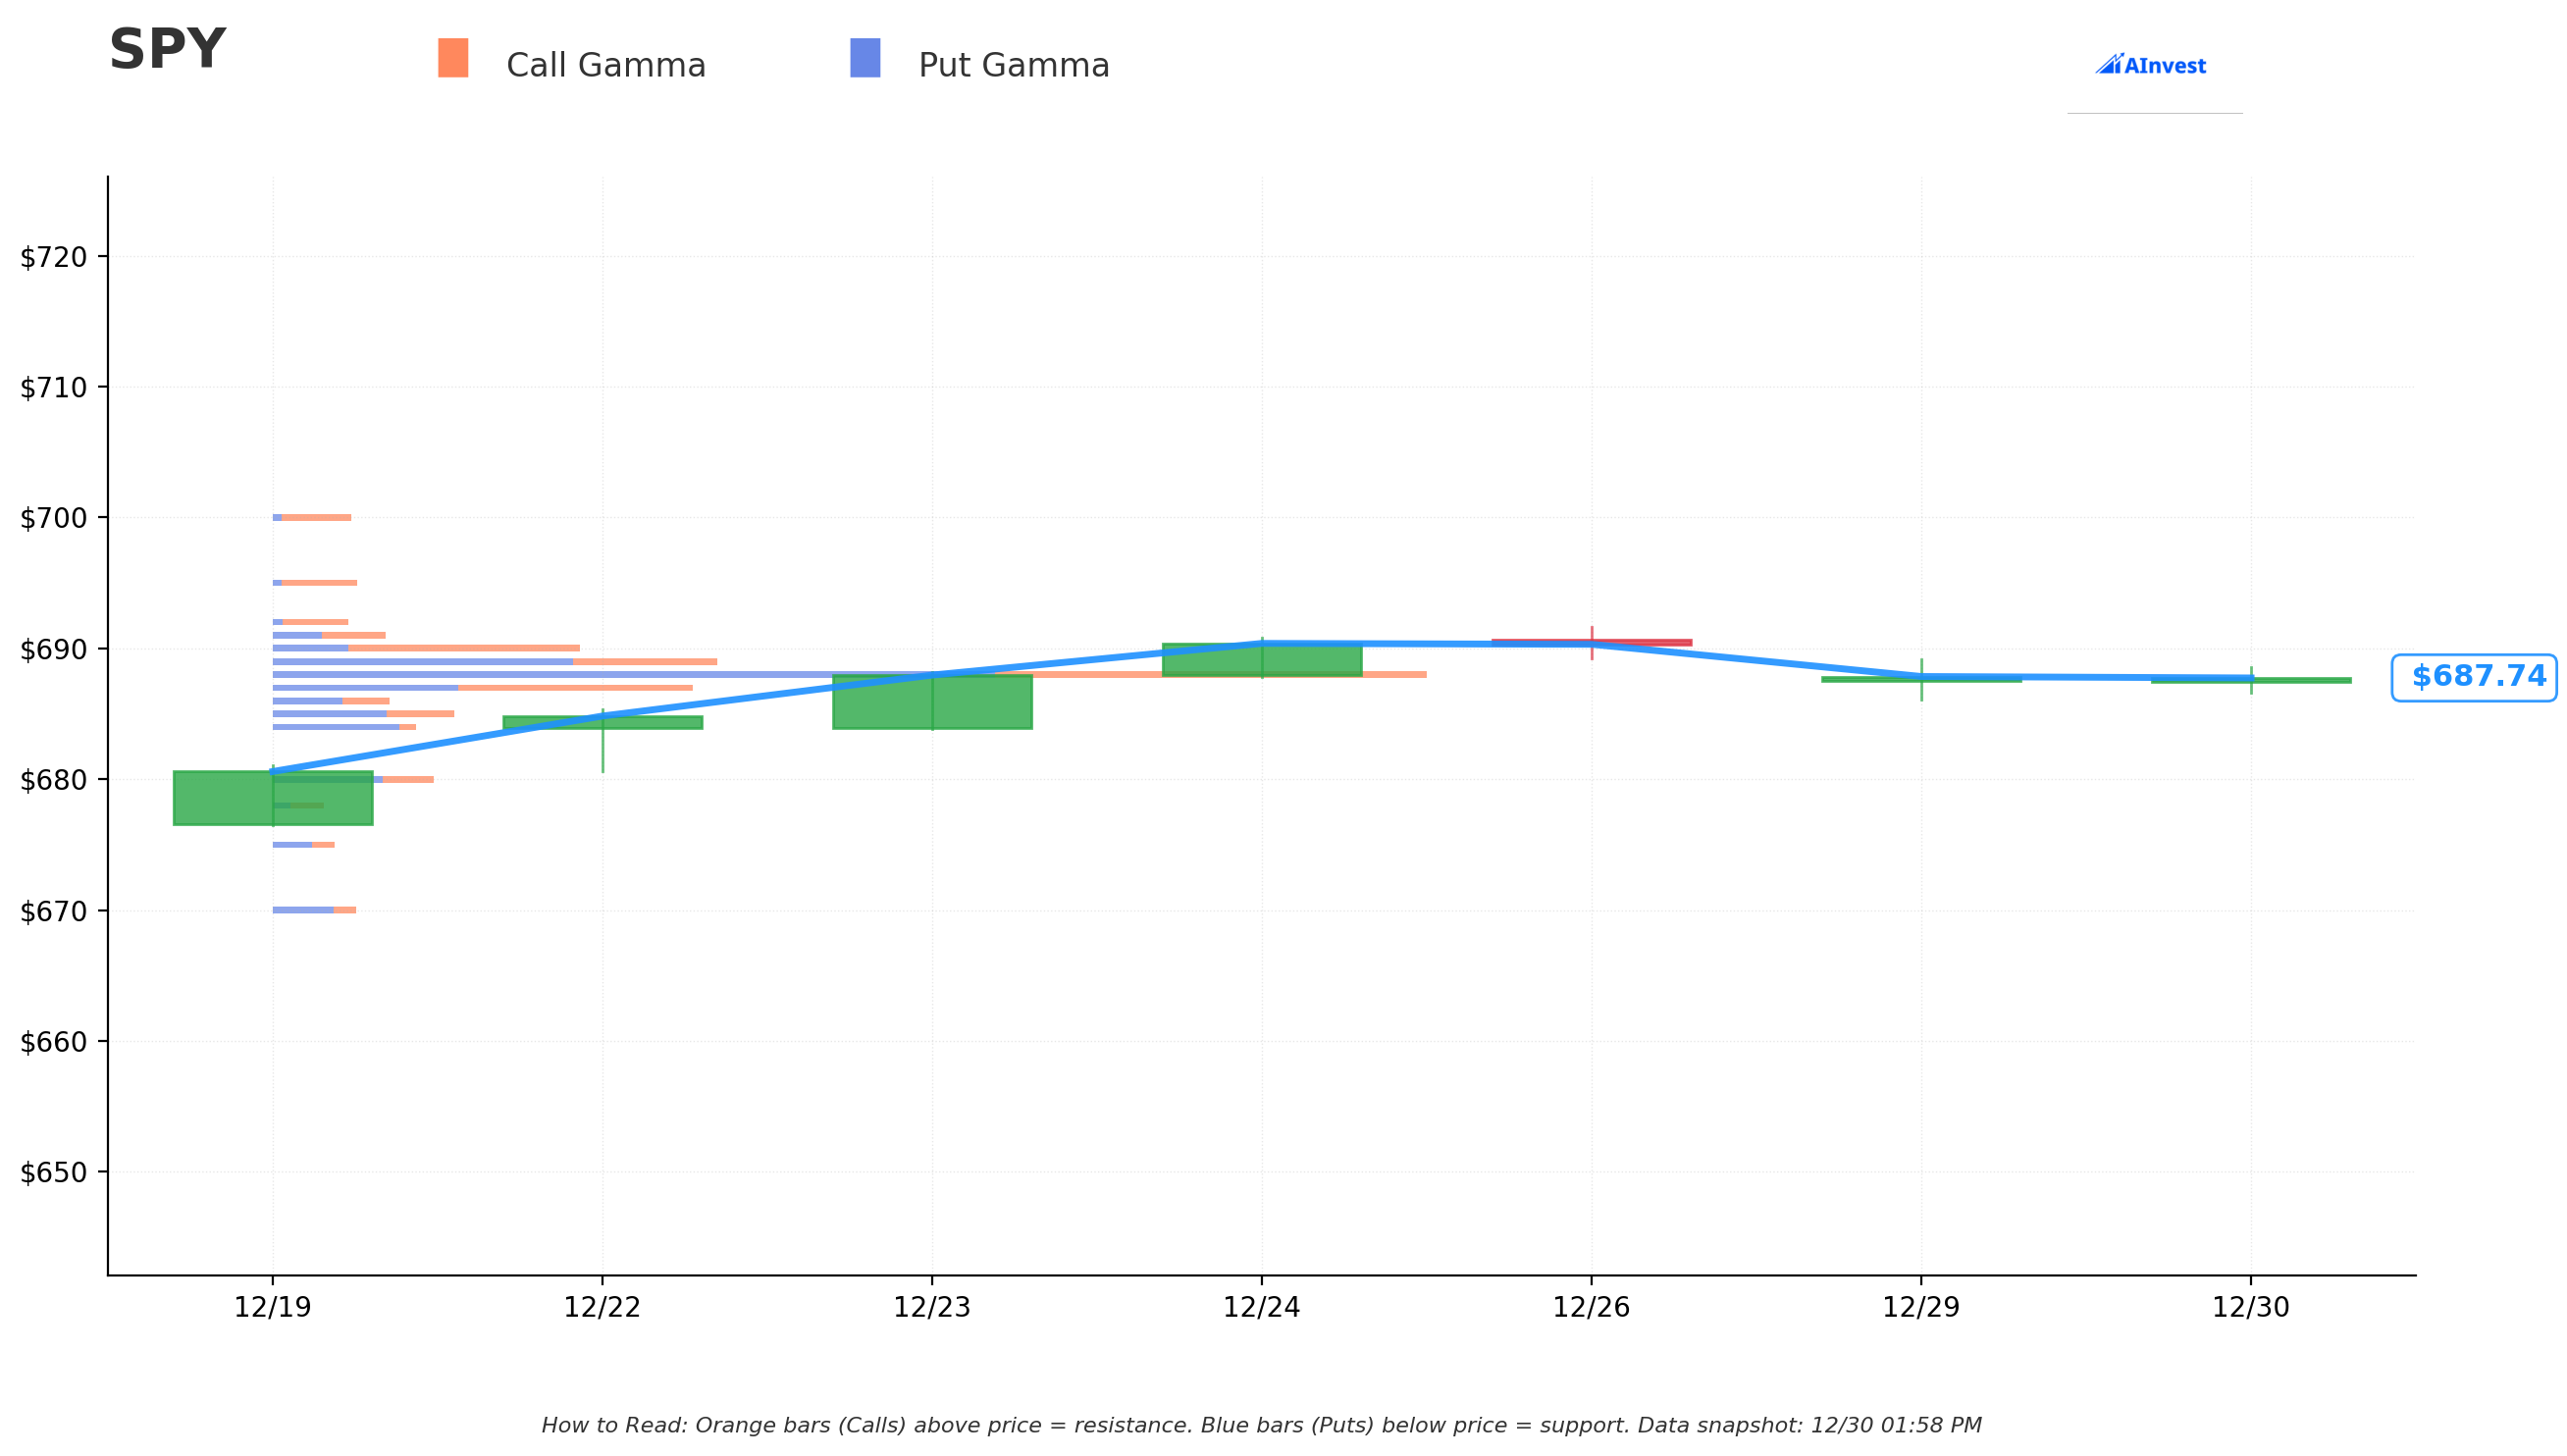
Current Price: $687.78
The gamma exposure map reveals EXTREMELY tight price compression with massive positioning right at current levels:
🔵 Support Levels (Put Gamma Below Price):
- $687 - STRONGEST IMMEDIATE SUPPORT with 938.8B total gamma exposure (this is HUGE - the single largest support level!)
- $685 - Secondary support at 407.3B gamma (solid floor just $2.80 below)
- $680 - Major structural floor with 361.0B gamma (1% below current price)
- $678 - Deep support at 111.4B gamma (exactly where the short call is struck! Not coincidental)
- $675 - Extended support zone with 137.8B gamma
- $670 - Disaster floor at 187.4B gamma (2.6% below)
🟠 Resistance Levels (Call Gamma Above Price):
- $688 - CRUSHING OVERHEAD RESISTANCE with 2,736.7B gamma (by FAR the strongest level - MASSIVE wall!)
- $689 - Secondary resistance at 1,027.2B gamma (barrier just $1.22 above)
- $690 - Additional ceiling at 698.2B gamma (near recent ATH)
- $691 - Extended resistance at 260.0B gamma
- $693 - Major upside target at 102.6B gamma (exactly where the long call is struck!)
- $695 - Additional ceiling at 190.9B gamma
- $700 - Round number magnet with 177.2B gamma
- $701 - Far resistance at 15.3B gamma (where the short call is struck!)
What this means for traders:
SPY is trading in an INCREDIBLY tight range between massive $687 support and crushing $688 resistance. The gamma data shows the market is PINNED here with enormous positioning:
- The $688 level with 2,736.7B gamma is the SINGLE LARGEST resistance point - 3X larger than any other level!
- This creates natural mechanical selling as price approaches $688 (market makers hedging their massive call exposure)
- The $687 support with 938.8B gamma is equally impressive - it's the strongest support level and just $0.78 below current price
- This setup screams "consolidation range" into year-end - very difficult to break out of this $687-$688 band
Notice the trade structure alignment:
- 📍 SHORT $678 call sits at support level (111.4B gamma) - betting this holds as floor for Jan 2
- 📍 LONG $687 call sits RIGHT at current price/strongest support - maximum sensitivity to any upward move
- 📍 LONG $693 call sits at upper gamma level (102.6B) - betting price can reach this by Jan 9
- 📍 SHORT $701 call sits above significant $700 resistance - betting price stays contained below here
Net GEX Bias: Heavily Bullish (call gamma dominates) - Market makers are net short calls, which creates upward pressure as they hedge by buying stock when price rises. But the $688 wall is a formidable barrier that requires volume to overcome.
Implied Move Analysis
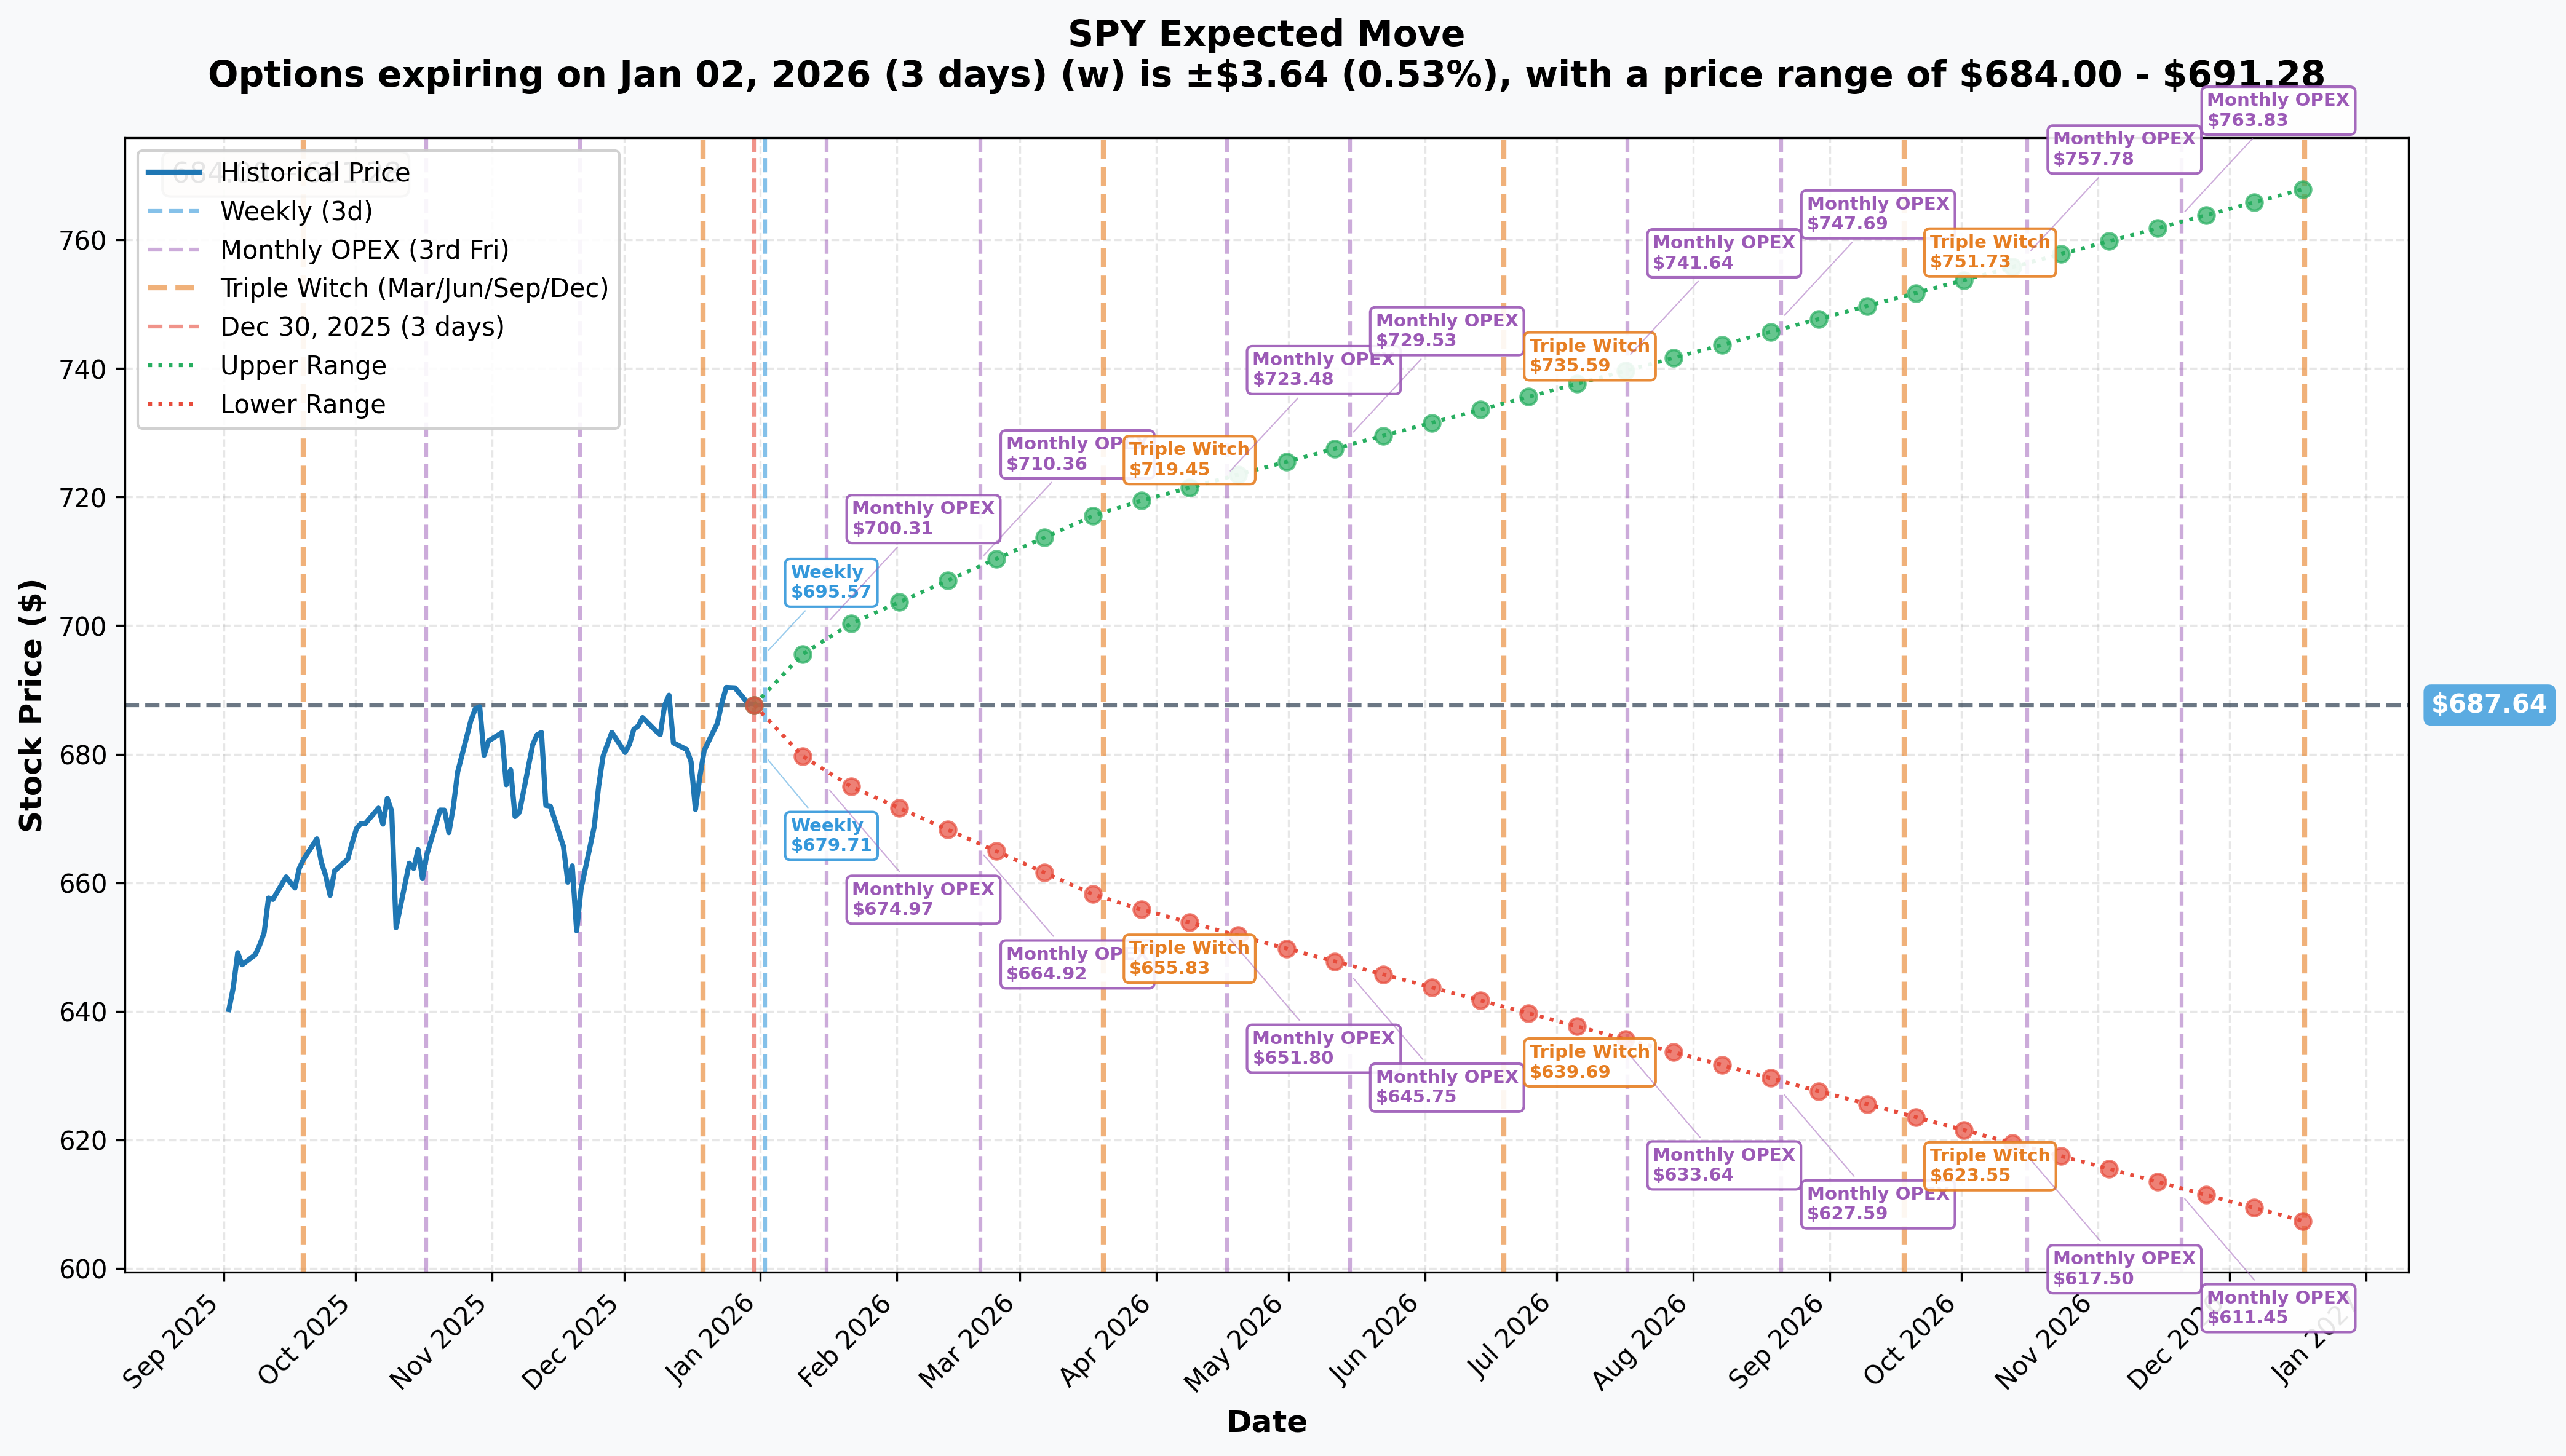
Options market pricing for upcoming expirations:
- 📅 Weekly (Jan 2 - 3 days): ±$3.64 (±0.53%) → Range: $684.00 - $691.28
- 📅 Monthly OPEX (Jan 16 - 17 days): ±$11.15 (±1.62%) → Range: $676.49 - $698.79
- 📅 Quarterly Triple Witch (Mar 20 - 80 days): ±$30.34 (±4.41%) → Range: $657.30 - $717.98
- 📅 Yearly LEAPS (Dec 18, 2026 - 353 days): ±$80.41 (±11.69%) → Range: $607.23 - $768.05
Translation for regular folks:
Options traders are pricing in a TINY $3.64 move (just 0.53%) by January 2 expiration - that's EXTREMELY low volatility for a 3-day period! This reflects:
- 🎄 Holiday market dynamics: Thin trading volumes between Christmas and New Year's typically = low volatility
- 💤 Year-end positioning complete: Most institutions already set for year-end, minimal rebalancing expected
- 📊 No major catalysts: No Fed meetings, economic data, or earnings between now and Jan 2
- 🎯 Range-bound expectations: Market expects SPY to stay in tight $684-691 band
The slightly wider Jan 16 implied move of ±$11.15 (1.62%) reflects:
- 📅 January 9 employment report (critical labor market data)
- 📊 January 13 December CPI (first clean inflation reading post-shutdown)
- 🏦 January 27-28 FOMC meeting anticipation building
- 📈 Early 2026 positioning and "January effect" dynamics
Key insight for the option spread:
The narrow implied move of just 0.53% through Jan 2 is PERFECT for this calendar spread structure! Here's why:
- The short $678 calls ($9.80 in-the-money) have very high probability of staying profitable if SPY only moves ±$3.64
- The structure profits from LOW volatility into year-end (volatility crush)
- The trader is essentially betting the market stays quiet through Friday, then potentially makes its move next week
- The $7.6M net credit collected provides cushion against adverse moves
🎪 Catalysts
🔥 Immediate Catalysts (Next 7 Days)
Year-End Market Dynamics (December 30 - January 3, 2026)
The market is currently in the Santa Claus rally period, which runs from December 24 through January 3, 2026. This is one of the most reliable seasonal patterns in markets:
- 📊 Historical success rate: S&P 500 has rallied 78% of years during this period since 1950
- 💰 Average return: +1.3% during Santa rally window
- ⚠️ Recent failures: 2023 and 2024 both saw losses; consecutive failed rallies are rare (only 1993-94, 2015-16 precedents)
- 🎯 Implications: Positive Santa rally correlates with +1.4% January return and +10.4% full-year return
Why this matters for the option spread:
The Santa rally seasonal bias supports the bullish structure of this trade. If SPY continues higher from $687.80 toward $690-693 by January 2, the near-term short $678 calls expire safely out-of-danger, while the $687 longs profit. The historically low volatility during this period also benefits the calendar spread structure (selling expensive near-term vol, buying cheaper long-term vol).
Current Market Positioning (December 30, 2025)
- 🏆 SPY trading at $687.85, just 0.4% below all-time high of $690.38 set December 24
- 🎊 New Year's positioning: Institutions typically lock in year-end performance by December 26, minimal activity expected through January 2
- 💼 Low volume environment: Holiday-shortened week with many traders on vacation
- 📊 Rebalancing complete: Most index rebalancing and tax-loss harvesting finished before Christmas
📊 Near-Term Catalysts (Next 30 Days)
January 9, 2026: December Employment Report 📊
The December employment report will be critical for assessing labor market health and Fed policy path:
November 2025 baseline:
- 📈 Nonfarm payrolls: +64,000 (beat expectations after October's -105,000 revision)
- 😰 Unemployment rate: 4.6% (highest since September 2021 - 4-year high!)
- 💰 Wage growth: +3.5% YoY (smallest annual gain since May 2021)
- 📉 Federal government employment: Down 271,000 since January 2025 (shutdown impact)
What to watch in December report:
- Jobs growth sustainability - can economy maintain positive payroll growth?
- Unemployment trend - will 4.6% rate stabilize or continue rising?
- Wage growth trajectory - further cooling could signal labor market weakness
Market implications:
- 💪 Strong report (150K+ jobs, unemployment below 4.5%) = Bullish, supports continued rally
- 😰 Weak report (sub-100K jobs, unemployment above 4.7%) = Bearish, recession fears intensify
January 13, 2026: December CPI Report 🔥
The December CPI reading will be the first clean inflation data after the government shutdown:
November 2025 baseline:
- 📊 Headline CPI: 2.7% YoY (cooler than 3.0% consensus)
- 📈 Core CPI: 2.6% YoY (below expectations)
- 🏠 Shelter costs: +3.0% YoY (showing progress)
- ⚠️ Data quality concerns: October CPI not collected due to 43-day shutdown
Critical importance: Economists cautioned that November figures may be distorted due to shutdown impacts. December CPI will provide the first reliable signal of whether inflation continues cooling toward the Fed's 2% target or reaccelerates.
What to watch:
- Core CPI trend - staying at 2.6% or moving toward 2%?
- Shelter inflation - continuing to cool from 3.0%?
- Services inflation - any stickiness that concerns the Fed?
Market implications:
- ✅ Inflation continues cooling (2.5% or lower) = Bullish, supports Fed cuts
- 🚨 Inflation reaccelerates (2.9%+) = Bearish, Fed stays restrictive longer
January 27-28, 2026: FOMC Meeting 🏦
The first Fed meeting of 2026 will set the tone for monetary policy:
December 2025 baseline:
- ✂️ Fed cut rates 25bp to 3.50-3.75% (third consecutive cut in 2025)
- 😰 Contentious 9-3 vote (highest dissent since September 2019)
- 📊 Dot plot shows only one more cut in 2026, one in 2027
- 💬 Powell: Fed is "well positioned to wait and see how the economy evolves"
- 📊 Market pricing: 75.6% probability of hold at January meeting
What's at stake: The Fed faces a difficult balancing act - unemployment rising to 4.6% argues for cuts, but inflation stuck at 2.7% and strong 4.3% GDP growth argue for holding steady. Fed divisions that defined 2025 are expected to carry into 2026.
Scenarios:
- 🛑 Hold rates (75% probability): Status quo, markets likely muted reaction
- ✂️ Surprise cut: Dovish shock, equity rally likely
- 📈 Hawkish hold with guidance change: Risk of selloff if Fed signals no cuts for extended period
🚀 Longer-Term Catalysts (Q1-Q2 2026)
Fed Chair Transition (May 2026) ⚠️
Jerome Powell's term as Fed Chair expires in May 2026. President Trump is expected to name a successor in early 2026.
Historical warning: Markets typically struggle in first six months under a new Fed Chair with average correction of ~15%. This creates significant uncertainty premium in Q2 2026 options.
Midterm Election Year Dynamics (Full Year 2026) 🗳️
2026 is a midterm election year, historically the weakest year of a presidential cycle:
- 📉 Average intra-year drawdown: -18%
- 📊 Average annual price gain: +3.8% (weakest of 4-year cycle)
- ⚠️ 50% historical probability of 10%+ correction
- 🎯 Typical pattern: Weakness into midterms, recovery after
2026 Wall Street Consensus Targets 🎯
Every major Wall Street analyst surveyed predicts S&P 500 gains in 2026, potentially the longest winning streak in nearly two decades:
Target Range:
- 🚀 Most bullish: Oppenheimer 8,100 (+17.8%)
- 🎯 Average consensus: ~6,877 (+9%)
- 🛡️ Most bearish: Bank of America/Ned Davis 7,100 (+3.2%)
Key drivers cited:
- 💻 S&P 500 earnings growth expected +15.5% in 2026
- 🤖 IT sector earnings growth forecast +30.4% (AI monetization)
- 🏦 Fed supportive with rates at 3.50-3.75% and potential for further cuts
- 📊 Strong GDP growth (4.3% Q3) supporting corporate profitability
🎲 Price Targets & Probabilities
Using gamma levels, implied move data, and upcoming catalysts, here are the scenarios through mid-January:
📈 Bull Case (35% probability)
Target: $695-$705 by January 16
How we get there:
- 🎄 Santa Claus rally completes successfully with +1.3% move through January 3 → SPY reaches $696+
- 💪 January 9 employment report beats expectations (150K+ jobs, unemployment stable at 4.6% or lower)
- ❄️ January 13 CPI shows continued cooling (2.5% or below core), inflation concerns ease
- 🏦 January 27-28 FOMC maintains dovish bias despite holding rates
- 📈 "January effect" seasonal buying kicks in (small-caps outperform but lifts all boats)
- 🚀 Tech sector earnings preview commentary strong (Magnificent 7 maintains momentum)
- 🌍 No negative surprises from tariff policy or geopolitical events
- 💰 Tax-advantaged buying in January (IRA contributions, new 401k flows)
Gamma pathway:
- Break above $688 resistance (2,736.7B gamma wall) on volume - CRITICAL first hurdle
- Quick move to $690 (all-time high retest), then $693 (102.6B gamma)
- If momentum continues, $695 (190.9B gamma) and $700 (177.2B gamma) are next targets
- Extended upside could reach $705 (61.5B gamma)
Option spread P&L:
- ✅ Jan 2 short $678 calls expire worthless, collect full $23M premium
- ✅ Jan 2 long $687 calls profit $3-5 per contract = $12-20M gain
- 🚀 Jan 9 long $693 calls solidly in-the-money, worth $10-15 = $45-68M gain
- ✅ Jan 9 short $701 calls expire worthless, keep $2M premium
- 💰 Total P&L estimate: +$45-60M profit (100%+ ROI on net capital employed)
Why 35% probability: Requires multiple positive catalysts aligning AND breaking through the massive $688 gamma wall. The seasonal bias is supportive, but valuation at near-ATHs with Shiller P/E at 40.7x limits upside. Strong employment and cooling inflation are the keys - if both deliver, this scenario plays out.
🎯 Base Case (45% probability)
Target: $684-$691 range (CHOPPY CONSOLIDATION)
Most likely scenario:
- 📊 Santa rally delivers modest gains but fails to break convincingly above $691
- ⚖️ January 9 jobs report mixed (100-150K jobs, unemployment 4.5-4.7%) - not great, not terrible
- 📈 January 13 CPI in-line with expectations (2.6-2.7% core) - no big surprises
- 🏦 Fed holds rates at January meeting as expected, maintains "data-dependent" stance
- 🎢 Trading remains in tight $684-691 range (implied move ±$3.64 for Jan 2 plays out)
- 💤 Holiday volumes keep volatility suppressed
- 📊 Market digests 2025's strong +18% gain, consolidates before next leg
- ⏰ Institutions wait for Fed Chair clarity and midterm election setup before aggressive positioning
Gamma dynamics: SPY remains pinned between $687 support (938.8B gamma) and $688 resistance (2,736.7B gamma). The massive positioning at these strikes creates a natural "pin" effect - price gravitates toward areas of maximum gamma. With implied move of only ±$3.64 through Jan 2, the range-bound scenario is well-supported by options positioning.
Option spread P&L:
- ✅ Jan 2 short $678 calls expire worthless, collect $23M premium
- 📊 Jan 2 long $687 calls worth $0-4 depending on exact Friday close = -$6.4M to +$10M
- 📈 Jan 9 long $693 calls worth $0-5 if SPY at $688-693 = -$11M to +$11M
- ✅ Jan 9 short $701 calls expire worthless, keep $2M
- 💰 Total P&L estimate: +$5-15M profit (small profit to modest gain)
Why 45% probability: This is the path of least resistance. Markets near all-time highs typically consolidate before major moves. The gamma positioning supports range-bound trading. No major catalysts until January 9, and even those are unlikely to be extreme. The option spread is DESIGNED for this scenario - collect theta decay, benefit from volatility crush, stay range-bound.
📉 Bear Case (20% probability)
Target: $670-$680 (TEST SUPPORT LEVELS)
What could go wrong:
- 😰 Santa Claus rally fails (back-to-back failures rare but happened 1993-94, 2015-16)
- 🚨 January 9 employment report disappoints badly (negative jobs, unemployment spikes above 4.8%)
- 📈 January 13 CPI reaccelerates (2.9%+ core), inflation concerns return
- 🏦 Fed signals hawkish shift at January meeting (no cuts in 2026 guidance)
- 💸 Profit-taking accelerates after +18% year (institutional rebalancing into 2026)
- 🌍 Geopolitical shock or unexpected tariff announcement
- 📊 Valuation concerns resurface (Shiller P/E at 40.7x = second-highest ever)
- 🤖 AI disappointment risk - LPL Financial's #1 2026 risk
Support cascade:
- Break below $687 support (938.8B gamma) triggers momentum selling
- $685 (407.3B) and $680 (361.0B) are next floors
- Major test at $678 (111.4B gamma - exactly where short call is struck!)
- If that breaks, $675 (137.8B) and $670 (187.4B) are deeper support zones
Option spread P&L:
- 😰 Jan 2 short $678 calls could be tested if SPY drops to $675-680 = -$2-5M loss
- 📉 Jan 2 long $687 calls expire worthless = -$6.4M loss
- 💔 Jan 9 long $693 calls lose significant value = -$8-11M loss
- ✅ Jan 9 short $701 calls expire worthless, keep $2M
- 💀 Total P&L estimate: -$15-25M loss (significant drawdown but limited by spread structure)
Critical levels to watch:
- 🛡️ $687: MUST HOLD - strongest support, break here shifts sentiment bearish
- 🛡️ $685: Secondary defense, likely buying from institutional players
- 🛡️ $680: Major structural floor, breaking this accelerates downside
- 🛡️ $678: The short call strike - this is the "line in the sand" for the trade
Why only 20% probability: Requires multiple negative catalysts AND breaking significant support levels. The seasonal bias is bullish (Santa rally 78% success rate historically). Fed remains dovish (three cuts in 2025). GDP growth strong at 4.3%. Most importantly, the gamma support structure below current price is VERY strong - there's 938.8B gamma at $687 alone. Markets don't easily abandon all-time highs without major fundamental deterioration.
However, the risk isn't zero - labor market weakness (unemployment at 4.6%) and sticky inflation (2.7%) create vulnerability if data disappoints meaningfully.
💡 Trading Ideas
🛡️ Conservative: Ride the Santa Rally with Tight Stops
Play: Buy SPY shares or March calls, protect with tight stops at gamma support
Why this works:
- 🎄 Santa Claus rally has 78% historical success rate - odds in your favor
- 📊 Strong gamma support at $687 (938.8B) and $685 (407.3B) provides clear risk management levels
- 💰 Potential +1.3% gain through January 3 if seasonal pattern holds = $696 target
- ⏰ Short-term play (3-10 days) matches the calendar spread timeframe
- 🛡️ Defined exit strategy if support breaks
Structure:
- Buy SPY shares at $687-688
- Set mental stop at $686 (just below major $687 gamma support)
- Target $691-693 (implied move upper range and resistance levels)
- Time horizon: Hold through January 3 (Santa rally window)
Or using options:
- Buy March 20 $685 calls (80 days, near-the-money)
- Cost: ~$15-18 per contract ($1,500-1,800 per contract)
- Target: Sell at $695-700 for $10-15 gain per contract
- Stop loss: Exit if SPY closes below $686 two days in a row
Position sizing: Risk only 2-3% of portfolio (this is a seasonal play, not a long-term hold)
Risk level: Low-Moderate (tight stop, seasonal edge) | Skill level: Beginner-friendly
Expected outcome: Small to moderate profit if Santa rally continues. Quick exit if support fails. Clean risk management with clear levels.
⚖️ Balanced: Mini Calendar Spread (Copy The Structure)
Play: Replicate the institutional calendar spread at smaller scale
Structure - The "Lite" Version:
- SELL 2 contracts of Jan 2 $678 calls (collect ~$21 premium = $2,100)
- BUY 4 contracts of Jan 2 $687 calls (pay ~$11.60 = -$1,160)
- BUY 4 contracts of Jan 9 $693 calls (pay ~$9.64 = -$964)
- SELL 4 contracts of Jan 9 $701 calls (collect ~$1.84 = $184)
Net cost: -$2,100 + $1,160 - $964 + $184 = approximately $1,920 net credit (you collect money to put on the trade!)
Why this works:
- 🤝 You're literally copying the smart money positioning at 1/10,000th the scale
- ⏰ Time decay works FOR you on the short Jan 2 $678 calls (theta burns fast over 3 days)
- 📊 Calendar spread benefits from volatility crush into year-end
- 💰 Net credit structure means you profit if SPY stays in range OR moves up moderately
- 🎯 Multiple ways to win: time decay, volatility compression, directional move to $690-695
Risk profile:
- 💰 Max profit: $15,000-20,000 if SPY at $693-700 by January 9
- 📉 Max loss: Limited to ~$10,000 if SPY crashes below $678 (short calls go deep ITM)
- 🎯 Breakeven: Very wide range $680-700, high probability zone
- ⚖️ Risk/Reward: Favorable ~1:1.5-2 with positive expected value
Management:
- 📅 Jan 2 close: If SPY above $690, let short $678 calls expire, take profit on $687 longs
- 📈 Jan 3-9: Monitor the $693/$701 call spread, exit if SPY reaches $700+ early
- 🚨 Emergency exit: If SPY breaks below $685 on Monday, close entire position (small loss but prevents disaster)
Position sizing: Use only 5-10% of options portfolio (this is leveraged and time-sensitive)
Risk level: Moderate (multi-leg complexity, time decay risk) | Skill level: Intermediate
Expected outcome: Small profit from time decay and volatility crush if range-bound. Larger profit if SPY rallies to $690-695 as expected. Limited loss even in adverse scenario.
🚀 Aggressive: Iron Condor - Bet on the Pin (ADVANCED)
Play: Sell premium around the tight $687-$691 range, betting on low volatility
Structure:
- SELL Jan 2 $685 puts (collect ~$2.50 = $250 per contract)
- BUY Jan 2 $680 puts (pay ~$1.20 = -$120 per contract)
- SELL Jan 2 $692 calls (collect ~$1.80 = $180 per contract)
- BUY Jan 2 $695 calls (pay ~$0.80 = -$80 per contract)
Net credit per iron condor: $250 - $120 + $180 - $80 = $230 credit ($2.30 per share)
Why this could work:
- 🎯 Implied move is only ±$3.64 (±0.53%) - you're selling premium outside this range
- 💎 Gamma data shows MASSIVE support at $687 and resistance at $688 - price is PINNED
- 💤 Holiday market = low volume, low volatility, high probability of expiring in range
- ⏰ Only 3 days to expiration = theta decay works massively in your favor
- 📊 You profit if SPY stays between $680-695 at January 2 close (wide range)
Why this could blow up (SERIOUS RISKS):
- 💥 Limited profit, significant loss: Max gain $230 per condor, max loss $270 per condor
- 🚨 Binary event risk: Surprise geopolitical event or market shock could gap SPY outside range
- 😰 Thin holiday markets: Low liquidity means wider spreads, harder to exit if wrong
- ⏰ 3 days to expiration: No time to recover if trade goes against you immediately
- 📉 Year-end volatility: While usually calm, January 2 is first trading day of new year (could surprise)
- 🎢 Pin risk: If SPY closes exactly at $685, $692, or between, assignment risk on short options
Estimated P&L:
- 💰 Perfect scenario: SPY closes $686-691 → Keep full $230 credit per condor (100% ROI)
- 📊 Partial profit: SPY closes $683-685 or $692-694 → Keep $100-180 per condor (40-75% ROI)
- 😰 Max loss: SPY closes below $680 or above $695 → Lose full $270 per condor (117% loss)
- 💀 Disaster: SPY gaps to $675 or $700 → Lose $270 per condor instantly
Breakeven points:
- 📈 Upside breakeven: $694.30 (need SPY above this to lose money on call side)
- 📉 Downside breakeven: $682.70 (need SPY below this to lose money on put side)
- 🎯 Profit zone: $682.70 - $694.30 (11.60-point range, very achievable)
CRITICAL WARNING - DO NOT attempt unless you:
- ✅ Understand iron condors and assignment risk mechanics
- ✅ Can monitor position closely (check hourly if needed through Thursday close)
- ✅ Accept that max loss of $270 per condor could happen with market gap
- ✅ Will close position IMMEDIATELY if SPY breaks $684 or $693 (don't hope it comes back)
- ✅ Keep position size SMALL (max 2-3% of account in case of max loss)
- 💰 Have cash/margin to handle assignment if SPY closes exactly at short strikes
Position sizing: Max 10 condors ($2,300 credit, $2,700 risk) for $25K account - this is MAXIMUM, not recommended
Risk level: HIGH (defined risk but unfavorable risk/reward, time-sensitive) | Skill level: Advanced only
Probability of profit: ~70% (based on staying within ±$3.64 implied move)
Management plan:
- 📊 If profit reaches 50% ($115 per condor) by Tuesday morning, CLOSE IT (take the win)
- 🚨 If SPY touches $684 or $693, close IMMEDIATELY (don't wait for explosion)
- ⏰ Don't hold through Friday close if near short strikes (assignment risk)
⚠️ Risk Factors
Don't get caught by these potential landmines:
-
🎄 Santa rally failure risk: While historically successful 78% of the time, we've seen back-to-back failures in 2023 and 2024. A third consecutive failure would be extremely rare (only 1993-94, 2015-16 precedents) but would likely trigger significant selloff as traders positioned for seasonal strength get caught wrong-footed. If the Santa rally fails, historical data suggests -0.1% January and only +6.1% full year vs +1.4% January and +10.4% full year if successful.
-
😰 Labor market deterioration accelerating: Unemployment at 4.6% is the highest since September 2021, and federal government employment down 271,000 since January 2025. If January 9 employment report shows further weakness (unemployment above 4.8%, weak job creation), recession fears could intensify quickly. Wage growth at +3.5% YoY is the smallest gain since May 2021 - if this continues decelerating, consumer spending could weaken.
-
📈 Inflation reacceleration risk: November CPI at 2.7% is still well above the Fed's 2% target. Data quality concerns due to October shutdown mean December CPI (January 13) could surprise. If core CPI moves back toward 2.9-3.0%, the Fed would be forced to maintain restrictive policy longer, pressuring equity valuations. Services inflation remains particularly sticky.
-
💸 Extreme valuation vulnerability: Shiller P/E (CAPE) at 40.74 as of December 26 is the second-highest reading in history (only exceeded during dot-com bubble peak). Historical average since 1871 is ~17x. Forward P/E at 25x is stretched - reversion to even 20x would imply 20% correction. At these levels, markets are priced for PERFECTION - any disappointment magnified.
-
🤖 AI disappointment as 2026's #1 risk: LPL Financial identifies AI disappointment as the No. 1 risk facing markets in 2026. The Magnificent 7 represents 34-40% of S&P 500, creating enormous concentration risk. If AI monetization disappoints expectations or adoption slows, the impact on index would be severe. IT sector expects +30.4% earnings growth in 2026 - high bar to clear.
-
🗳️ Midterm election year weakness: 2026 is a midterm election year, historically the weakest of the 4-year presidential cycle with average intra-year drawdown of -18% and only +3.8% annual return. There's a 50% historical probability of 10%+ correction in midterm years. Typical pattern is weakness into November elections, then recovery - but traders positioned for continued 2025 momentum could face harsh reality.
-
🏦 Fed Chair transition turbulence: Jerome Powell's term expires May 2026, and Trump is expected to name successor early 2026. Historical pattern shows markets struggle in first six months under new Fed Chair with average ~15% correction. The uncertainty around policy continuity and the new Chair's inflation/employment priorities creates volatility premium in Q2-Q3 2026 options.
-
🌍 Tariff policy wildcard: Trump's tariffs drove massive volatility in 2025 - S&P 500 fell 4.88% on April 3, then rallied 9.52% on April 9 (largest gain since 2008) when tariffs were suspended. Average tariff on U.S. imports now 16.8%, highest since 1935. Any new tariff announcements or trade war escalation could trigger violent swings without warning.
-
💀 Gamma pin turns into gamma flip: While the current $687 support (938.8B gamma) and $688 resistance (2,736.7B gamma) create stability, if price breaks decisively through these levels, the gamma that was providing support/resistance FLIPS to accelerate the move. Break below $687 could cascade quickly to $685 → $680 → $678 as dealers hedge by selling stock. Similarly, break above $688 could gap to $691 → $693 → $695 rapidly.
-
💼 SPY fund outflows accelerating: SPY experienced ~$30.2B net outflows YTD 2025 (second-worst year on record) as investors shift to lower-cost alternatives like VOO (0.03% expense ratio vs SPY's 0.09%). Vanguard VOO now leads with $732B AUM vs SPY's ~$720B. While recent months show reversal (+$4.75B 1-month, +$17.15B 3-month), the long-term trend creates selling pressure on SPY specifically even as S&P 500 rises.
-
⏰ Holiday illiquidity amplifies moves: December 30 - January 2 period has extremely thin trading volumes (many traders on vacation). This creates environment where small order flow can cause outsized price moves. The tight $687-$688 gamma range could lead to whipsaw action on low volume. For options traders, this means wider bid-ask spreads and difficulty executing trades at fair prices.
-
📊 Implied volatility crush works both ways: The calendar spread structure profits from volatility declining into year-end. But if something unexpected occurs (geopolitical shock, corporate blow-up, Fed surprise), implied volatility could SPIKE instead of falling. This would hurt the long vol position (Jan 9 calls) less than it helps, since near-term vol (Jan 2) would explode even more. A volatility spike could turn the $7.6M net credit into a significant loss rapidly.
🎯 The Bottom Line
Real talk: Someone just deployed $42.4 MILLION in a sophisticated calendar spread structure spanning two weekly expirations. This isn't a gamble on direction - it's a calculated volatility arbitrage play executed by professional traders who've done this a thousand times.
What this trade tells us:
- 🎯 They expect low volatility through January 2: The structure PROFITS from range-bound trading in the $684-691 range through Friday
- ⏰ Time decay is the primary edge: Selling near-term premium (3 days) while buying longer-term (10 days) captures theta differential
- 📊 Controlled upside exposure: The diagonal structure shows they want SPY to rally moderately ($690-695) but not explosively
- 💰 Risk management through structure: Rather than pure directional bet, they're using calendar spreads to define risk and hedge
- 🎄 Year-end seasonality play: Positioned for traditional Santa rally pattern with low vol into holiday period
The gamma data PERFECTLY aligns with this trade:
- 📍 $687 support (938.8B gamma) - near current price, provides floor
- 📍 $688 resistance (2,736.7B gamma) - MASSIVE wall just above, caps upside temporarily
- 📍 $678 short strike - sits at support level (111.4B), betting this holds
- 📍 $693 long strike - upper gamma level (102.6B), realistic upside target
- 📍 $701 short strike - above $700 round number resistance, betting it stays OTM
This is NOT a "follow blindly" signal - it's a "understand the setup" signal.
If you're watching SPY:
- ⏰ Through January 2: Watch the $687-$691 range. Break below $687 = bearish, break above $691 = bullish
- 🎄 Santa rally period ends January 3: Historical data suggests January return correlates with Santa rally success
- 📊 January 9 jobs report: Critical catalyst - weak data could break support levels
- 📈 January 13 CPI: Inflation reacceleration would be major negative for equities
- 🏦 January 27-28 FOMC: First Fed meeting of 2026 sets tone for year
For retail traders, the lessons:
- 💡 Calendar spreads work in low-volatility environments: When implied moves are small (0.53% for 3 days), selling near-term and buying longer-term can generate edge
- 🎯 Use gamma levels for trade structure: The $687 support and $688 resistance aren't random - they're based on massive options positioning
- ⏰ Time decay is powerful with short-dated options: 3 days to expiration means theta burns FAST on the short calls
- 🛡️ Define your risk: This trade has limited loss potential due to spread structure despite $42M size
- 📊 Volatility is an asset class: They're not betting on direction alone, they're arbitraging time and volatility
Key dates to mark:
- 📅 December 30-January 3 - Santa Claus rally window (historically bullish)
- 📅 January 2 (Friday) - Near-term leg expiration of this trade
- 📅 January 9 (Thursday) - December employment report (labor market health)
- 📅 January 9 (Friday) - Longer-term leg expiration of this trade
- 📅 January 13 (Monday) - December CPI report (inflation trajectory)
- 📅 January 16 (Friday) - Monthly OPEX (±$11.15 implied move window)
- 📅 January 27-28 - FOMC meeting (rate policy decision)
Strategy recommendations:
If you're bullish on SPY:
- ✅ Consider buying shares or March calls with stops below $686 (clear support level)
- 🎯 Target $691-695 range for initial profit-taking
- ⏰ Santa rally historically lasts through January 3, then reassess
If you're neutral:
- ⚖️ Mini calendar spread (copy the structure at smaller size) captures time decay and vol crush
- 💰 Iron condor around $685-692 range (only for experienced traders) profits from tight range
- 📊 Watch $687 support and $688 resistance as boundaries
If you're bearish:
- ⏰ WAIT for confirmation - don't fight seasonal bias and gamma support without catalyst
- 🎯 Break below $687 on volume would be signal to short or buy puts
- 📉 Target $685 → $680 → $678 support cascade if breakdown occurs
Final verdict: The $42.4M calendar spread signals sophisticated money expects continuation of the late-year rally pattern with LOW volatility into January 2, followed by potential expansion toward $693-700 by January 9. The trade structure is BULLISH but controlled - not betting on explosive breakout, rather methodical grind higher within defined range.
The setup is actually quite elegant: Collect massive premium from year-end low volatility, maintain upside exposure for early January strength, limit risk through spread structure. This is textbook institutional options trading at its finest.
For most retail traders, the simple takeaway: The path of least resistance is likely $690-695 by mid-January IF the Santa rally completes successfully and economic data cooperates. But watch $687 support like a hawk - break that level and the whole thesis changes.
Markets don't move in straight lines. Respect the levels. Manage your risk. And remember - they deployed $42M in a SPREAD structure with defined risk, not naked long calls. There's wisdom in that approach. 💪
Disclaimer: Options trading involves substantial risk of loss and is not suitable for all investors. This analysis is for educational purposes only and not financial advice. Calendar spreads are complex multi-leg strategies that can lose significant value quickly if market conditions change. The 226.72 and 159.79 Z-scores reflect this specific trade's size relative to recent SPY history - they do not imply the trade will be profitable or that you should replicate it. Past performance doesn't guarantee future results. Implied moves and gamma levels are dynamic and change continuously. Always do your own research and consider consulting a licensed financial advisor before trading complex options strategies. Year-end markets can be illiquid with wider spreads and increased slippage. Consider your own risk tolerance, account size, and trading experience before implementing any strategy described here.
About SPDR S&P 500 ETF Trust (SPY): The SPDR S&P 500 ETF Trust tracks the S&P 500 Index, providing exposure to 500 leading U.S. companies across all sectors. With ~$720 billion in assets under management, SPY is the world's largest and most liquid ETF, offering investors broad market exposure with a 0.09% expense ratio.