🐻 SPY: Someone Just Spent $3.1M on a Bear Put Spread Targeting a 4.6% Drop!
📅 February 6, 2026 | 🔥 Unusual Activity Detected
🎯 The Quick Take
A whale just put on a $700K net debit bear put spread on SPY -- buying 19,998 contracts of $656 puts while simultaneously selling 19,998 contracts of $651 puts, both expiring February 20 (monthly OPEX). With SPY trading at $687.73, this trader is betting on a 4.6% decline in just 14 days. The math is jaw-dropping: risk $700K to potentially make $99.3 MILLION if SPY collapses to $651 or below by February OPEX. That's a 142:1 reward-to-risk ratio on a trade that aligns perfectly with deteriorating labor data, a government shutdown, and the nastiest tech selloff of 2026. 👀
🏢 ETF Overview
SPDR S&P 500 ETF Trust (SPY) is the world's most actively traded ETF, tracking the S&P 500 Index:
- Market Cap: ~$705.55 billion
- Current Price: ~$687.73
- 52-Week High: $697.84 (January 28, 2026)
- 52-Week Low: $481.80
- P/E Ratio: 28.40
- Dividend Yield: 1.1%
- YTD Return (2026): +1.4% (January), pulling back in February
- 2025 Full-Year Return: +16.39% (+17.88% with dividends)
- Top Holdings: Apple (7.2%), NVIDIA (6.8%), Microsoft (6.3%), Amazon (3.8%), Meta (2.6%)
- Expense Ratio: 0.0945%
💰 The Option Flow Breakdown
📈 The Tape (February 6, 2026 @ 11:37:37)
| Time | Symbol | Side | Buy/Sell | Type | Expiration | Premium | Strike | Volume | OI | Size | Spot | Option Price |
|---|---|---|---|---|---|---|---|---|---|---|---|---|
| 11:37:37 | SPY | ASK | BUY | PUT | 2026-02-20 | $3.1M | $656 | 20K | 14K | 19,998 | $687.73 | $1.54 |
| 11:37:37 | SPY | MID | SELL | PUT | 2026-02-20 | $2.4M | $651 | 47K | 2.5K | 19,998 | $687.73 | $1.20 |
💵 Total Premium: $5.5M gross | $700K net debit
🤓 What This Actually Means
This is a BEAR PUT SPREAD -- a defined-risk bearish strategy where the trader:
🐋 The Structure: $656/$651 Bear Put Spread (19,998 contracts)
- Bought the $656 puts for $1.54 ($3.08M total) -- this is the bearish leg
- Sold the $651 puts for $1.20 ($2.40M total) -- this offsets cost and caps profit
- Net debit: ~$0.34 per spread ($700K total risk)
- Max profit: $5.00 width - $0.34 debit = $4.66 per spread x 19,998 contracts = $93.2M
- Max profit trigger: SPY at or below $651 at February 20 expiration
- Breakeven: $655.66 (strike minus debit) -- that's a 4.7% decline from $687.73
Translation for regular folks: Someone risked about $700K on a bet that SPY drops at least 4.7% in the next two weeks. If the S&P 500 sells off to $651 or below by February OPEX, they turn $700K into $93+ million. That's like betting on a 20-to-1 longshot at the racetrack -- except this horse has real reasons to run.
Why the structure matters:
- Both legs executed simultaneously at 11:37:37 -- same second, same size, confirming this is a single strategy
- BTO at ASK on the $656 leg shows urgency -- they paid up to get filled immediately
- STO at MID on the $651 leg shows they negotiated -- selling premium to reduce cost
- The $5-wide spread keeps this defined-risk -- max loss is only the $700K premium paid
- Volume/OI ratio on the $651 leg is 18.8x (47K volume vs 2.5K OI) -- massively unusual
What could be behind this trade:
- Pure directional bet: Trader sees a specific catalyst (CPI? GDP? shutdown escalation?) triggering a sharp selloff
- Tail hedge on a massive portfolio: If they manage $5-10B in equities, $700K is pocket change for portfolio insurance
- Event-driven play: February 20 expiration captures both Jan CPI (Feb 11) AND Q4 GDP advance estimate (Feb 20)
- Technical breakdown play: SPY already down 2.9% from ATH, trader sees further downside through key support
📈 Technical Setup / Chart Check-Up
YTD Performance
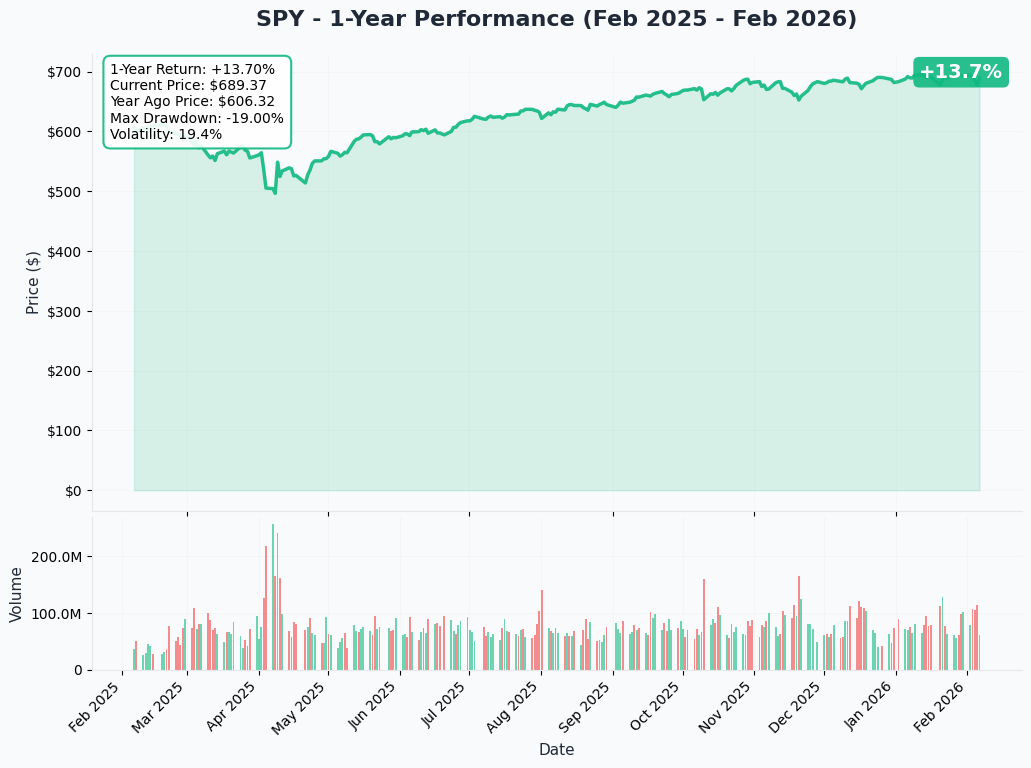
SPY peaked at $697.84 on January 28 and has been selling off sharply since, driven by massive Big Tech capex announcements, deteriorating labor data, and a sector rotation out of growth into value/defensives.
Key observations:
- Down 2.9% from all-time high set just 9 days ago
- Tech-led selloff: S&P 500 fell 1.23% on Feb 5 alone, Nasdaq dropped 1.59%
- VIX spiked above 22 -- highest since November 2025, signaling elevated fear
- SPY saw $11.23B in outflows over the trailing month -- smart money pulling capital
- Still up for the year: January returned +1.4%, but February is erasing those gains fast
The put spread buyer is betting this selloff has further to go -- and the macro backdrop supports that thesis.
🔵🟠 Gamma-Based Support & Resistance Analysis
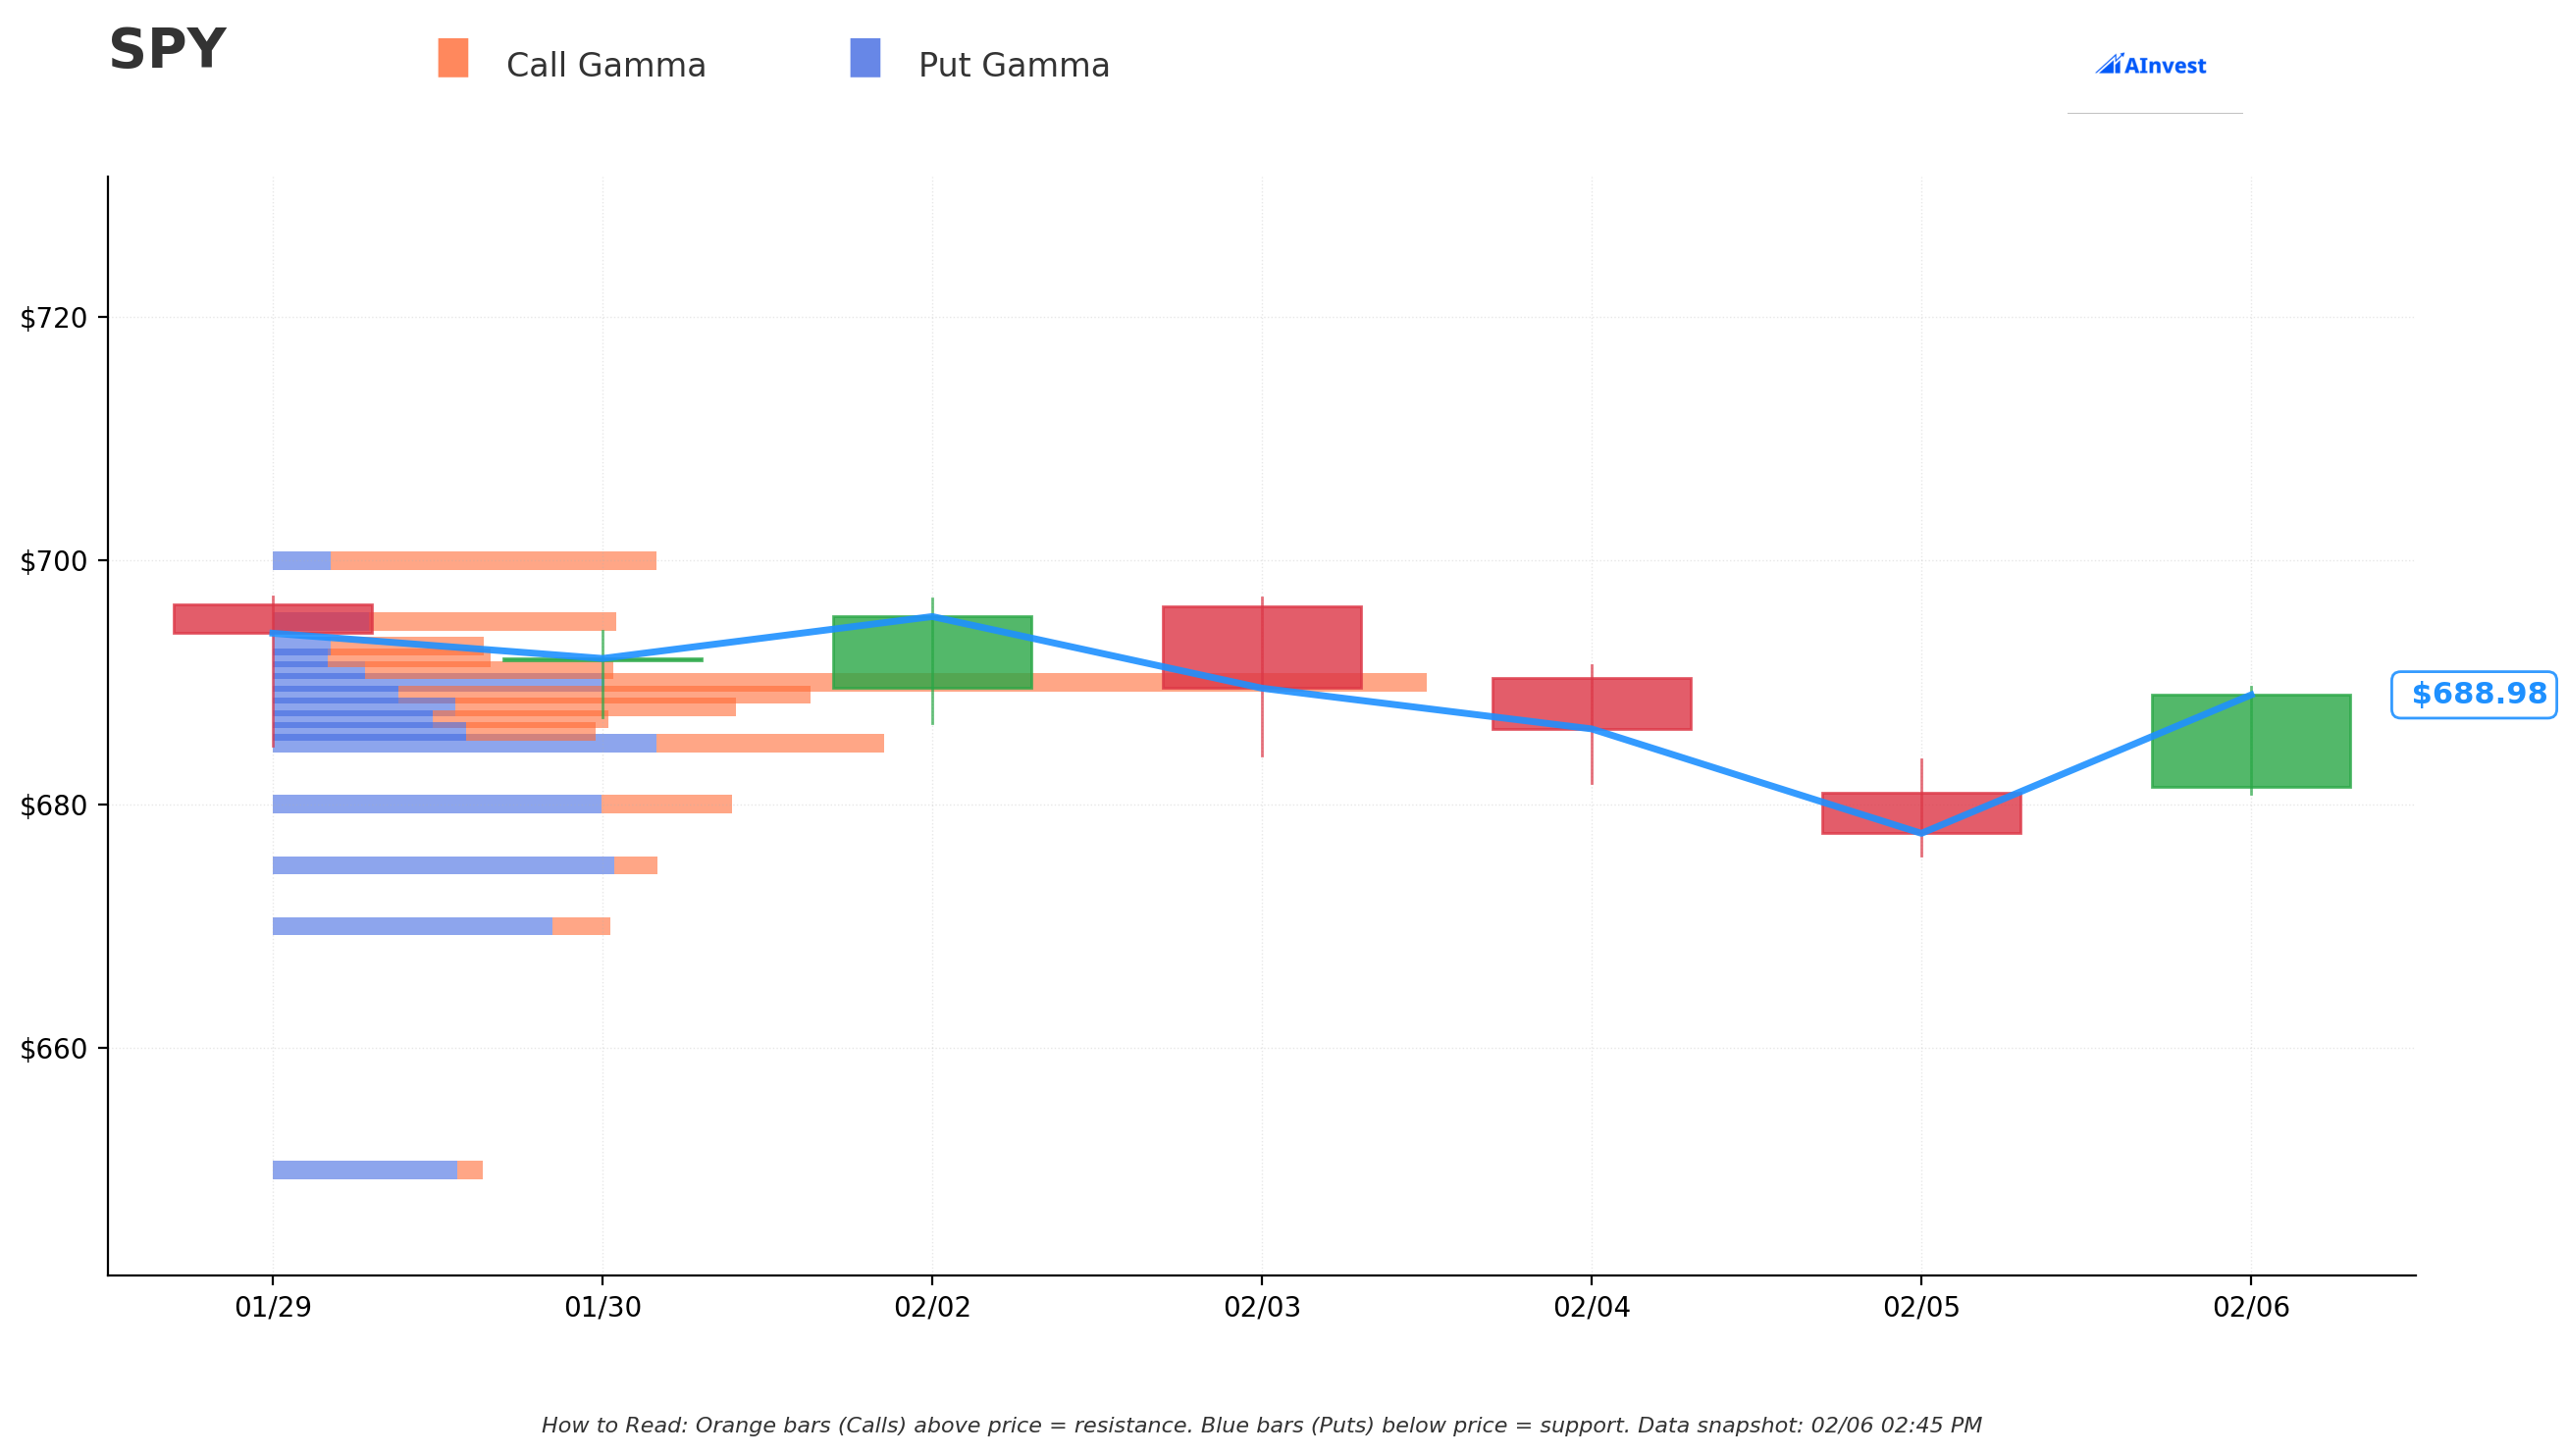
Current Price: $689.14
The gamma exposure (GEX) map shows where market maker hedging creates natural price magnets and walls:
🛡️ Support Levels (Where Dealers Buy Dips):
- $689 -- Immediate support (255.6 GEX) -- thin, could break easily
- $688 -- Secondary support (238.5 GEX)
- $687 -- Modest floor (185.6 GEX)
- $685 -- Strong support (338.4 GEX) -- dealers will aggressively buy here
- $680 -- Major support zone (255.4 GEX) -- 1.3% below current
- $675 -- Deep support (207.6 GEX) -- 2% below current
- $670 -- Extended support (185.2 GEX) -- 2.8% below current
🎯 Resistance Levels (Where Dealers Sell Rallies):
- $690 -- STRONGEST RESISTANCE (566.4 GEX) -- massive gamma wall right above!
- $691 -- Secondary resistance (184.5 GEX)
- $700 -- Major psychological and gamma ceiling (205.6 GEX)
📉 GEX Bias: Bullish (call GEX 3,104.7 > put GEX 2,972.2) -- but barely. The net bias is only slightly positive, and SPY is trapped right below the $690 gamma wall. This means:
- Upside is capped -- $690 is a massive ceiling with 566.4 GEX. Every rally to $690 gets sold by dealers
- Downside is layered -- support exists at $685, $680, $675, but no single level is dominant enough to halt a fast move
- If $685 breaks -- the next strong floor isn't until $680, then $675 -- that's a cascading waterfall setup
For the bear put spread: The $656 and $651 strikes are well below ALL gamma support levels shown. For this trade to hit max profit, SPY needs to crash through $689, $685, $680, $675, $670, and keep going. That's a $31-$36 decline (4.5-5.3%) -- ambitious but not impossible in a fear-driven selloff with VIX already above 22.
📉 Implied Move Analysis
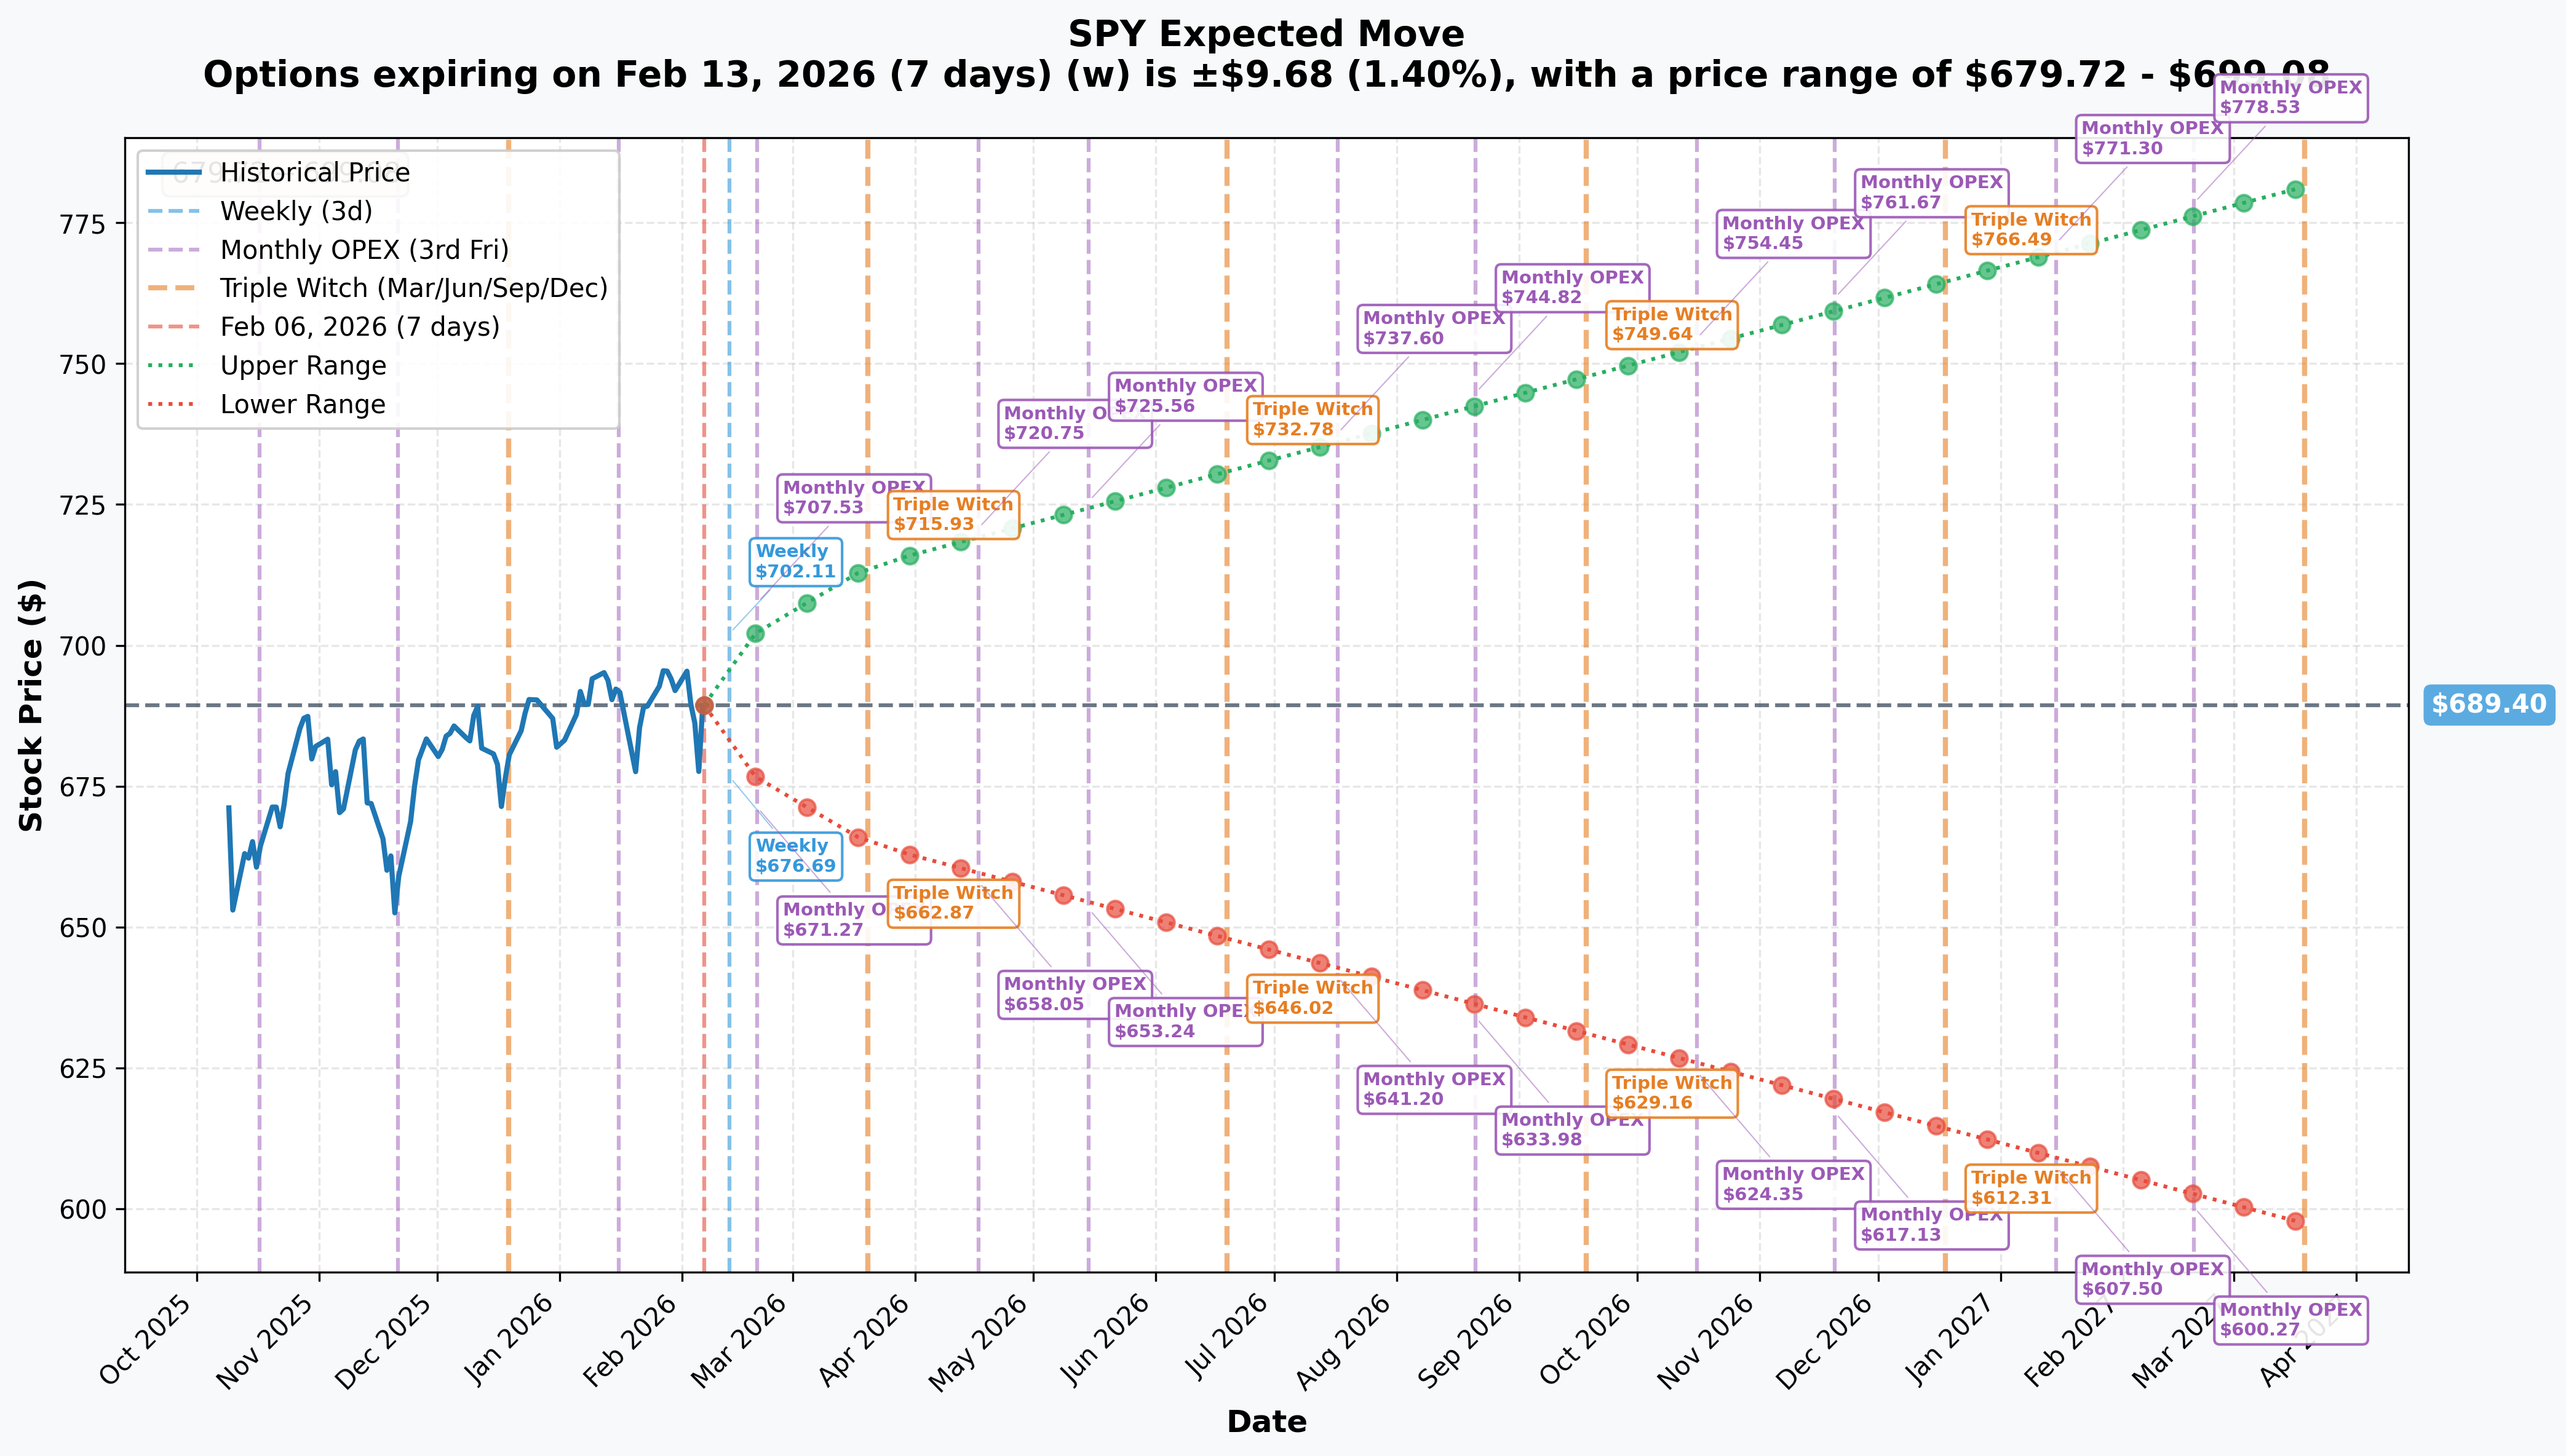
Options-Implied Price Ranges from Current $689.40:
| Timeframe | Expiry | Implied Move % | Implied Move $ | Lower Range | Upper Range |
|---|---|---|---|---|---|
| 📅 Weekly | Feb 13 | +/-1.40% | +/-$9.68 | $679.72 | $699.08 |
| 📅 Monthly OPEX | Feb 20 | +/-1.92% | +/-$13.22 | $676.18 | $702.62 |
| 📅 Triple Witch | Mar 20 | +/-3.58% | +/-$24.68 | $664.72 | $714.08 |
| 📅 Yearly LEAPS | 2027 | +/-13.36% | -- | $597.31 | $781.49 |
Here's where it gets interesting:
The options market is pricing a +/-1.92% move ($13.22) through the February 20 OPEX -- the exact expiration of this bear put spread. That translates to a range of $676.18 - $702.62.
- The bear put spread's breakeven at $655.66 is $20 below the implied move floor ($676.18)
- The max profit zone at $651 is $25 below what the market expects as the worst-case scenario
- This means the options market is pricing only about a 15-20% probability of the spread reaching max profit
BUT -- implied moves are averages, not ceilings. The March Triple Witch lower range of $664.72 shows the market acknowledges bigger moves are possible over slightly longer timeframes. And with CPI (Feb 11) and GDP (Feb 20) as binary catalysts, the actual move could easily exceed the implied range.
The trader is betting on a "fat tail" event -- the kind of 3-4 standard deviation move that the options market underprices. And at $700K cost for $93M potential payoff, they don't need it to happen often.
🎪 Catalysts
✅ Already Happened (Recent)
- 🏦 Fed held rates at 3.50%-3.75% (Jan 28) -- no relief for markets, two dissenting votes wanted a cut
- 👤 Kevin Warsh nominated as Fed Chair (Jan 30) -- more hawkish replacement for Powell, Senate confirmation uncertain
- 📉 Dec payrolls only +50K (Jan 9) -- massive miss, unemployment at 4.4%
- ⚠️ JOLTS job openings tumbled to 6.54M (Feb 4) -- lowest since September 2020, signaling rapid labor deterioration
- 🏭 ISM Manufacturing PMI hit 52.6 (Feb) -- first expansion in 12 months, a bright spot
- 🏛️ Partial government shutdown since Jan 30 -- 6 spending bills unfunded, delaying key economic data
- 💰 Big Tech $660B capex bomb -- combined Mag-7 spending plans triggered ~$900B market cap wipeout
- 🔄 Massive sector rotation underway -- capital fleeing AI/tech for old economy sectors
- 🤒 Consumer confidence collapsed to 84.5 -- lowest since May 2014
- 💸 SPY saw $11.23B in outflows -- trailing 1-month period while international ETFs saw record $51B inflows
- 🛃 Tariff rates at Depression-era highs -- effective US tariff rate above 14%
🔮 Upcoming (Before Feb 20 Expiration!)
| Date | Event | Why It Matters |
|---|---|---|
| Feb 11 | January CPI Report | Hot print could crush rate cut hopes; Dec was 2.7% YoY. THE KEY CATALYST |
| Feb 20 | Q4 GDP Advance Estimate | Delayed from Jan 29 by shutdown; GDPNow at 4.2% but slowing fast |
| Feb 20 | Monthly OPEX | This trade expires! Pin risk, gamma unwind, and max vol day |
| Ongoing | Government Shutdown | Delaying BLS data, weighing on confidence, potential GDP drag |
🔮 Later Catalysts (After Expiration)
| Date | Event | Details |
|---|---|---|
| Mar 6 | February Jobs Report | Watch for benchmark revisions |
| Mar 17-18 | FOMC Meeting + SEP | 91.1% hold probability; new dot plot critical |
| May | Powell's term expires | Warsh transition adds policy uncertainty |
| Nov 2026 | Debt ceiling projected hit | Potential for credit downgrade, funding crisis |
🎯 Price Targets & Probabilities
Using gamma levels, implied move data, and the catalyst calendar, here are the scenarios through the February 20 expiration:
🐻 Bear Case: $651-$670 (15% probability)
This is the put spread's profit zone
How we get there:
- Hot January CPI (Feb 11) crushes remaining rate cut hopes for 2026
- GDP estimate disappoints or reveals slowing momentum (Feb 20)
- Government shutdown drags on, further eroding consumer confidence
- Tech selloff accelerates -- more AI capex backlash, sector rotation intensifies
- Break below $685 gamma support triggers cascade through $680, $675, $670
- VIX spikes above 30, creating panic selling and forced liquidations
- SPY falls 3-5% in a single session on CPI shock
Put spread P&L in this scenario:
- SPY at $656: Spread worth $0 (at long strike), loss = -$700K
- SPY at $655: Spread worth $1.00, profit = $13.3M
- SPY at $651: Spread worth $5.00 (MAX), profit = $93.2M
- SPY at $640: Still $5.00 max (capped by short leg), profit = $93.2M
⚖️ Base Case: $675-$695 (60% probability)
Range-bound consolidation around gamma levels
Most likely scenario:
- CPI comes in roughly in-line (2.6-2.8% YoY) -- no panic, no euphoria
- GDP confirms solid growth but markets already discounted it
- Shutdown resolves or markets stop caring about it
- SPY oscillates between $685 gamma support and $690 resistance wall
- VIX drifts back to 18-20 range as fear subsides
- Bear put spread expires worthless -- $700K total loss for the trader
This is where the $690 gamma wall matters: With 566.4 GEX at $690 and strong support at $685, the most likely outcome is SPY stays pinned in this $685-$695 range through OPEX.
🚀 Bull Case: $695-$710+ (25% probability)
Breakout above $690 resistance
How we get there:
- CPI comes in cool (below 2.5% YoY), reviving June rate cut hopes
- Strong GDP print confirms economic resilience
- Government shutdown resolved quickly
- Tech stabilizes -- earnings beats from remaining reporters
- SPY breaks through $690 gamma wall, momentum carries to $700 psychological level
- Bear put spread expires completely worthless -- $700K loss
💡 Trading Ideas
🛡️ Conservative: "Buy the Dip at Gamma Support"
Play: Buy SPY shares if price pulls back to $680-$685 gamma support zone
Why this works:
- $685 has 338.4 GEX -- one of the strongest support levels on the board
- SPY historically bounces from gamma support 60-70% of the time
- Net GEX bias is still slightly bullish (call GEX > put GEX)
- Wall Street year-end targets range from 7,100-7,800 on S&P 500 (4-15% upside)
Execution plan:
- Set limit buy at $682-$685 range
- Stop-loss at $674 (below $675 gamma support -- if that breaks, thesis is wrong)
- Target: $700 (psychological resistance + gamma level)
- Risk: ~1.5% | Reward: ~2.5% | R:R = ~1.7:1
Risk level: Low | Skill level: Beginner-friendly
⚖️ Balanced: "Follow the Whale -- Smaller Bear Put Spread"
Play: Put on a smaller version of the same $656/$651 bear put spread
Structure: Buy SPY $656 puts, Sell SPY $651 puts (Feb 20 expiration)
Why this works:
- Mirrors institutional positioning at fraction of the cost
- Defined risk: ~$34 per spread ($0.34 net debit x 100)
- Max profit: $466 per spread if SPY below $651
- Captures the same CPI (Feb 11) and GDP (Feb 20) catalyst window
- Even partial moves toward $660-665 create profitable exit opportunities before expiration
Position sizing: 5-10 spreads max = $170-$340 at risk
Important reality check: The options market prices only ~15% probability of SPY reaching $651 by Feb 20. This is a lottery ticket, not a core position. Size accordingly.
Risk level: Moderate (defined risk, low probability) | Skill level: Intermediate
🔥 Aggressive: "CPI Volatility Play -- Long Straddle"
Play: Buy ATM straddle ahead of January CPI release on February 11
Structure: Buy SPY $690 call + Buy SPY $690 put (Feb 14 weekly expiration)
Why this works:
- VIX at 22+ signals market expects a move but isn't sure which direction
- CPI is the single biggest binary catalyst before OPEX
- Hot CPI = sharp selloff (bears win); Cool CPI = relief rally (bulls win)
- Weekly straddle captures the event move with minimal time decay before the event
- Implied move of +/-1.40% ($9.68) for the weekly gives you a clear breakeven target
Estimated P&L:
- Cost: ~$8-10 per straddle ($800-$1,000 per contract)
- Breakeven: SPY moves more than ~$9-10 in either direction from $690
- Target: Sell the winning leg immediately after CPI for 50-100% gain
- Max loss: Full premium if SPY stays flat (unlikely with CPI release)
Risk level: HIGH (time decay is brutal if CPI is a non-event) | Skill level: Advanced
⚠️ Risk Factors
Don't get caught off guard by these potential landmines:
-
🌡️ January CPI on February 11 is the make-or-break catalyst. December CPI was 2.7% YoY with sticky shelter costs. A hot print (above 2.8%) could trigger the selloff the bear put spread needs. But a cool print (below 2.5%) could spark a fierce rally that makes this trade worthless fast. The Fed needs to see inflation progress before cutting.
-
🎲 $690 gamma wall is the bull's best friend. With 566.4 GEX -- the STRONGEST level on the board -- market makers will aggressively sell puts and buy stock near $690, creating a floor. Bears need to overwhelm this mechanical support to push SPY lower. It's not impossible (major selloffs blow through gamma levels), but it's a headwind.
-
🕐 14 days isn't much time for a 4.6% drop. While SPY has fallen 2.9% from its ATH already, the implied move through Feb 20 is only +/-1.92%. The bear put spread needs roughly 2.4x the implied move to reach max profit. Historically, SPY makes moves this large in 14 days only about 10-15% of the time.
-
🏦 The Fed put still exists. With rates at 3.50-3.75%, the Fed has room to cut if markets crash. Even the threat of an emergency cut could stabilize prices. The CME FedWatch shows a 48% chance of a cut by June -- the market knows the safety net is there.
-
📈 S&P 500 earnings are actually strong. Q4 2025 is delivering 11.9% YoY growth with 13.2% profit margins -- the highest margins since FactSet began tracking. Fundamentals argue against a sustained crash.
-
🛃 Tariff escalation is the wild card. With effective rates at Depression-era highs, any surprise escalation (especially targeting tech supply chains) could accelerate the selloff. But tariff de-escalation would remove a major fear factor.
-
🏡 Government shutdown creates data uncertainty. Delayed economic releases mean the Fed and markets are operating partially blind. The January jobs report has no confirmed release date, and GDP was pushed to Feb 20. Missing data can cut both ways -- it creates uncertainty that may keep VIX elevated.
-
🌐 Record international capital flight. $51B flowed into international ETFs in January while SPY bled $11.23B. This rotation away from US equities could accelerate if macro data deteriorates further.
🎯 The Bottom Line
Here's the deal: A whale just risked $700K on a bear put spread that pays out $93+ million if SPY drops to $651 by February 20 OPEX. That's a 142:1 reward-to-risk ratio on what is effectively a bet that the S&P 500 falls 4.6% in the next two weeks.
What this trade tells us:
- Someone with serious capital sees real downside risk through February OPEX
- They timed it to capture TWO major catalysts: Jan CPI (Feb 11) and Q4 GDP (Feb 20)
- The $656/$651 strikes target a zone well below all gamma support -- they're betting on a sharp, fast selloff
- At $700K for a $93M payoff, this is classic tail risk hedging -- the kind of trade that portfolio managers put on to protect billions in long exposure
- Executed at 11:37 AM with urgency (bought puts at ASK) -- they wanted this on NOW
The macro backdrop supports the bearish thesis:
- Labor market deteriorating rapidly (JOLTS at 3.5-year lows, payrolls +50K)
- Consumer confidence at decade lows
- $660B in Big Tech capex triggering the "Great Sector Rotation"
- Government shutdown creating data blackout
- Tariffs at Depression-era levels
- SPY bleeding $11.23B in outflows
BUT the bullish case is alive too:
- Gamma support at $685-$690 is real -- dealers will defend these levels mechanically
- Net GEX bias is still slightly bullish
- Q4 earnings are solid (11.9% growth, record margins)
- Fed has room to cut if things deteriorate
- Manufacturing expanding for first time in a year (ISM 52.6)
If you own SPY:
- This trade is a WARNING to tighten stops or add some protection
- Consider buying Feb 20 puts at $680 for cheap insurance ahead of CPI
- Don't panic sell at gamma support ($685) -- that's where bounces happen
- Mark February 11 (CPI) on your calendar in RED -- that's the day that determines direction
If you're bearish:
- A smaller version of the same spread ($656/$651) costs only ~$34 per contract -- affordable lottery ticket
- Wait for CPI on Feb 11 -- if it's hot, puts will move fast
- Watch for a break below $685 as the trigger for cascading selling
- Keep position size small -- this is a low-probability, high-reward play
If you're on the sidelines:
- This is a great time to WAIT for clarity
- CPI on Feb 11 will set the tone for the rest of February
- If SPY pulls back to $675-$680, that's your dip-buy zone with strong gamma support
- If SPY breaks above $690 resistance, momentum could carry to $700+
Mark your calendar -- Key dates:
- February 11, 2026 -- January CPI release (THE catalyst for this trade)
- February 20, 2026 -- Q4 GDP Advance Estimate + Monthly OPEX (trade expiration!)
- March 6, 2026 -- February jobs report
- March 17-18, 2026 -- FOMC Meeting + Economic Projections (91.1% hold probability)
- May 2026 -- Powell's term expires, Warsh transition begins
- November 2026 -- Debt ceiling projected hit
Final verdict: SPY's long-term outlook remains constructive -- the economy is growing, earnings are solid, and the Fed stands ready to support. But the near-term is loaded with landmines: CPI, GDP, shutdown, tariffs, and a massive sector rotation. This $700K bear put spread is smart money saying "I'll pay a small price for the chance to profit massively if things go wrong in the next two weeks."
The probability of max profit is low (~15%), but the risk/reward is absurd (142:1). This is the kind of asymmetric trade that institutional risk managers love -- spend a little, protect a lot.
Is the selloff over? CPI on February 11 will tell us. Until then, stay nimble. 🎯
⚠️ Disclaimer: Options trading involves substantial risk of loss and is not suitable for all investors. This analysis is for educational purposes only and does not constitute financial advice. Past performance does not guarantee future results. The bear put spread analyzed has a low probability of reaching max profit (~15% based on implied move analysis). A $5-wide put spread can lose 100% of the premium paid. The 142:1 reward-to-risk ratio reflects the theoretical maximum -- most spreads do not reach max profit. Always do your own research and consider consulting a licensed financial advisor before making trading decisions. SPY can move 2-3% on major economic data releases (CPI, GDP) without warning.
About SPDR S&P 500 ETF Trust: SPY is the world's first and most actively traded ETF, tracking the S&P 500 Index. With ~$705.55 billion in AUM, a 0.0945% expense ratio, and holdings spanning all 11 GICS sectors, SPY serves as the primary benchmark for U.S. equity market performance. Top sectors include Information Technology (32%), Health Care (12%), Financials (14%), and Consumer Discretionary (11%).