🐻 SPY: Someone Just Dropped $20M on a Bear Put Spread -- Hedging for a Market Pullback Before Triple Witch!
📅 March 6, 2026 | 🔥 Unusual Activity Detected
🎯 The Quick Take
A major institutional player just built a $20.3M bear put spread on SPY -- buying 17,500 March 20 $648 puts and simultaneously selling 17,500 March 20 $641 puts in a single execution at 9:32 AM. The net debit is roughly $1.7M, and the trade maxes out if SPY drops below $641 (about -4.7% from where it is now) by Triple Witch expiration in two weeks. With non-farm payrolls collapsing, oil surging from the US-Iran conflict, and the S&P 500 CAPE ratio sitting at a nose-bleed 40.54, this looks like a professional portfolio hedge ahead of CPI data and the FOMC meeting.
🏢 Company Snapshot
SPDR S&P 500 ETF Trust (SPY) -- The most traded ETF on the planet. If you trade options, you know SPY:
- 📊 What it is: Tracks the S&P 500 index -- the 500 largest US companies by market cap
- 💰 AUM: ~$680B+ (the benchmark for US equities)
- 🏢 Sector: Large-Cap US Equities (ETF)
- 📈 Exchange: NYSE Arca
- 📊 Current Price: ~$673 (flat YTD despite a turbulent macro backdrop)
- 🔑 Key Story: The S&P 500 is stuck. A surprise NFP miss, rising geopolitical tensions with Iran, surging energy prices, and extreme valuations (CAPE at 40.54) have created a tug-of-war between dip buyers and institutional hedgers.
💰 The Option Flow Breakdown
📊 The Tape
| Time | Ticker | Side | Buy/Sell | Type | Strike | Expiration | Size | Premium | Spot | Price | Volume | OI | Symbol |
|---|---|---|---|---|---|---|---|---|---|---|---|---|---|
| 09:32:57 | SPY | MID | BUY | PUT $648 | $648 | 2026-03-20 | 17,500 | $11M | $672.80 | $6.55 | 18,000 | 26,000 | SPY20260320P648 |
| 09:32:57 | SPY | MID | SELL | PUT $641 | $641 | 2026-03-20 | 17,500 | $9.3M | $672.80 | $5.31 | 18,000 | 2,300 | SPY20260320P641 |
Strategy: Bear Put Spread (buy higher strike put, sell lower strike put)
🤓 What This Actually Means
Let me break this down in plain English.
At 9:32 AM, someone executed a textbook bear put spread on the S&P 500 ETF. They bought the $648 put for $6.55 and sold the $641 put for $5.31, paying a net debit of $1.24 per spread ($6.55 - $5.31). Multiply that by 17,500 contracts and 100 shares each, and you get a net cost of roughly $2.17M to put this hedge on.
Here is why this trade screams institutional:
✅ Massive size -- 17,500 contracts per leg. The $641 put had only 2,300 open interest before this trade -- the volume of 18,000 absolutely dwarfs existing positions. The sell leg has a z-score of 81.29 (about 81 standard deviations above average trade size). You might see a trade this large a handful of times per quarter in SPY options.
✅ Executed at mid -- Both legs filled at the midpoint of the bid-ask spread, the hallmark of an institutional desk that negotiated the fill. This is not someone market-ordering on a phone app.
✅ Same timestamp, both legs -- Both legs executed at 09:32:57. This is a spread order, not two separate trades. It was structured and executed as a single strategy.
✅ Defined risk, defined reward -- Max loss: ~$2.17M (the net debit). Max profit: $7 spread width minus $1.24 debit = $5.76 per spread x 17,500 contracts = ~$10.1M if SPY is below $641 at expiration.
✅ Risk/reward ratio: roughly 1:4.6 -- Risk $2.17M to make up to $10.1M. That is an extremely efficient hedge structure.
What is the thesis?
This trader is positioning for SPY to drop at least 3.7% (to $648) and ideally below $641 (-4.7%) by March 20 -- just 14 days away. The $648 level sits near the recent support zone. The $641 level would represent a meaningful breakdown from current price action.
With Triple Witch (quarterly options + futures + index options expiration) on March 20, this is likely a tactical portfolio hedge rather than a pure directional bet. The narrow spread width ($7) and short expiration suggest someone protecting a large equity portfolio against a sharp but contained pullback over the next two weeks. Think of it as buying insurance for your house during hurricane season -- you hope you do not need it, but you sleep better knowing it is there.
📈 Technical Setup / Chart Check-Up
YTD Chart
SPY is essentially flat year-to-date -- the kind of chop that exhausts both bulls and bears. After starting 2026 near $680, the index has been grinding sideways as macro headwinds (tariffs at 16.8% effective rate, weakening jobs data, geopolitical risk) offset strong corporate earnings from 2025.
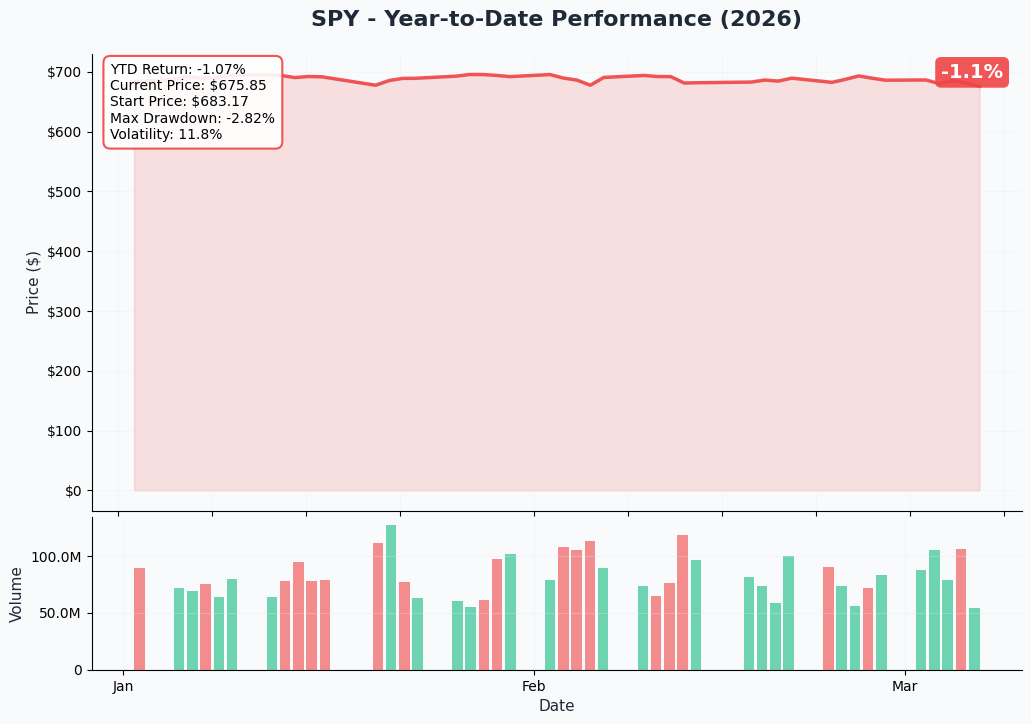
Key levels on the chart:
📉 February NFP shock -- Non-farm payrolls unexpectedly fell by 92,000 in February, the worst jobs print in years. This shifted the narrative from "soft landing" to "are we heading into a recession?" and added fuel to the rate cut argument.
📈 Dip-buying resilience -- Despite all the bad news, the Dow bounced 200+ points on March 3 as traders bought the dip. The market keeps finding buyers at lower levels -- but for how long?
📊 Range-bound -- SPY has been trapped between roughly $660 and $685 for weeks. This bear put spread is betting on a break below that range.
🔵🟠 Gamma-Based Support & Resistance
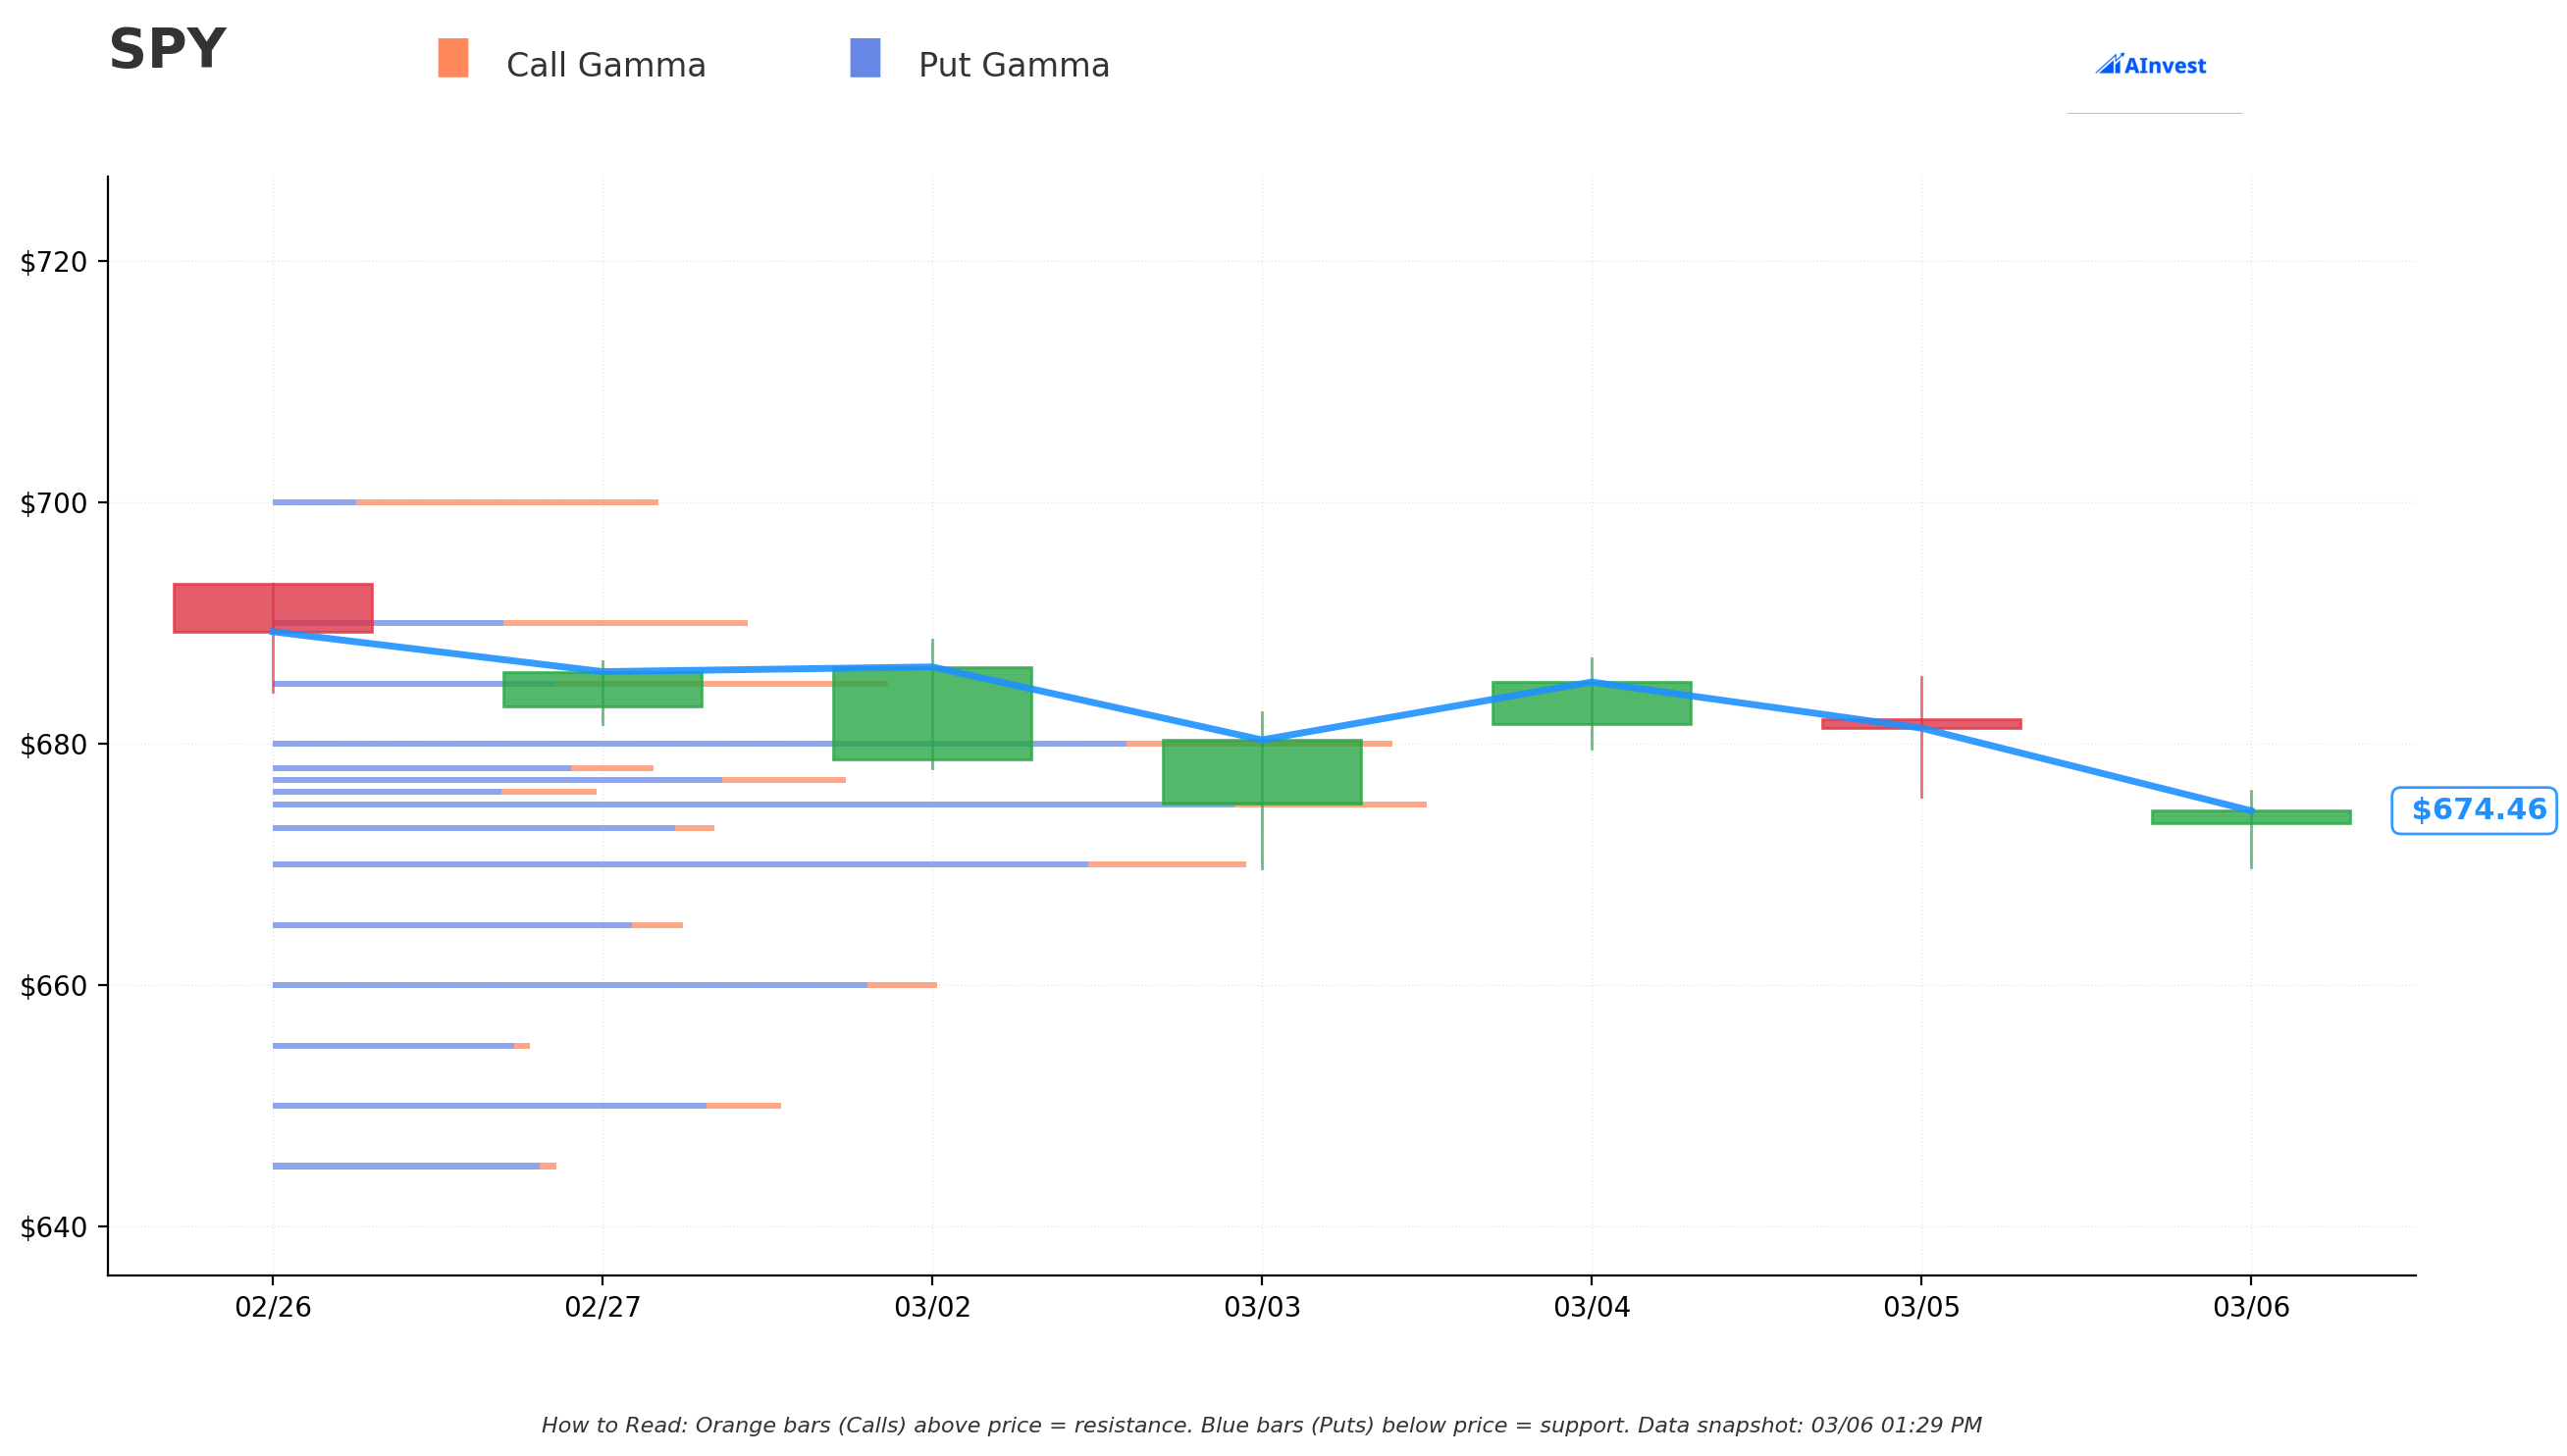
Current Price: ~$675.75
The gamma exposure map shows where options dealers have concentrated their positions, creating natural price magnets and speed bumps. Here is what stands out:
🔵 Support Levels (Put Gamma Below Price):
- $675 -- Strongest immediate support with 389.7 total gamma exposure (just 0.1% below current price -- this is the immediate floor)
- $670 -- Major support with 301.4 total gamma (0.9% below -- first real downside test)
- $660 -- Strong structural support with 223.9 total gamma (2.3% below)
- $650 -- Deep support with 169.9 total gamma (3.8% below -- right between the two spread strikes!)
🟠 Resistance Levels (Call Gamma Above Price):
- $677 -- First resistance at 227.1 total gamma (just 0.2% above -- tight ceiling)
- $680 -- Major resistance wall at 489.2 total gamma (0.6% above -- the BIG level to watch)
- $685 -- Meaningful resistance at 221.8 gamma (1.4% above)
- $690 -- Extended resistance at 187.8 gamma (2.1% above)
- $700 -- Round-number resistance at 138.9 gamma (3.6% above)
What this means for traders:
SPY is squeezed between the $675 support and the $680 gamma wall overhead. That $680 level has the highest total gamma in the entire chain -- nearly 489 units. For the index to rally, it needs to punch through that wall, which would require significant buying pressure. On the flip side, a break below $675 opens the door to a quick move toward $670 and then $660.
Net GEX Bias: Bearish -- Total put gamma ($4,031) is more than double total call gamma ($1,900). When put gamma dominates, dealers are short puts and need to sell into declines to hedge. This creates a negative feedback loop on the way down -- meaning if SPY breaks below $675, the move could accelerate.
This bearish gamma positioning directly supports the rationale behind the bear put spread. The dealer hedging flows could amplify any downside move.
📐 Implied Move Analysis
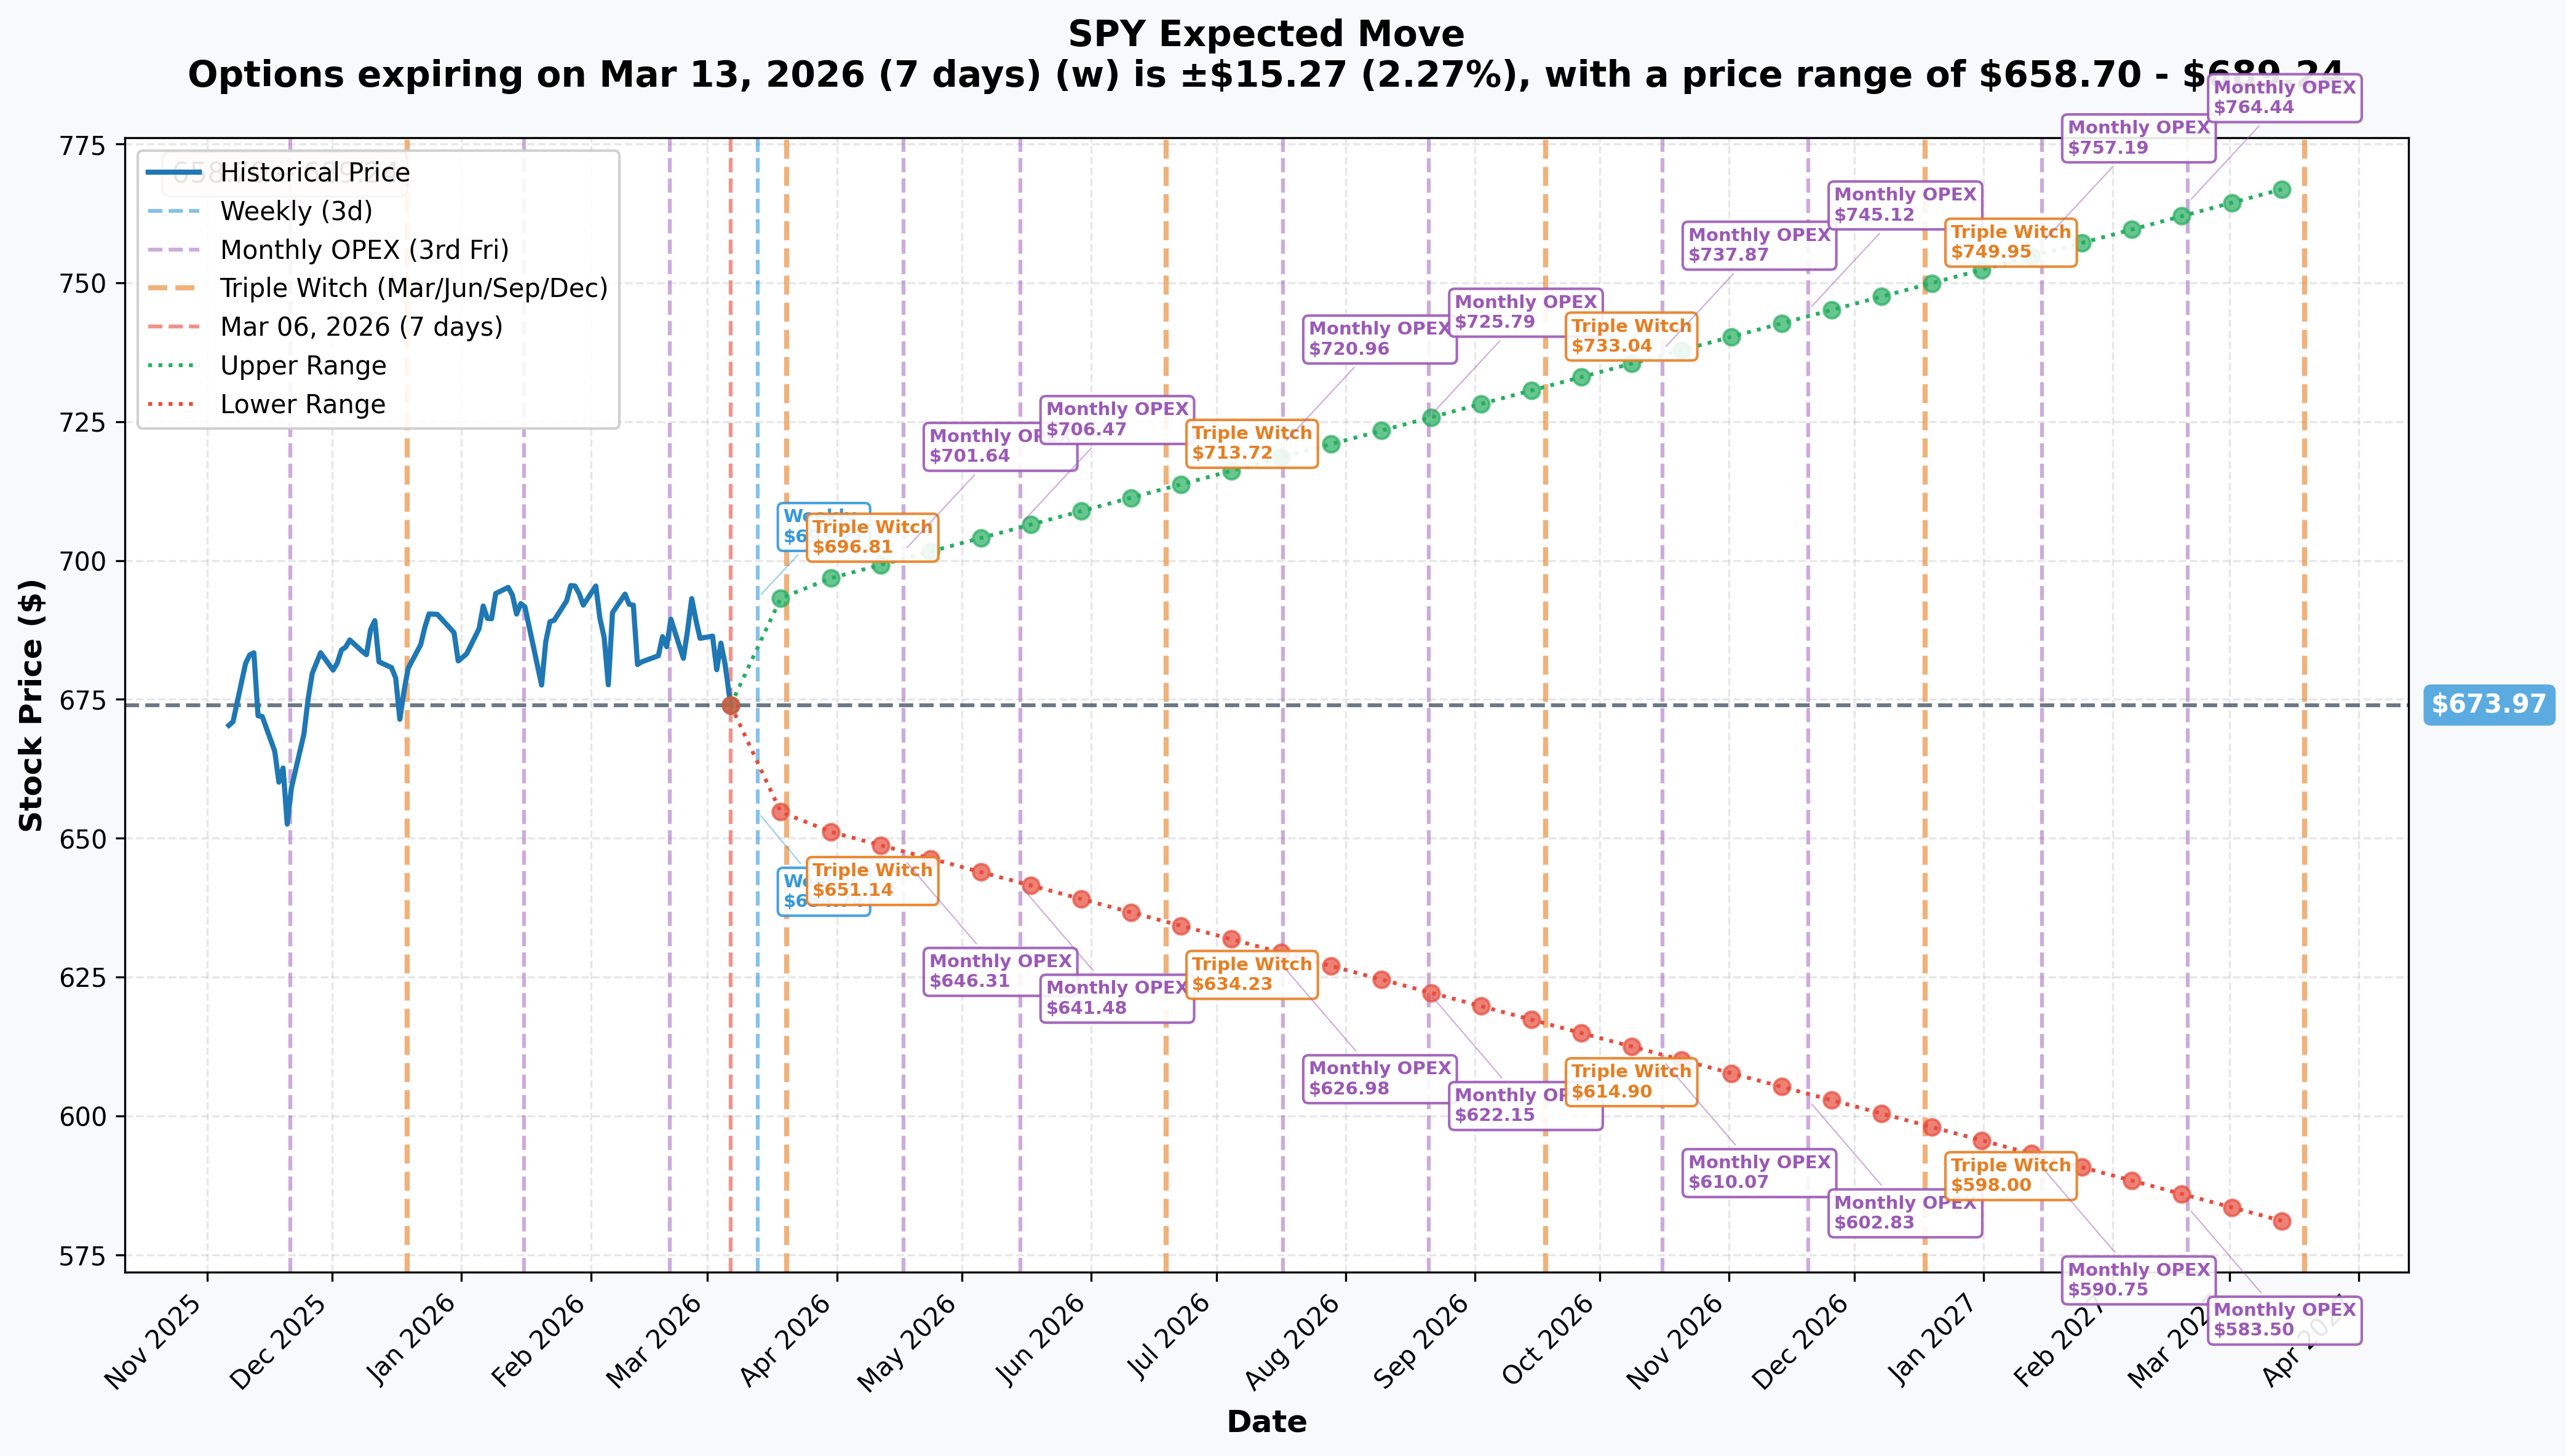
The options market is pricing in the following expected ranges based on implied volatility:
| Timeframe | Expiration | Expected Range | Move % |
|---|---|---|---|
| 📅 Weekly | 2026-03-13 | $658.70 - $689.24 | +/- 2.3% |
| 📅 Monthly / Triple Witch | 2026-03-20 | $653.15 - $694.80 | +/- 3.1% |
| 📅 April OPEX | 2026-04-17 | $646.31 - $701.64 | +/- 4.1% |
| 📅 Yearly LEAPs | 2027-03-19 | $579.88 - $768.06 | +/- 14.0% |
For the March 20 expiration (the one this bear put spread targets):
📉 Implied downside: $653.15 -- The market expects SPY could drop as low as $653 by Triple Witch. The $648 long put strike sits below this level, meaning the market views a move to $648 as possible but slightly beyond the one-standard-deviation expected range. The trader is betting on a full downside move -- or more.
📈 Implied upside: $694.80 -- On the bullish side, $695 is the upper bound. If SPY rallies instead, the bear put spread simply expires worthless and the trader loses the ~$2.17M debit.
Key insight: The $641 short put strike (max profit level) sits roughly $12 below the implied move lower bound of $653. That means the options market views a move below $641 as a tail event -- roughly a 15-20% probability. But that is exactly how portfolio hedges work: you pay a small premium for protection against an unlikely-but-damaging event. And with NFP crashing, oil surging, and CAPE at 40.54, the tails might be fatter than the market thinks.
🎪 Catalysts
✅ Already Happened (Recent)
📊 February NFP Miss (-92,000 jobs) -- This was a shock. The US economy was supposed to be adding jobs, not losing them. A -92K print is the kind of number that makes the Fed sit up and pay attention. It signals genuine labor market deterioration, not just a "soft patch."
⛽ US-Iran Military Conflict Escalation -- Tensions in the Persian Gulf have driven oil prices sharply higher. Tanker operators have halted some deliveries. Energy price spikes act like a tax on consumers and corporations alike, and they directly feed into inflation -- the worst possible combination with a weakening jobs market.
📈 S&P 500 CAPE Ratio at 40.54 -- For context, the long-term average CAPE is 17. The 2021 pandemic peak was 36.9. At 40.54, we are in uncharted territory. This does not mean a crash is imminent, but it means the margin of safety is razor-thin.
📊 March 3 Dip-Buy Rally -- The Dow bounced 200+ points as traders bought the dip. This shows the market still has dip-buying reflexes, but each successive bounce is testing whether the buyers can hold the line.
🔄 Rotation From Mega-Cap Tech to Value -- Money has been flowing out of the Magnificent Seven and into cyclicals and small-caps. For SPY (which is heavily weighted toward mega-cap tech), this rotation is a headwind even if the overall market is stable.
📅 Upcoming Catalysts
| Date | Event | Why It Matters |
|---|---|---|
| ~March 12 | February CPI Data | Critical for the Fed rate cut path. If energy prices have pushed CPI higher, rate cut expectations get repriced -- bad for stocks |
| March 17-18 | FOMC Meeting + Rate Decision | Market pricing 3 rate cuts in 2026, but geopolitical inflation could force the Fed to hold. Any hawkish surprise would hit SPY hard |
| March 20 | Triple Witch Expiration | Quarterly expiration of options, futures, and index options. Massive gamma-driven volatility expected -- and THIS is the day the bear put spread expires |
| Mid-April | Q1 2026 Earnings Season Begins | S&P 500 earnings growth expectations to be tested against tariff headwinds and weakening demand |
| Ongoing | US-Iran Conflict Trajectory | Further escalation could push oil above $100/barrel and trigger a broader risk-off move across equities |
| Ongoing | Tariff Policy Developments | The effective US tariff rate is at 16.8% -- the highest since the 1930s. Any additional tariffs could create persistent margin compression |
🎲 Price Targets & Probabilities
Using gamma levels, implied move data, and the catalyst calendar, here are the scenarios through the March 20 Triple Witch expiration:
🐻 Bear Case: $640-$648 (-3.7% to -5.0%)
Probability: ~20%
How we get there:
- 😰 February CPI comes in hot (energy-driven inflation), killing rate cut hopes
- ⛽ US-Iran conflict escalates further, oil spikes above $90
- 📉 SPY breaks below $675 gamma support, triggering dealer hedging flows that accelerate the move
- 📊 Cascading through $670, $660, and $650 gamma support levels
- 🎢 Triple Witch gamma expiration creates a volatility vortex on March 20
Bear put spread P&L at $641 or below: Max profit = ~$10.1M (spread width $7 minus $1.24 debit = $5.76 x 17,500 x 100) Bear put spread P&L at $648: Breakeven -- the long put is at-the-money, but the spread is just starting to pay off (~$0 net)
This is the scenario the trader is explicitly hedging against. The bearish gamma positioning (puts outweighing calls 2:1) means dealer hedging could amplify any breakdown below $675.
⚖️ Base Case: $660-$680 (roughly flat to -2%)
Probability: ~55%
Most likely scenario:
- ✅ CPI data comes in line or slightly elevated, keeping rate cut timeline intact
- 📊 FOMC holds rates as expected, signals data-dependent approach
- ⚖️ SPY continues to chop between $670 and $680, with the $680 gamma wall capping rallies
- 🔄 Dip buyers defend the $670-$675 support zone
- 📈 Triple Witch creates short-term volatility but no sustained directional move
Bear put spread P&L: The spread is out-of-the-money and expires worthless. Loss = ~$2.17M (the net debit). For a portfolio hedge, this is the cost of insurance -- and a cost the trader was clearly willing to pay.
🚀 Bull Case: $685-$700 (+1.4% to +3.6%)
Probability: ~25%
How we get there:
- 📈 CPI comes in cooler than expected, reinforcing the Fed rate cut narrative
- 🕊️ US-Iran tensions de-escalate or a ceasefire framework emerges
- 💪 SPY breaks through the $680 gamma wall, triggering dealer short-covering that fuels a rally to $685-$690
- 📊 Positive momentum from dip buyers and institutional rebalancing
- 🎯 $700 round-number magnet comes into play
Bear put spread P&L: Expires worthless. Loss = ~$2.17M. But if the trader is hedging a large equity portfolio, their stock holdings more than make up for this loss with the rally.
💡 Trading Ideas
🛡️ Conservative: "The Insurance Policy" -- Bull Put Spread
Structure: Sell SPY $660 put / Buy SPY $650 put, 2026-03-20 expiration
Why this works: You collect premium by betting SPY does NOT fall below $660 by Triple Witch -- a level that sits below two major gamma support zones ($675 and $670) and the implied move lower bound ($653). Multiple safety nets have to fail before this trade loses money.
📊 Estimated credit: ~$1.50-$2.00 per spread 📊 Max risk: ~$8.00-$8.50 per spread 📊 Max profit: Premium collected (if SPY stays above $660) 📊 Win probability: ~75-80% 📊 Best for: Premium collectors who think the market stays range-bound despite the scary headlines
⚖️ Balanced: "Ride the Gamma" -- Put Debit Spread (Follow the Whale)
Structure: Buy SPY $670 put / Sell SPY $660 put, 2026-03-20 expiration
Why this works: This mirrors the institutional thesis at a more achievable level. Instead of needing SPY to fall to $648, your long put starts paying off at $670 -- which is only 0.9% below the current price and right at a major gamma support level. If that support cracks, you're in the money.
📊 Estimated cost: ~$3.00-$3.50 per spread 📊 Max profit: ~$10 per spread minus debit = ~$6.50-$7.00 per spread (at $660 or below) 📊 Breakeven: ~$666.50-$667.00 📊 Risk/reward: ~1:2 📊 Best for: Traders who see the macro risks (CPI, FOMC, geopolitical) as underpriced and want defined-risk downside exposure through Triple Witch
🚀 Aggressive: "The Volatility Play" -- Long March 20 Straddle at $675
Structure: Buy SPY $675 call + Buy SPY $675 put, 2026-03-20 expiration
Why this works (and why it is risky): With CPI data, the FOMC meeting, and Triple Witch all landing in the same 14-day window, the chances of a big move in either direction are elevated. SPY is pinned between $675 support and $680 resistance with massive gamma on both sides. When gamma is this concentrated, the eventual breakout tends to be violent. A straddle profits from a large move regardless of direction.
📊 Estimated cost: ~$12-$14 per straddle 📊 Breakeven: SPY below ~$661 or above ~$689 (roughly +/- 2.1%) 📊 Max profit: Unlimited in either direction 📊 Risk: 100% of premium if SPY stays pinned near $675 📊 Best for: Volatility traders who believe the market is underpricing the combined risk of CPI + FOMC + Triple Witch. Only risk what you can afford to lose.
Pro tip: If you are directionally bearish (aligned with the institutional trade), consider a ratio put spread: buy 1x $670 put, sell 2x $655 puts for a net credit or near-zero cost. You profit on a move to $660 with defined risk below $640.
⚠️ Risk Factors
❗ Stagflation Risk Is Real -- Rising oil prices combined with a -92K NFP print is the textbook setup for stagflation (inflation + recession). If CPI confirms this on March 12, the market could have an ugly reaction. But stagflation fears could also be overblown if the NFP miss was a one-month anomaly.
❗ Geopolitical Uncertainty -- The US-Iran conflict is the wildcard nobody can model. Further escalation could spike oil above $100 and trigger broad risk-off selling. Conversely, any de-escalation headline could spark a relief rally and make the bear put spread expire worthless.
❗ Triple Witch Gamma Vortex -- March 20 is a quarterly Triple Witch expiration. These events create massive gamma-driven price swings, often in both directions within the same session. The bearish net gamma positioning increases the probability of a sharp down move, but Triple Witch can be chaotic and unpredictable.
❗ Fed Surprise Risk -- The market expects the FOMC to hold rates at its March 17-18 meeting. But any hawkish shift in the dot plot or a surprise mention of inflation concerns from energy prices could trigger a selloff. On the other hand, a dovish lean or emergency rate cut signal would send stocks soaring.
❗ CAPE at 40.54 Does Not Mean Crash -- Extreme valuations tell you about long-term expected returns, not short-term price action. Markets can stay expensive for years. The CAPE ratio is a risk factor, not a timing tool.
❗ This Is a Hedge, Not Necessarily a Prediction -- The single most important thing to understand about this trade is that it may be portfolio insurance, not a directional bet. A fund manager running a $1B+ equity portfolio might spend $2M on downside protection the same way you buy car insurance. It does not mean they expect a crash -- it means they want to sleep at night during a turbulent two-week stretch.
🎯 The Bottom Line
Here's the deal: Someone with very deep pockets just spent $20.3M in total premium to build a bear put spread that pays off big if SPY drops below $641 by Triple Witch on March 20. The net cost of the hedge is roughly $2.17M, and the max payout is over $10M. That is a 1:4.6 risk/reward ratio on a trade that expires in just 14 days.
What this trade tells us:
- 🎯 Institutional money is taking the macro risks seriously -- NFP collapse, surging oil, US-Iran tensions, and extreme valuations are not just headlines to them
- 💰 They are willing to spend $2M+ on two weeks of downside protection, suggesting they are managing a VERY large equity portfolio
- ⏰ The March 20 expiration is strategic: it captures CPI data (March 12), the FOMC meeting (March 17-18), AND Triple Witch -- three potential volatility catalysts in a single trade
- 📊 The bearish net gamma positioning (puts 2:1 over calls) means dealer hedging flows could amplify any breakdown below $675
If you are cautious about the market: Consider defined-risk put spreads with closer-to-the-money strikes ($670/$660) that do not require as large a move. The $675 gamma support is the key level to watch -- a daily close below it could trigger the cascade. Mark your calendar for March 12 (CPI) and March 17-18 (FOMC) as the two events most likely to move the needle.
If you are watching from the sidelines: This is a time to be patient. The next two weeks are loaded with macro catalysts, and the $675-$680 range is tightly wound. Wait for a confirmed break in either direction before committing capital. If SPY breaks above $680, the bull case is alive. If it breaks below $670, the bear case accelerates.
If you are bullish: Respect the institutional hedging. The dip-buying reflex has worked so far in 2026, but the macro backdrop is deteriorating. If you want to stay long, consider using the bull put spread at lower strikes ($660/$650) to collect premium while maintaining downside protection. The $680 gamma wall is the resistance level that needs to break for bulls to regain control.
Key dates to mark:
- 📅 March 12 -- February CPI data release (inflation from energy prices = critical)
- 📅 March 17-18 -- FOMC meeting and rate decision (market pricing 3 cuts this year -- will the Fed agree?)
- 📅 March 20 -- Triple Witch expiration AND this bear put spread expires (moment of truth)
- 📅 Mid-April -- Q1 2026 earnings season begins (testing whether corporate America can withstand tariffs + weakening demand)
Final thought: This $20M bear put spread is not a panic trade -- it is a calculated insurance policy from someone who can do math. The macro risks are stacking up: jobs are shrinking, oil is surging, tariffs are at 1930s levels, and the market is priced at the most expensive level in history. That does not mean a crash is coming. But it does mean the person managing your pension fund's equity book probably just bought some downside protection. Maybe you should think about whether you need some too. 👀
Disclaimer: This analysis is for informational purposes only and does not constitute financial advice. Options trading involves significant risk of loss and is not suitable for all investors. Always do your own research and consider your risk tolerance before entering any trade. Spread strategies involve multiple commissions and may not be suitable for all account types. Past unusual options activity is not a reliable predictor of future price movement.
About SPDR S&P 500 ETF Trust: SPY is the world's most actively traded exchange-traded fund, tracking the S&P 500 index of 500 large-cap US companies. Managed by State Street Global Advisors with over $680B in assets under management, SPY is the benchmark instrument for US equity exposure and the most liquid options market in the world.