🐻 SPY $33.6M Put Blitz — Institutions Are Loading Up on Downside Protection!
📅 March 10, 2026 | 🔥 Unusual Activity Detected
🎯 The Quick Take
Someone just dropped $33.6 MILLION across 7 coordinated put trades on SPY this morning at exactly 10:45:31 — all targeting the $645–$660 zone with March 13 and March 20 expirations. This isn't panic selling; it's surgical institutional hedging arriving just days before February CPI hits and the March 18 FOMC decision. Translation: Big money is strapping on crash helmets right now, and we should be paying attention.
📊 ETF Overview
SPDR S&P 500 ETF Trust (SPY) — the world's most traded ETF and the heartbeat of the U.S. stock market:
- AUM: ~$650B (largest ETF on planet Earth)
- Issuer: State Street Global Advisors (SSGA)
- Index Tracked: S&P 500 — 500 largest U.S. public companies
- Expense Ratio: 0.0945%
- Top Holdings: Over 40% of assets concentrated in Nvidia, Microsoft, Apple, Amazon, Meta, Alphabet, Tesla
- Current Price: $680.21 (spot at time of trades) | YTD Return: -0.66%
- VIX: 25.50 — elevated and climbing (+13.79% in past week)
When SPY gets hit with unusual options flow, it's not some speculative single-stock bet. This is institutions managing real risk on the world's most liquid equity product.
💰 The Option Flow Breakdown
📊 The Full Tape (March 10, 2026 @ 10:45:31 ET)
All 7 trades landed at the exact same millisecond — this is a coordinated institutional block, not random retail flow.
| Date | Time | Symbol | Buy/Sell | Call/Put | Expiration | Strike | Volume | OI | Size | Spot | Option Price | Premium | Option Symbol |
|---|---|---|---|---|---|---|---|---|---|---|---|---|---|
| 2026-03-10 | 10:45:31 ET | SPY | BUY | PUT | 2026-03-13 | $660 | 81K | 130K | 81K | $680.21 | $1.17 | $5.8M | SPY20260313P660 |
| 2026-03-10 | 10:45:31 ET | SPY | BUY | PUT | 2026-03-13 | $650 | 89K | 107K | 89K | $680.21 | $0.58 | $2.9M | SPY20260313P650 |
| 2026-03-10 | 10:45:31 ET | SPY | BUY | PUT | 2026-03-20 | $645 | 62K | 75K | 62K | $680.21 | $2.14 | $7.1M | SPY20260320P645 |
| 2026-03-10 | 10:45:31 ET | SPY | BUY | PUT | 2026-03-20 | $660 | 37K | 15 | 37K | $680.21 | $4.06 | $7.4M | SPY20260320P660 |
| 2026-03-10 | 10:45:31 ET | SPY | BUY | PUT | 2026-03-13 | $660 | 23K | 130K | 23K | $680.21 | $1.17 | $1.9M | SPY20260313P660 |
| 2026-03-10 | 10:45:31 ET | SPY | BUY | PUT | 2026-03-20 | $660 | 62K | 15 | 62K | $680.21 | $4.07 | $6.1M | SPY20260320P660 |
| 2026-03-10 | 10:45:31 ET | SPY | BUY | PUT | 2026-03-20 | $645 | 24K | 75K | 24K | $680.21 | $2.14 | $2.4M | SPY20260320P645 |
TOTAL PREMIUM DEPLOYED: ~$33.6M | ALL BUY PUTS | ALL AT $660/$650/$645 STRIKES
🤓 What This Actually Means
Let me break this down because it's more nuanced than just "bears are attacking."
First — the STO vs STC distinction matters a lot here:
- 🟠 STO (Sell-to-Open) = Opening NEW put positions — Trades #3 and #6 are freshly opening put hedges totaling $13.2M. These players are buying brand new downside protection as we speak.
- 🔵 STC (Sell-to-Close) = Buying back previously SOLD puts — Trades #1, #2, #4, #5, #7 are buying back short put positions they had previously written. This means they're removing the obligation to buy SPY at those levels.
Why does this matter? Both actions are bearish signals but for different reasons:
- The STO trades say: "I'm scared enough to pay for new protection right now."
- The STC trades say: "I sold puts earlier (bullish bet), but I'm nervous enough to close that position and no longer want to be obligated to catch a falling knife."
The $660/$645 cluster tells the story:
With SPY at $680.21, these puts sit $20–$35 below current price (a 3–5% discount). This is textbook portfolio insurance territory — not a panic bet, but a calculated hedge against a near-term pullback of that magnitude. Think of it like buying $200K in homeowner's insurance when your house is worth $250K — responsible risk management, not a prediction of fire.
Plot twist worth noting: Yesterday (March 9) saw $141M in PUT SELLING on SPY — a massively bullish bet. Today's $33.6M in put buying could be a different institution doing the opposite — reversing that thesis entirely. Big money is not one monolithic view; they're arguing with each other in the options market right now. 👀
Unusual score check:
- Trade #6 — Z-score 7.89 is the standout: roughly 4–8 times the typical size for SPY Mar 20 $660 puts. That happens maybe a handful of times per year on this strike.
- Trade #4 — Z-score 4.48 on the same $660 Mar 20 strike (nearly zero existing OI of just 15 contracts before this trade) — this was opening into essentially nothing.
- Trades #3 and #7 at $645 Mar 20 (Z-scores 4.07 and 1.41) confirm the $645 floor is where this hedger thinks things get truly ugly.
📈 Technical Setup / Chart Check-Up
YTD Performance Chart
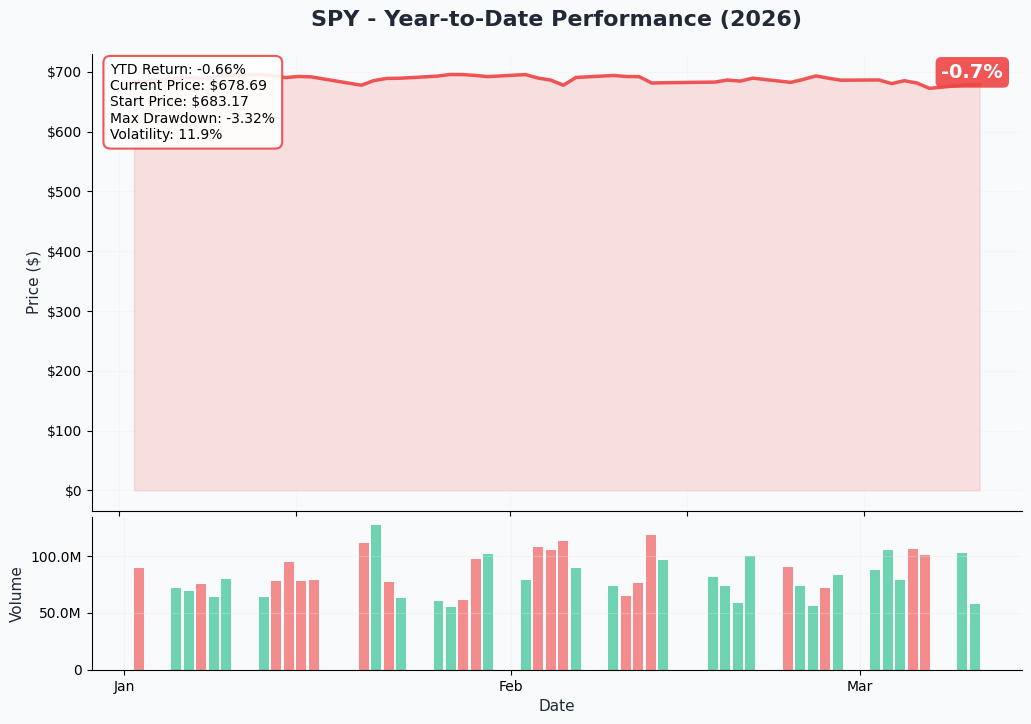
SPY started 2026 at $683.17 and is sitting at $678.69 — down just 0.66% YTD — but don't let the flat line fool you. The chart conceals a max drawdown of -3.32% and a volatility spike that has made the recent price action uncomfortable. After a largely sideways January and February, the March selloff is accelerating — SPY fell from $681 to $672 on March 6 alone (down 1.28% in a single session).
Key chart observations:
- 📉 Slow-motion decline in progress: Not a crash, but a grinding selloff that's wearing down bulls
- 📊 Volume confirming the move: Above-average selling volume in early March consistent with institutional de-risking
- 🎢 Annualized volatility at 11.9%: Elevated for SPY — normally this sits below 10% in calm markets
- ⚠️ Still well below the 200-day MA conversation: But 100-day MA was breached March 9 — that's the yellow flag
🔵🟠 Gamma-Based Support & Resistance Analysis
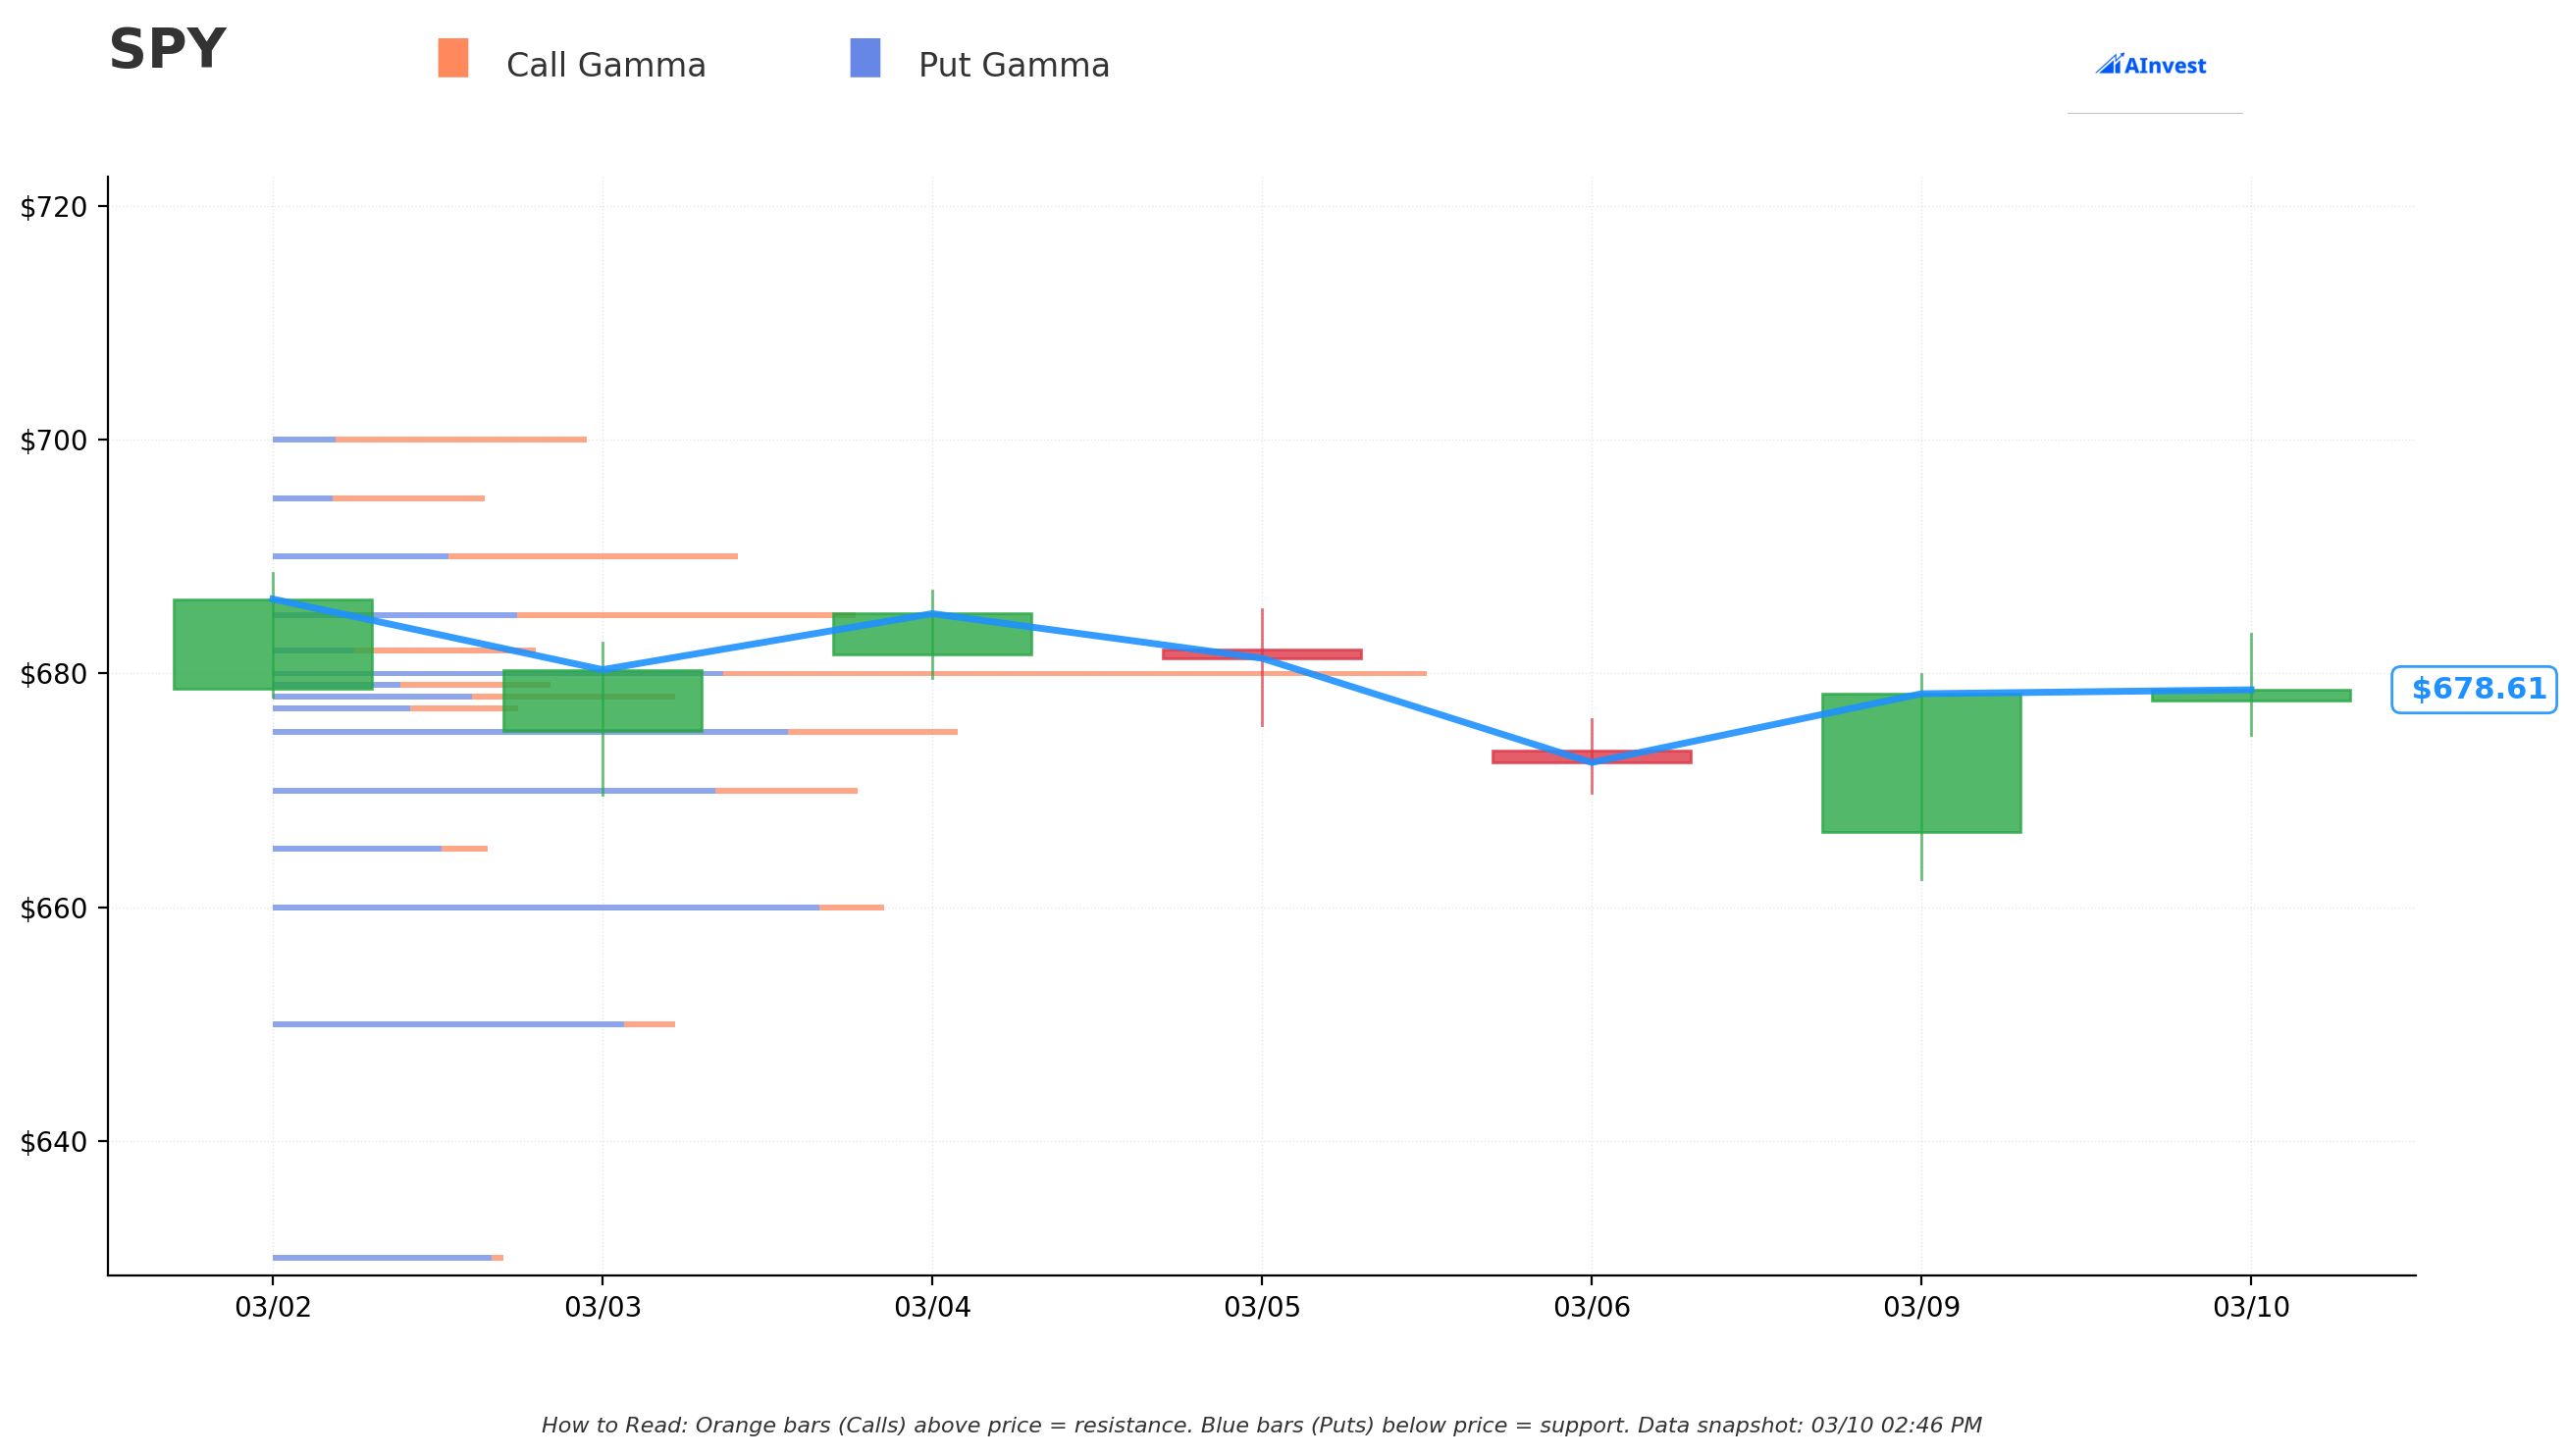
Current Price: $679.03 | GEX Bias: BEARISH
The gamma chart is telling a clear story over the past week. Since the "Iran Shock" weekend (March 2–3), the price has waterfall-stepped down from $684 to $678, and the put gamma (blue bars) is now dominating the landscape below $679.
🔵 Key Support Levels (Put Gamma Below Price):
- $679 — Immediate gamma support (current price is sitting on this floor RIGHT NOW)
- $675 — Secondary put gamma cluster visible in the chart from early March consolidation
- $660 — Major gamma concentration (this is exactly why the institutions are buying puts HERE — this is where market makers have heavy put exposure, creating a natural price magnet if selling intensifies)
- $645 — Extended support zone (the deepest put cluster bought today — disaster protection)
🟠 Key Resistance Levels (Call Gamma Above Price):
- $680 — Immediate resistance (current GEX data shows resistance right at $680 — just $1 above spot)
- $685 — Secondary resistance from declining call gamma overhead
- $700 — Extended resistance visible in early March data (now well overhead)
What this means for us:
The GEX bias is Bearish with support at $679 and resistance at $680. SPY is literally sandwiched in a $1 band right now — that's a coiled spring. The options market is pricing a battle at this exact price level, and the put buying we just saw is betting the spring breaks to the downside toward $660.
Why $660 matters so much: Both the gamma map AND today's trades converge on $660 as the critical level. If SPY breaks below $679 gamma support and can't recover, the next logical magnetic level is $660 — where a massive cluster of put open interest will attract price action like gravity.
📐 Implied Move Analysis
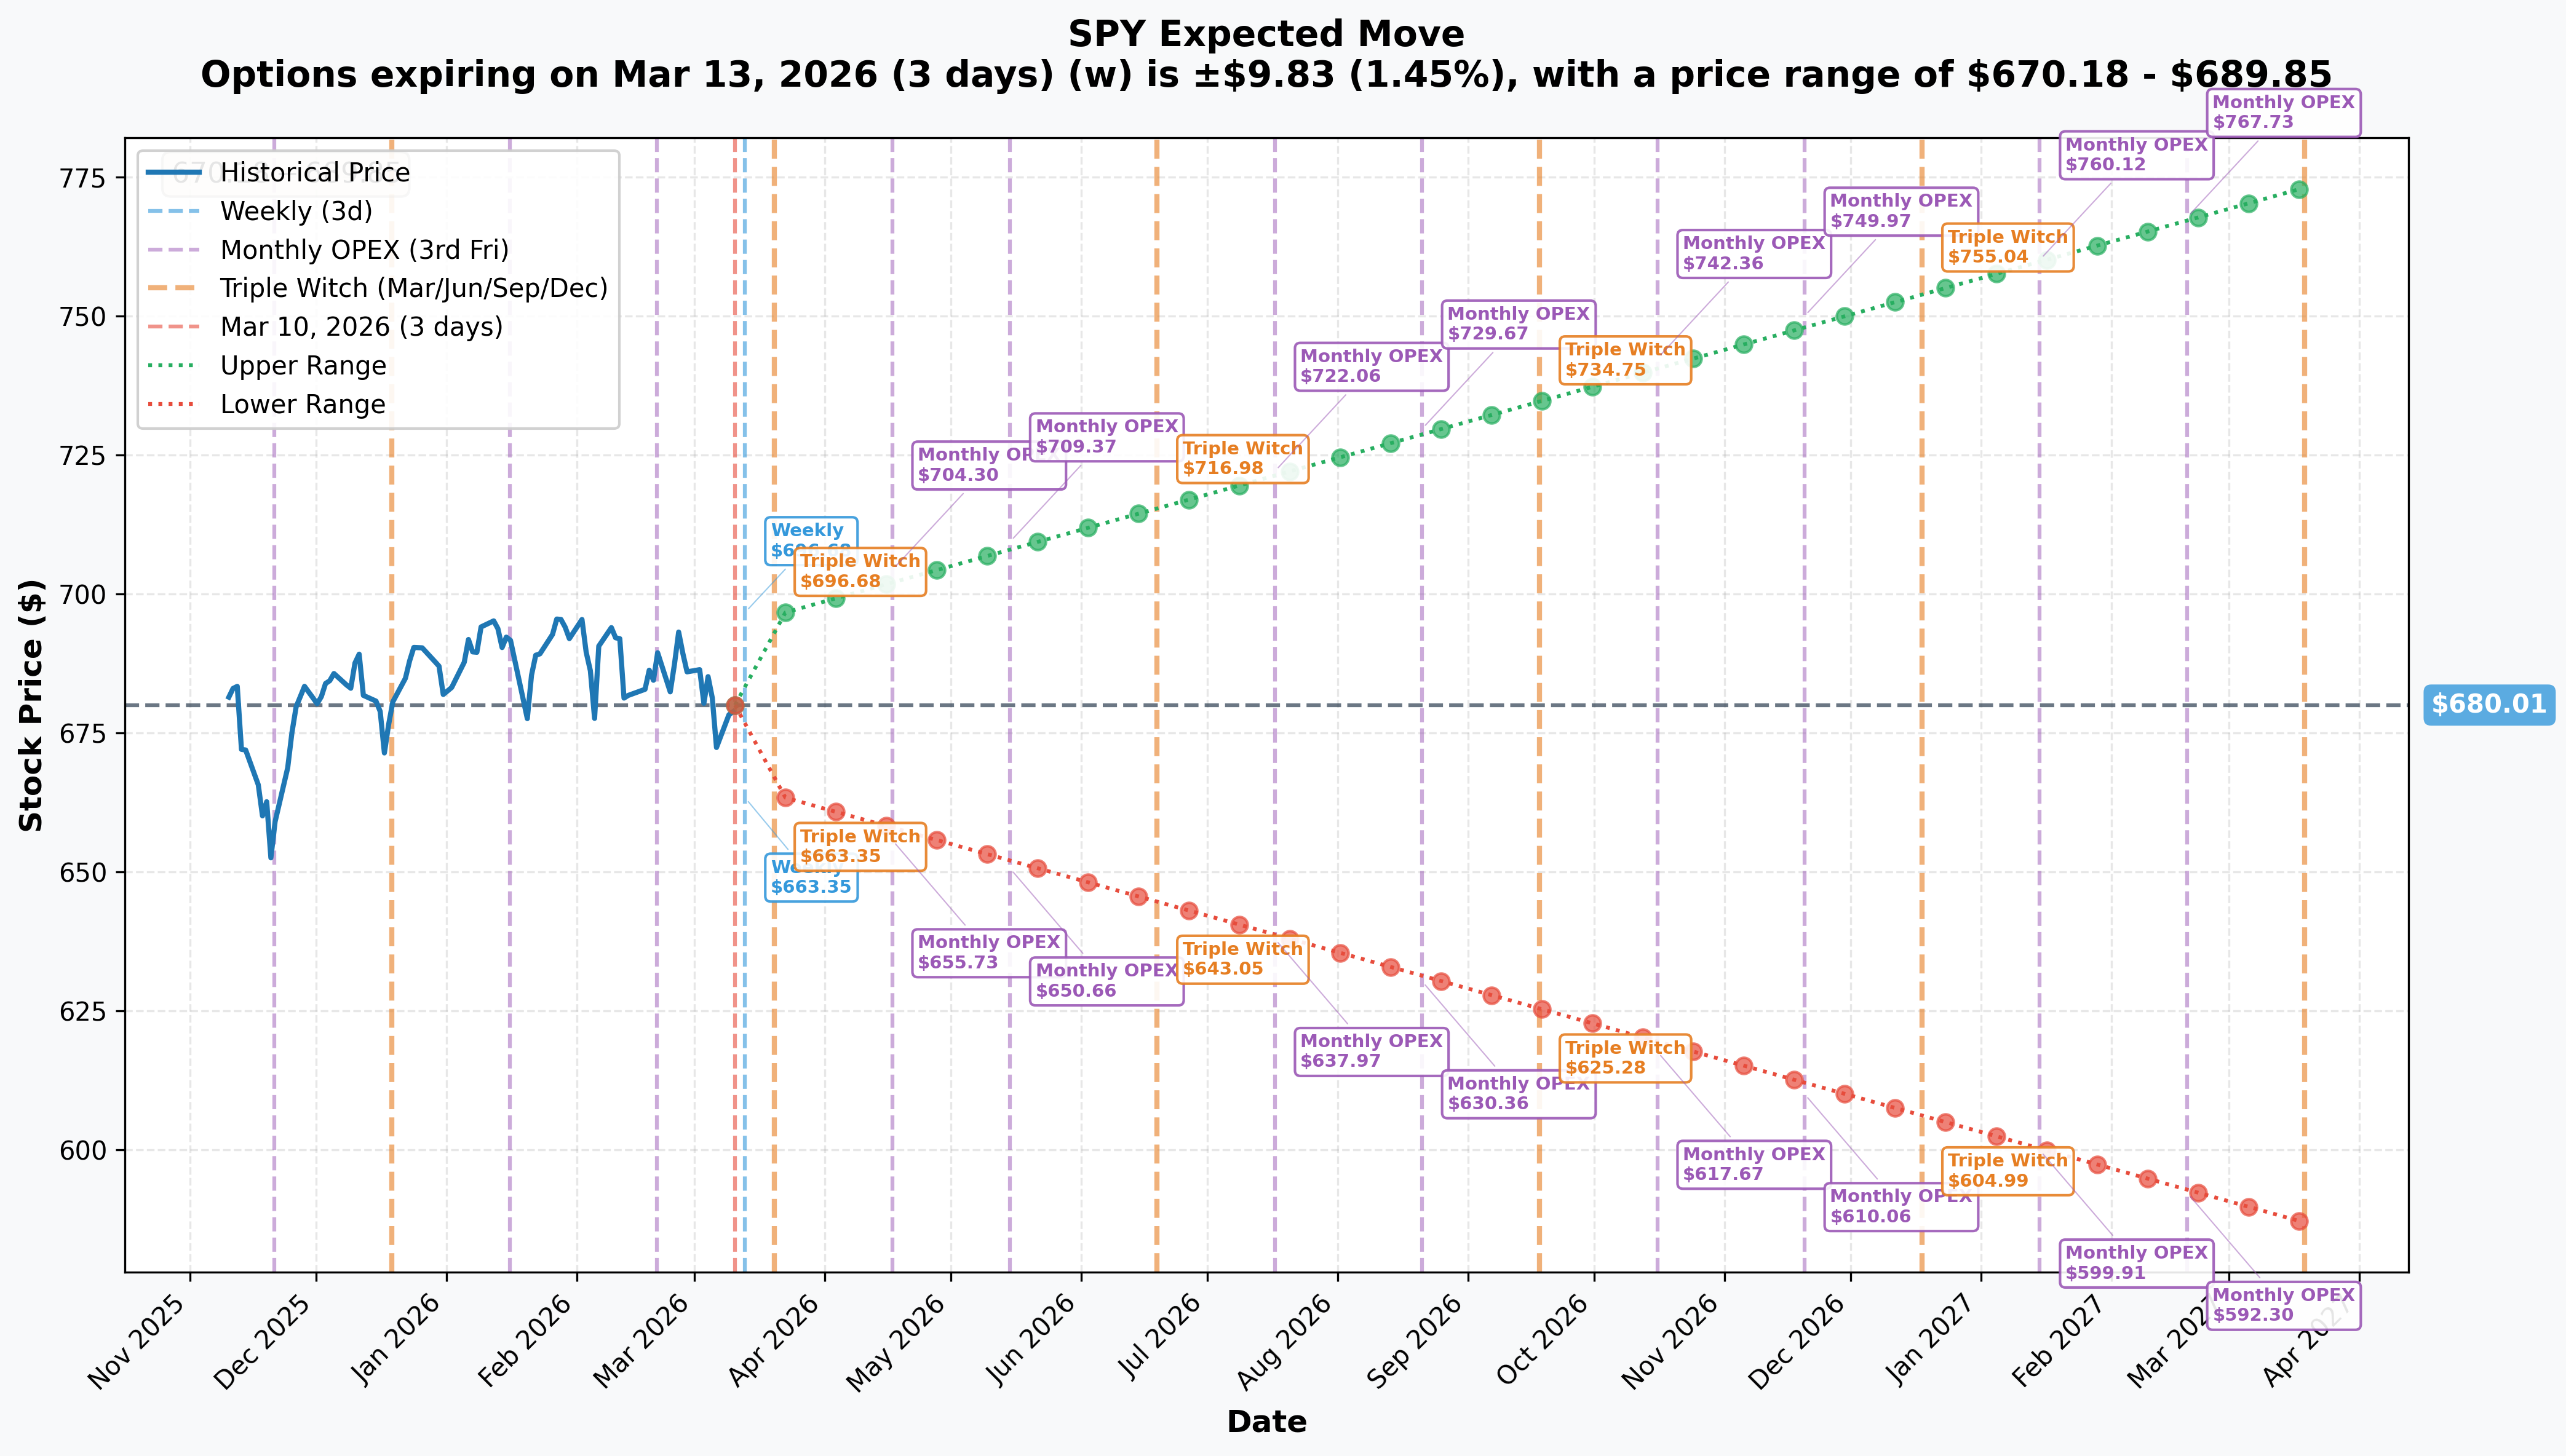
Options expiring March 13, 2026 (3 days away):
- Implied move: ±1.45% (±$9.83)
- Expected range: $670.18 – $689.85
Translation for regular folks: The options market is saying there's a roughly 68% chance SPY stays inside that $670–$690 band through this Friday. But here's the catch — CPI is expected around March 12–13 and that's a binary event that could blow right through those bounds.
What the implied move calendar tells us:
- March 13 (3 days): ±$9.83 range → The weekly options today's traders are closing reflect CPI binary risk baked into this window
- March 20 (Triple Witch Week): Implied range expands significantly — this expiration captures BOTH the March 12–13 CPI print AND the March 18 FOMC decision — it's stacking two major catalysts into one expiration window
- Beyond April: The downward-sloping lower band in the chart shows the market pricing ongoing downside risk through Q2 2026
The key insight: The Mar 20 puts at $660 and $645 (the STO "opening" trades) are positioning for a scenario where both CPI AND FOMC disappoint in the same week. That's a 2.94% to 5.15% move from current levels — well outside the weekly implied move but right in line with what the March 18 FOMC surprise scenario could deliver.
🎪 Catalysts
🔥 Immediate Catalysts (Next 7–10 Days)
February CPI Report — ~March 12–13, 2026 (THIS WEEK!) 🌡️
The February 2026 CPI print is the trigger for the Mar 13 puts bought today. After tariff-driven core goods inflation re-acceleration, a hot print would:
- Slam rate-sensitive tech stocks (40%+ of SPY weight) — if yields spike, the dominant sector bleeds
- Further compress the near-zero equity risk premium (currently just 0.02% — among the lowest on record)
- Kill any remaining hope of a 2026 Fed rate cut
FOMC Rate Decision — March 18, 2026 (NEXT WEEK!) 🏦
The Federal Reserve's March meeting is the bigger catalyst the Mar 20 puts are positioned around. Current market pricing:
- 8% probability of a cut
- 92% probability of no change — and Powell may actually sound MORE hawkish given tariff inflation data
If Powell signals fewer cuts for 2026, the market will price in "higher for longer" just as the equity risk premium is already near zero. That's the scenario the Mar 20 put buyers are protecting against — and they're paying up for it.
VIX at 25.50 and rising (+13.79% in one week) 📈
Fear is already elevated. When VIX is spiking into major binary catalysts, option protection gets expensive — and these institutions bought it anyway. That tells you something.
⚠️ Recent Catalysts (Already Happened — Still Reverberating)
"Iran Shock" — Operation Epic Fury (Weekend of March 2–3, 2026) 🛢️
Coordinated U.S.-Israeli military strikes on Iran triggered a historic VIX surge and gapped SPY lower at the open. Oil spiked toward $116/barrel, sending energy stocks soaring while tech — the heavy half of SPY — sold off sharply. This created the "catalyst cocktail" the market is still digesting.
S&P 500 Breaches 100-Day Moving Average (March 9, 2026) 📉
Yesterday's technical breakdown of the 100-day MA is no small thing. Technical analysts widely treat this as the line between "healthy correction" and the start of a trend change. The S&P is now "in price discovery mode" targeting 6,500 — which maps roughly to SPY $650 area. Sound familiar? That's exactly where today's deepest put strike sits.
Fed Holds Rates Unchanged — January 27–28, 2026
The January FOMC paused cuts, with minutes revealing staff attributed recent inflation "largely to the effects of higher tariffs." That language set the stage for a hawkish March.
📅 Upcoming Catalysts (Beyond March 18)
- Q1 2026 Earnings Season (Late April – May): With 15% EPS growth consensus baked in, any downward guidance revisions from tariff margin compression will hurt hard
- Iran / Middle East escalation risk: Strait of Hormuz disruption could spike oil to $130–$140 — a global growth shock
- AI Capex signals from hyperscalers: Nvidia, Microsoft, Meta, and Amazon collectively drive a huge chunk of SPY's premium valuation — any capex pullback commentary hits the whole index
- Q2/Q3 Volatility Cycle: Cycle analysis projects "elevated probability of volatility in Q2/Q3 2026" with only 3 of 8 major market cycles projecting the year finishing higher
🎲 Price Targets & Probabilities
Using today's gamma levels, implied move data, and macro catalyst stack:
📈 Bull Case (20% probability)
Target: $685–$695
How we get there:
- 🌡️ CPI comes in at or below expectations — inflation fears ease
- 🏦 Powell sounds dovish at March 18 FOMC — signals possible 2026 cut back on the table
- 🌍 Iran ceasefire or de-escalation removes geopolitical premium, oil retreats from $116
- 📈 SPY breaks above $680 gamma resistance, triggers short-covering squeeze
- 🚀 Short squeeze through $685 toward the $690 upper implied move bound
Why only 20%? The macro setup is stacked against bulls — near-zero equity risk premium, sticky tariff inflation, 100-day MA already broken. It would require EVERY catalyst to resolve favorably in the same 8-day window.
🎯 Base Case (50% probability)
Target: $668–$680 (Choppy, grinding range)
Most likely scenario:
- 📊 CPI in-line (not great, not terrible) — market chews on it without a panic reaction
- ⚖️ FOMC holds as expected with neutral tone — "no change" widely anticipated
- 🎢 SPY oscillates between $679 gamma support and $680 gamma resistance
- 📉 Grinding drift lower toward $668–$672 as the slow-motion decline continues without a sharp catalyst
This is the scenario where most of today's puts expire worthless or with minimal value — and that's fine for the buyers. They paid $33.6M not because they're certain SPY crashes, but because the risk of being wrong without protection is too large for the size of their underlying positions.
📉 Bear Case (30% probability)
Target: $660–$645 (The Put Buyer's Payoff Zone)
What sends SPY into this range:
- 😰 Hot CPI print — core above 3.5% — forces the market to reprice "no cuts ever"
- 🏦 Powell hawkish surprise at FOMC — dot plot shows fewer 2026 cuts, sends yields higher
- 🛢️ Iran escalation — oil spikes above $120, compression across consumer/industrial margins
- 📉 Break below $679 gamma support triggers mechanical selling pressure toward $660 gamma floor
- 💥 AI capex concerns emerge (Nvidia commentary, hyperscaler CapEx guidance cuts)
Critical levels:
- 🛡️ $679: Gamma support — the LINE IN THE SAND right now. Bears need this to crack.
- 🛡️ $660: Major gamma magnet — exactly where today's heaviest put buying is clustered
- 🛡️ $645: The deepest bear scenario — equivalent to S&P 500 testing the 6,500 level that analysts are watching
Why 30% — higher than you'd expect for a 3–5% drop in 10 days? Because the stacking of CPI + FOMC in the same 8-day window, with Iran still active and the 100-day MA already broken, creates genuine binary risk. This isn't a normal week.
💡 Trading Ideas
🛡️ Conservative: "Sit Tight and Watch the Fireworks"
The Play: Stay in cash or hold your SPY shares without adding exposure until after March 18 FOMC.
Why this works:
- ⚠️ TWO binary events in 8 days (CPI + FOMC) create whipsaw risk in both directions
- 💸 Options are expensive right now — VIX at 25.50 means you're paying a lot for directional bets
- 🎯 Better entry prices likely available post-FOMC after the volatility event clears
- 🐋 The $33.6M put buy tells you smart money is nervous — why fight them?
Action plan:
- 👀 Watch CPI on ~March 12–13 for direction signal
- 📊 Mark $679 as your key level — break below = bearish confirmation
- ✅ After FOMC clears (March 18), reassess with fresh gamma data
- 🎯 Potential re-entry on a bounce at $660 gamma support with defined stop
Risk level: Minimal | Skill level: Beginner-friendly
⚖️ Balanced: "The Poor Man's Hedge" (Put Spread)
The Play: Buy a put spread to define your risk while capturing the $660 target scenario.
Structure: Buy $675 put / Sell $660 put — March 20 expiration (captures both CPI + FOMC)
Why this works:
- 📊 Defined risk — max loss is your debit paid, max gain is the $15 spread width
- 🎯 Targets the exact $660 level where today's biggest institutional put activity clusters
- ⏰ March 20 expiration is ideally sized — contains both binary events
- 🤝 You're effectively "copying" the institutional thesis at retail-sized risk
Estimated costs (check live quotes before entering):
- 💰 Debit approximately $4–6 per spread
- 📈 Max profit: ~$9–11 if SPY closes below $660 on March 20
- 📉 Max loss: ~$4–6 if SPY stays above $675 (your full premium)
- 🎯 Breakeven: ~$669–671
Position sizing: Risk only 2–4% of your portfolio on this. This is a directional bet against the trend of recent all-time highs — size it accordingly.
Risk level: Moderate | Skill level: Intermediate
🚀 Aggressive: "Ride the Wave with Short-Dated Puts" (Advanced Only!)
The Play: Buy outright puts on the March 13 expiration to play the CPI event directly.
Structure: Buy $670 puts — March 13 expiration (3 days, pure CPI play)
Why this could work:
- 🌡️ Hot CPI on March 12–13 could gap SPY down 1.5–2.5% in a single session
- ⚡ Short-dated out-of-the-money puts are cheap in absolute dollar terms
- 📈 If SPY breaks below $679 gamma support, momentum could accelerate fast toward $670
Why this could blow up:
- 💸 Theta burns fast: 3-day options lose value at an extreme rate — every hour costs you
- 😱 IV already elevated: You're buying when VIX is at 25.50 — options are expensive
- 🎰 Binary outcome: CPI in-line = these puts go to zero; hot CPI = they could 3–5x
- ❌ If CPI surprises dovish, this position loses everything quickly
Expected P&L:
- 💰 Cost: ~$1.50–2.50 per contract depending on strike
- 🚀 Hot CPI: SPY drops to $670 — puts worth $5–8 (2–5x return)
- 💀 In-line or cool CPI: SPY flat or higher — puts expire worthless
ONLY attempt this if:
- ✅ You understand that 3-day options can and do go to zero
- ✅ You're treating the premium as money you're willing to lose entirely
- ✅ You have a strict rule to exit at 50% loss and not add
Risk level: EXTREME | Skill level: Advanced only
⚠️ Risk Factors
Don't get steamrolled by these:
-
🌡️ CPI binary risk (~March 12–13): A cool CPI print would likely spark a sharp relief rally and crush the value of all put positions. The market has been positioned bearishly — a positive surprise gets squeezed hard.
-
🏦 Dovish FOMC surprise (March 18): With only 8% probability of a cut currently priced, any hint from Powell of flexibility toward cutting would trigger a massive short squeeze. Tail risk to the upside is real.
-
🛢️ Oil / Iran de-escalation: The "Iran Shock" that drove oil to $116 and spiked VIX could reverse rapidly on ceasefire news. Energy's 20% gain would unwind, but beaten-down tech could rally hard enough to drag SPY back above $685.
-
📊 Near-zero equity risk premium: The equity risk premium at 0.02% is a two-edged sword. Yes, it creates structural downside vulnerability — but it also means stocks are priced for good news. If good news arrives, the re-rating can be violent.
-
💸 Expensive protection costs: VIX at 25.50 means you're paying elevated implied vol for any options trade. If realized volatility doesn't match implied, you bleed premium from both directions.
-
🐋 The $141M put selling yesterday: March 9 saw massive put selling on SPY — someone was aggressively bullish on SPY holding its level. That institution hasn't disappeared. Conflicting institutional views = choppier price action.
-
🔄 STC trades = less conviction than they appear: Five of the seven trades today were Sell-to-Close (closing short put positions). That's not new bearish conviction — it's reducing risk. Interpret this as "nervous" rather than "aggressive bear."
-
📉 S&P 500 15% EPS growth consensus as the floor: If earnings deliver on the ~15% growth expectation for 2026, the bull case has genuine fundamental support. Don't forget that an ETF tracking 500 companies has diversification working for it.
🎯 The Bottom Line
Real talk: $33.6 million in coordinated, simultaneous put buying at $660/$650/$645 is not random. The exact same millisecond across 7 trades, all targeting strikes that represent 3–5% below spot, arriving 2 days before CPI and 8 days before FOMC — this is institutional hedging, and it's surgical.
What today's flow tells us:
- 🎯 Smart money thinks the risk of a 3–5% pullback over the next 10 days is worth paying $33.6M to protect against — and these are people managing portfolios far larger than the premium they paid
- 💰 This is NOT a "SPY is going to crash" bet — it's "we made money and we don't want to give it back during CPI + FOMC week"
- ⚖️ The mix of STO (new hedges) and STC (closing old bullish puts) tells us institutions are reducing their net bullish exposure — pulling chips off the table
- 🔑 The $660 level is the KEY number to watch — both the gamma map and today's largest trades converge there
- 📊 GEX bias is Bearish with support/resistance compressed into a $1 band ($679/$680) — this is a coil that breaks hard in one direction soon
If you own SPY:
- ✅ Consider trimming or hedging 20–30% of exposure ahead of the CPI/FOMC double-header
- 📊 If SPY breaks below $679 on volume, that's your signal to reduce further
- 🎯 If you want cheap insurance, a put spread targeting $660 for March 20 is how the pros are playing it
- ⏰ Don't panic-sell everything — the 15% EPS growth consensus for 2026 provides fundamental support on a longer horizon
If you're watching from the sidelines:
- ⏰ March 12–13 — CPI print is the first trigger. Hot print = bear case accelerates. Cool print = relief rally
- 📅 March 18 — FOMC is the bigger event. Powell's tone on tariff inflation is the key variable
- 🎯 Post-FOMC clarity gives you a much better risk/reward entry — either direction
- 🔑 $660 is your line in the sand: Hold above it = bulls regain control. Break it with conviction = next stop $645 per today's gamma map
If you're bearish:
- 🎯 $660 put spread is the cleanest structure (as described above) — defined risk, aligned with institutional positioning
- 📊 Watch for VIX to spike above 27 — that's when panic accelerates
- ⚠️ Be careful chasing — the 100-day MA breach is widely watched, and bearish consensus could mean a short squeeze rather than a continuation
Mark your calendar:
- 📅 ~March 12–13 — February CPI release (CPI data, biggest near-term trigger for Mar 13 puts)
- 📅 March 13 — March weekly options expiration (Mar 13 puts expire — this Friday!)
- 📅 March 18 — FOMC Rate Decision (Powell press conference — the main event)
- 📅 March 20 — Triple Witch expiration (Mar 20 puts expire — max pain dynamics in play)
- 📅 Late April – May — Q1 2026 Earnings Season begins (next fundamental test)
Final call: The macro backdrop — sticky tariff inflation, geopolitical shock from Iran, 100-day MA breach, near-zero equity risk premium, and a Fed that can't cut — is genuinely the worst collection of headwinds SPY has faced in this cycle. The $33.6M put buyers know this. Respect the hedge, protect your capital, and let the CPI + FOMC week play out before making aggressive moves in either direction. 💪
Disclaimer: Options trading involves substantial risk of loss and is not suitable for all investors. This analysis is for educational and informational purposes only and does not constitute financial advice or a recommendation to buy or sell any security. Past performance does not guarantee future results. The unusual activity described reflects specific institutional trades that may involve complex portfolio hedging strategies not applicable to retail investors. The Z-scores cited describe statistical deviation from recent historical averages for these specific strikes — they do not predict future price movement or trade profitability. Always conduct your own due diligence and consult a licensed financial advisor before making any investment decisions. Options can expire worthless, and you can lose 100% of the premium paid.