🚀 TSLA $29M LEAP Bull Call Spread — Betting on $650+ by June 2027!
📅 April 15, 2026 | 🔥 Unusual Activity Detected
🎯 The Quick Take
Someone just placed a $29M bull call spread on Tesla LEAPS, buying 6,001 contracts of the $650 strike and selling 6,001 contracts of the $660 strike — both expiring June 2027, over 14 months out. With TSLA at $375.81, the $650 strike is 73% out-of-the-money, meaning this trader needs TSLA to nearly double just to break even. This is a high-conviction, high-leverage bet on Tesla's Cybercab and robotaxi story playing out over the next year-plus — and they're doing it right before Q1 2026 earnings on April 22.
📊 Company Overview
Tesla (TSLA) is the world's largest pure-play EV manufacturer and an increasingly autonomous vehicle and energy storage company:
- Market Cap: ~$1.2T
- Industry: Electric Vehicles / Autonomous Driving / Energy Storage
- Current Price: $375.81 (down ~20% YTD)
- Primary Business: EV manufacturing, autonomous driving (FSD / robotaxi), energy storage (Megapack), Optimus robots
💰 The Option Flow Breakdown
The Tape (April 15, 2026 @ 10:20:07):
| Time | Option Symbol | Side | Buy/Sell | Type | Expiration | Premium | Strike | Volume | OI | Size | Spot | Option Price |
|---|---|---|---|---|---|---|---|---|---|---|---|---|
| 10:20:07 | TSLA20270617C650 | ASK | BUY | CALL $650 | 2027-06-17 | $15M | $650 | 8,500 | 3,300 | 6,001 | $375.81 | $24.58 |
| 10:20:07 | TSLA20270617C660 | BID | SELL | CALL $660 | 2027-06-17 | $14M | $660 | 8,500 | 462 | 6,001 | $375.81 | $23.53 |
🤓 What This Actually Means
This is a bull call spread on TSLA LEAP options — a structured bet that TSLA will trade above $650 by June 2027. Here's the breakdown:
- 💸 Net premium paid: ~$1M ($24.58 − $23.53 = $1.05/share × 6,001 contracts × 100 shares)
- 🎯 Max profit: $10 per share × 6,001 contracts × 100 = $6M (if TSLA is above $660 at expiry)
- 📉 Max loss: ~$1M net premium paid (if TSLA is below $650 on June 17, 2027)
- 📊 Current distance to strikes: TSLA at $375.81 needs to rally +73% to $650 just to reach the breakeven
- ⏰ Time horizon: 14+ months (June 2027 expiry) — this is a LEAP strategy, not a short-term play
- 🔵 Breakeven: ~$651 (lower strike + net debit of ~$1/share)
What's really happening here: This trader is paying $1M in net premium to control $6M in potential upside if TSLA doubles. They're using the spread structure (buying the $650 and selling the $660 against it) to drastically reduce the cost — instead of paying $24.58 for a naked $650 call, they net it down to roughly $1.05 by selling the $660 against it. This is NOT someone panicking or hedging; this is a high-conviction long-term bull who believes Tesla's robotaxi + Cybercab + Optimus story materializes over the next 14 months.
Why the $650-$660 zone? The gamma and implied move data suggest TSLA's yearly implied range extends to ~$513. Getting to $650 requires outperformance beyond the options market's current central projection — this trader expects Tesla's autonomous vehicle execution to create a significant upside re-rating.
Unusual Score: 🔥 HIGH — Buying 6,001 contracts against only 3,300 existing OI (volume is 2.6x OI) on the $650 strike confirms this is a fresh institutional position being opened. The simultaneous execution of both legs at 10:20:07 is classic institutional spread booking.
📈 Technical Setup / Chart Check-Up
YTD Performance Chart
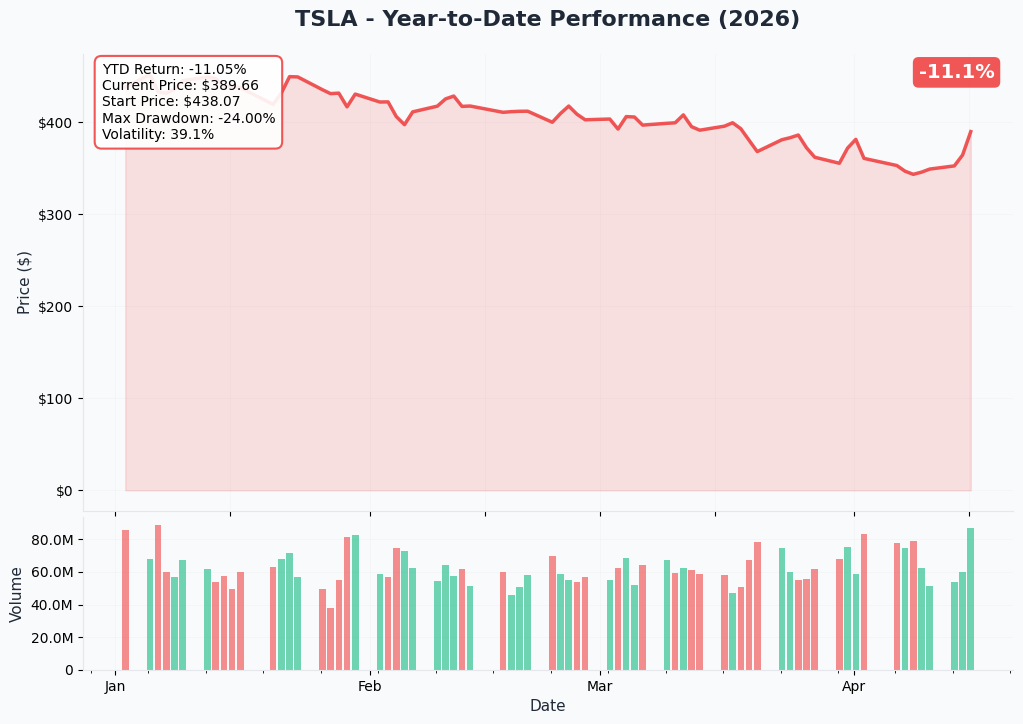
TSLA is down roughly 20% YTD in 2026, after 8 consecutive weeks of losses through mid-April. The stock hit a range of $354.77-$367.63 on April 14 before recovering to the $375 area. Despite the drawdown, TSLA's $1.2T market cap reflects continued market belief in the autonomous and energy storage thesis.
Key observations:
- 😰 8 weeks of losses: The consistent selling pressure reflects real fundamental concerns — delivery misses, inventory build, EV credit expiration
- 🎢 High volatility name: A 31.6% annual implied move (±$123) means swings of 10-15% in either direction are normal
- 🔥 Approaching critical zone: The $375 area is a key near-term pivot — a bounce or break here will set the near-term direction
- 👀 Earnings catalyst incoming: April 22 earnings is the next binary event that could break the streak in either direction
Gamma-Based Support & Resistance Analysis
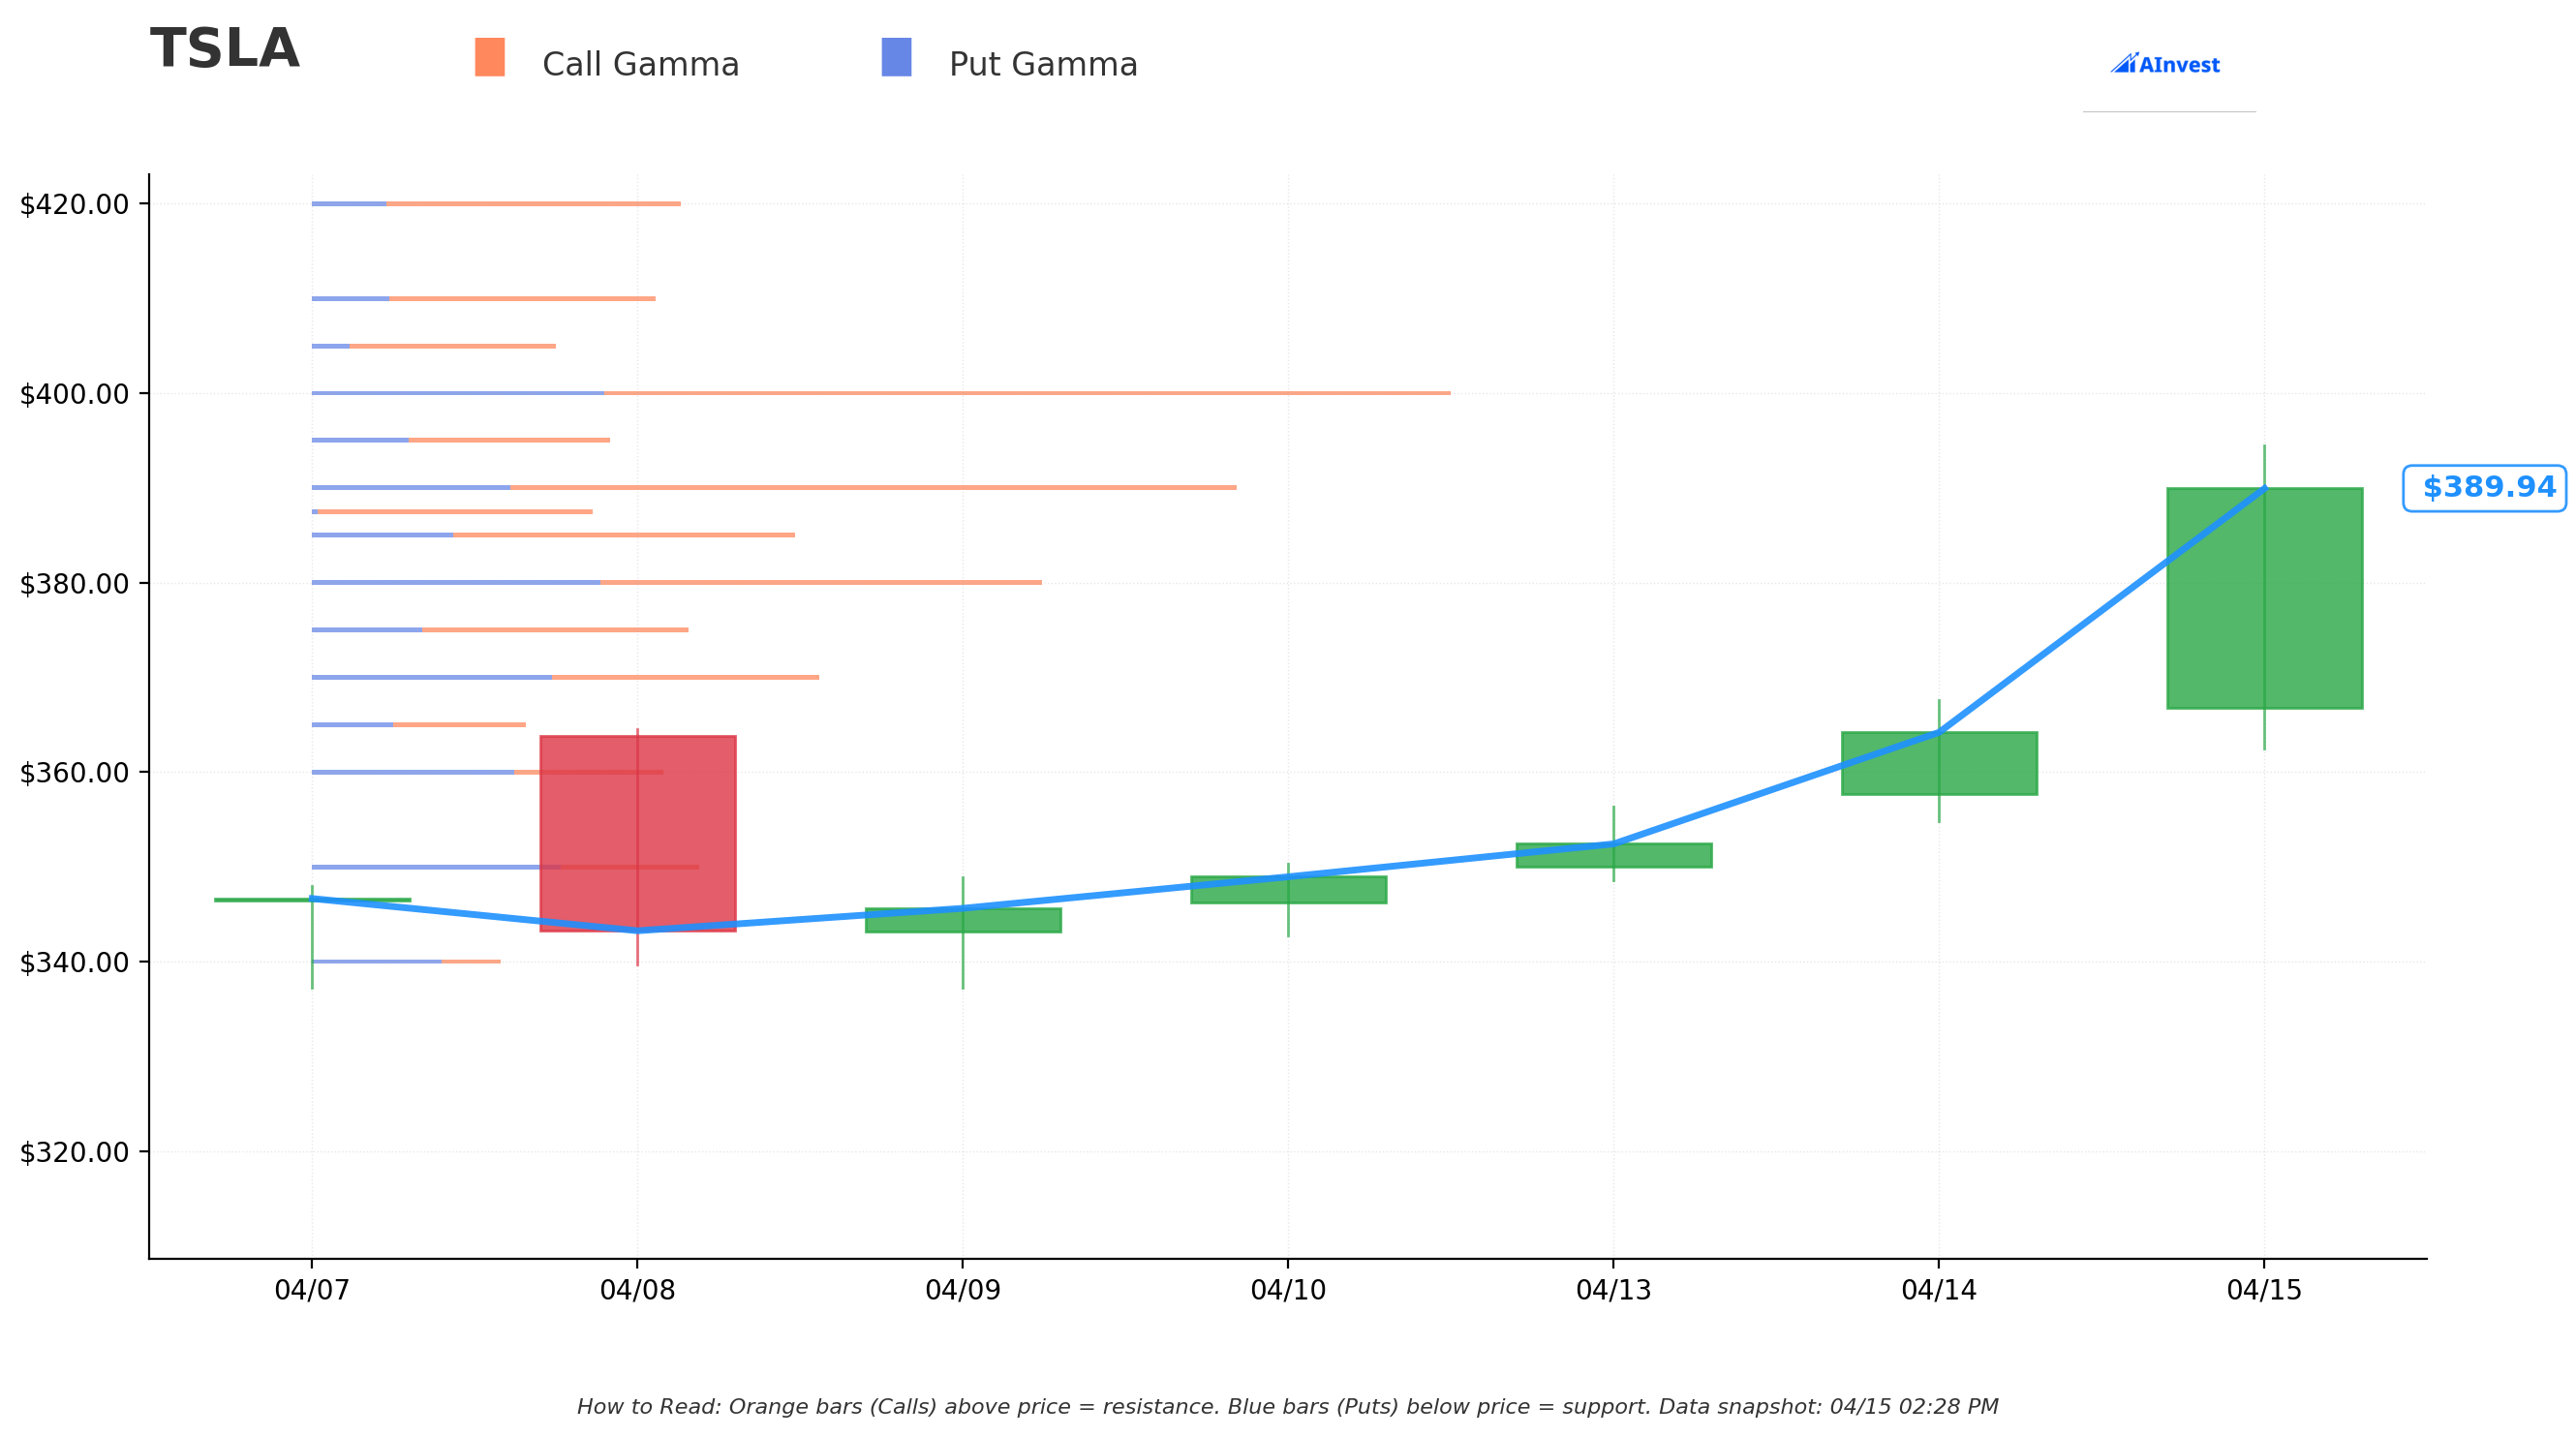
Current Price: ~$375-390
The gamma exposure map for TSLA reveals a closely contested zone with significant levels on both sides:
🔵 Support Levels (Put Gamma Below Price):
- $385 — Nearest support at 25.3B total gamma. This is the first cushion below current price
- $380 — Strong support at 39.1B gamma (STRONGEST SUPPORT LEVEL) — dealers will buy aggressively if TSLA tests $380
- $375 — Current trading zone, 19.5B gamma exposure — watch this level closely
- $370 — Secondary floor at 26.3B gamma (~5% below)
- $360 — Deeper support at 18.3B gamma with put gamma starting to dominate
- $350 — Major support at 20.1B gamma (~10% below) — this is the bear floor
🟠 Resistance Levels (Call Gamma Above Price):
- $390 — Immediate resistance at 47.9B total gamma (STRONGEST RESISTANCE in the map). Stock is just below this right now
- $400 — Major ceiling at 59.1B gamma — the single highest total gamma level. This is the wall to watch
- $410 — Next resistance at 17.8B gamma (~5% above current)
- $420 — Extended resistance at 19.1B gamma (~7.8% above)
What this means for traders: TSLA is sandwiched between massive $380 support and crushing $390-$400 resistance. The $400 level (59.1B gamma) is a fortress — it will take a very strong catalyst to break through. The good news is $380 is equally well-defended on the downside. This is a tightly coiled setup heading into earnings.
Net GEX Bias: Bullish — Call gamma (421B) dwarfs put gamma (199B), suggesting dealers are net long gamma and will naturally lean bullish in their hedging flows.
Implied Move Analysis
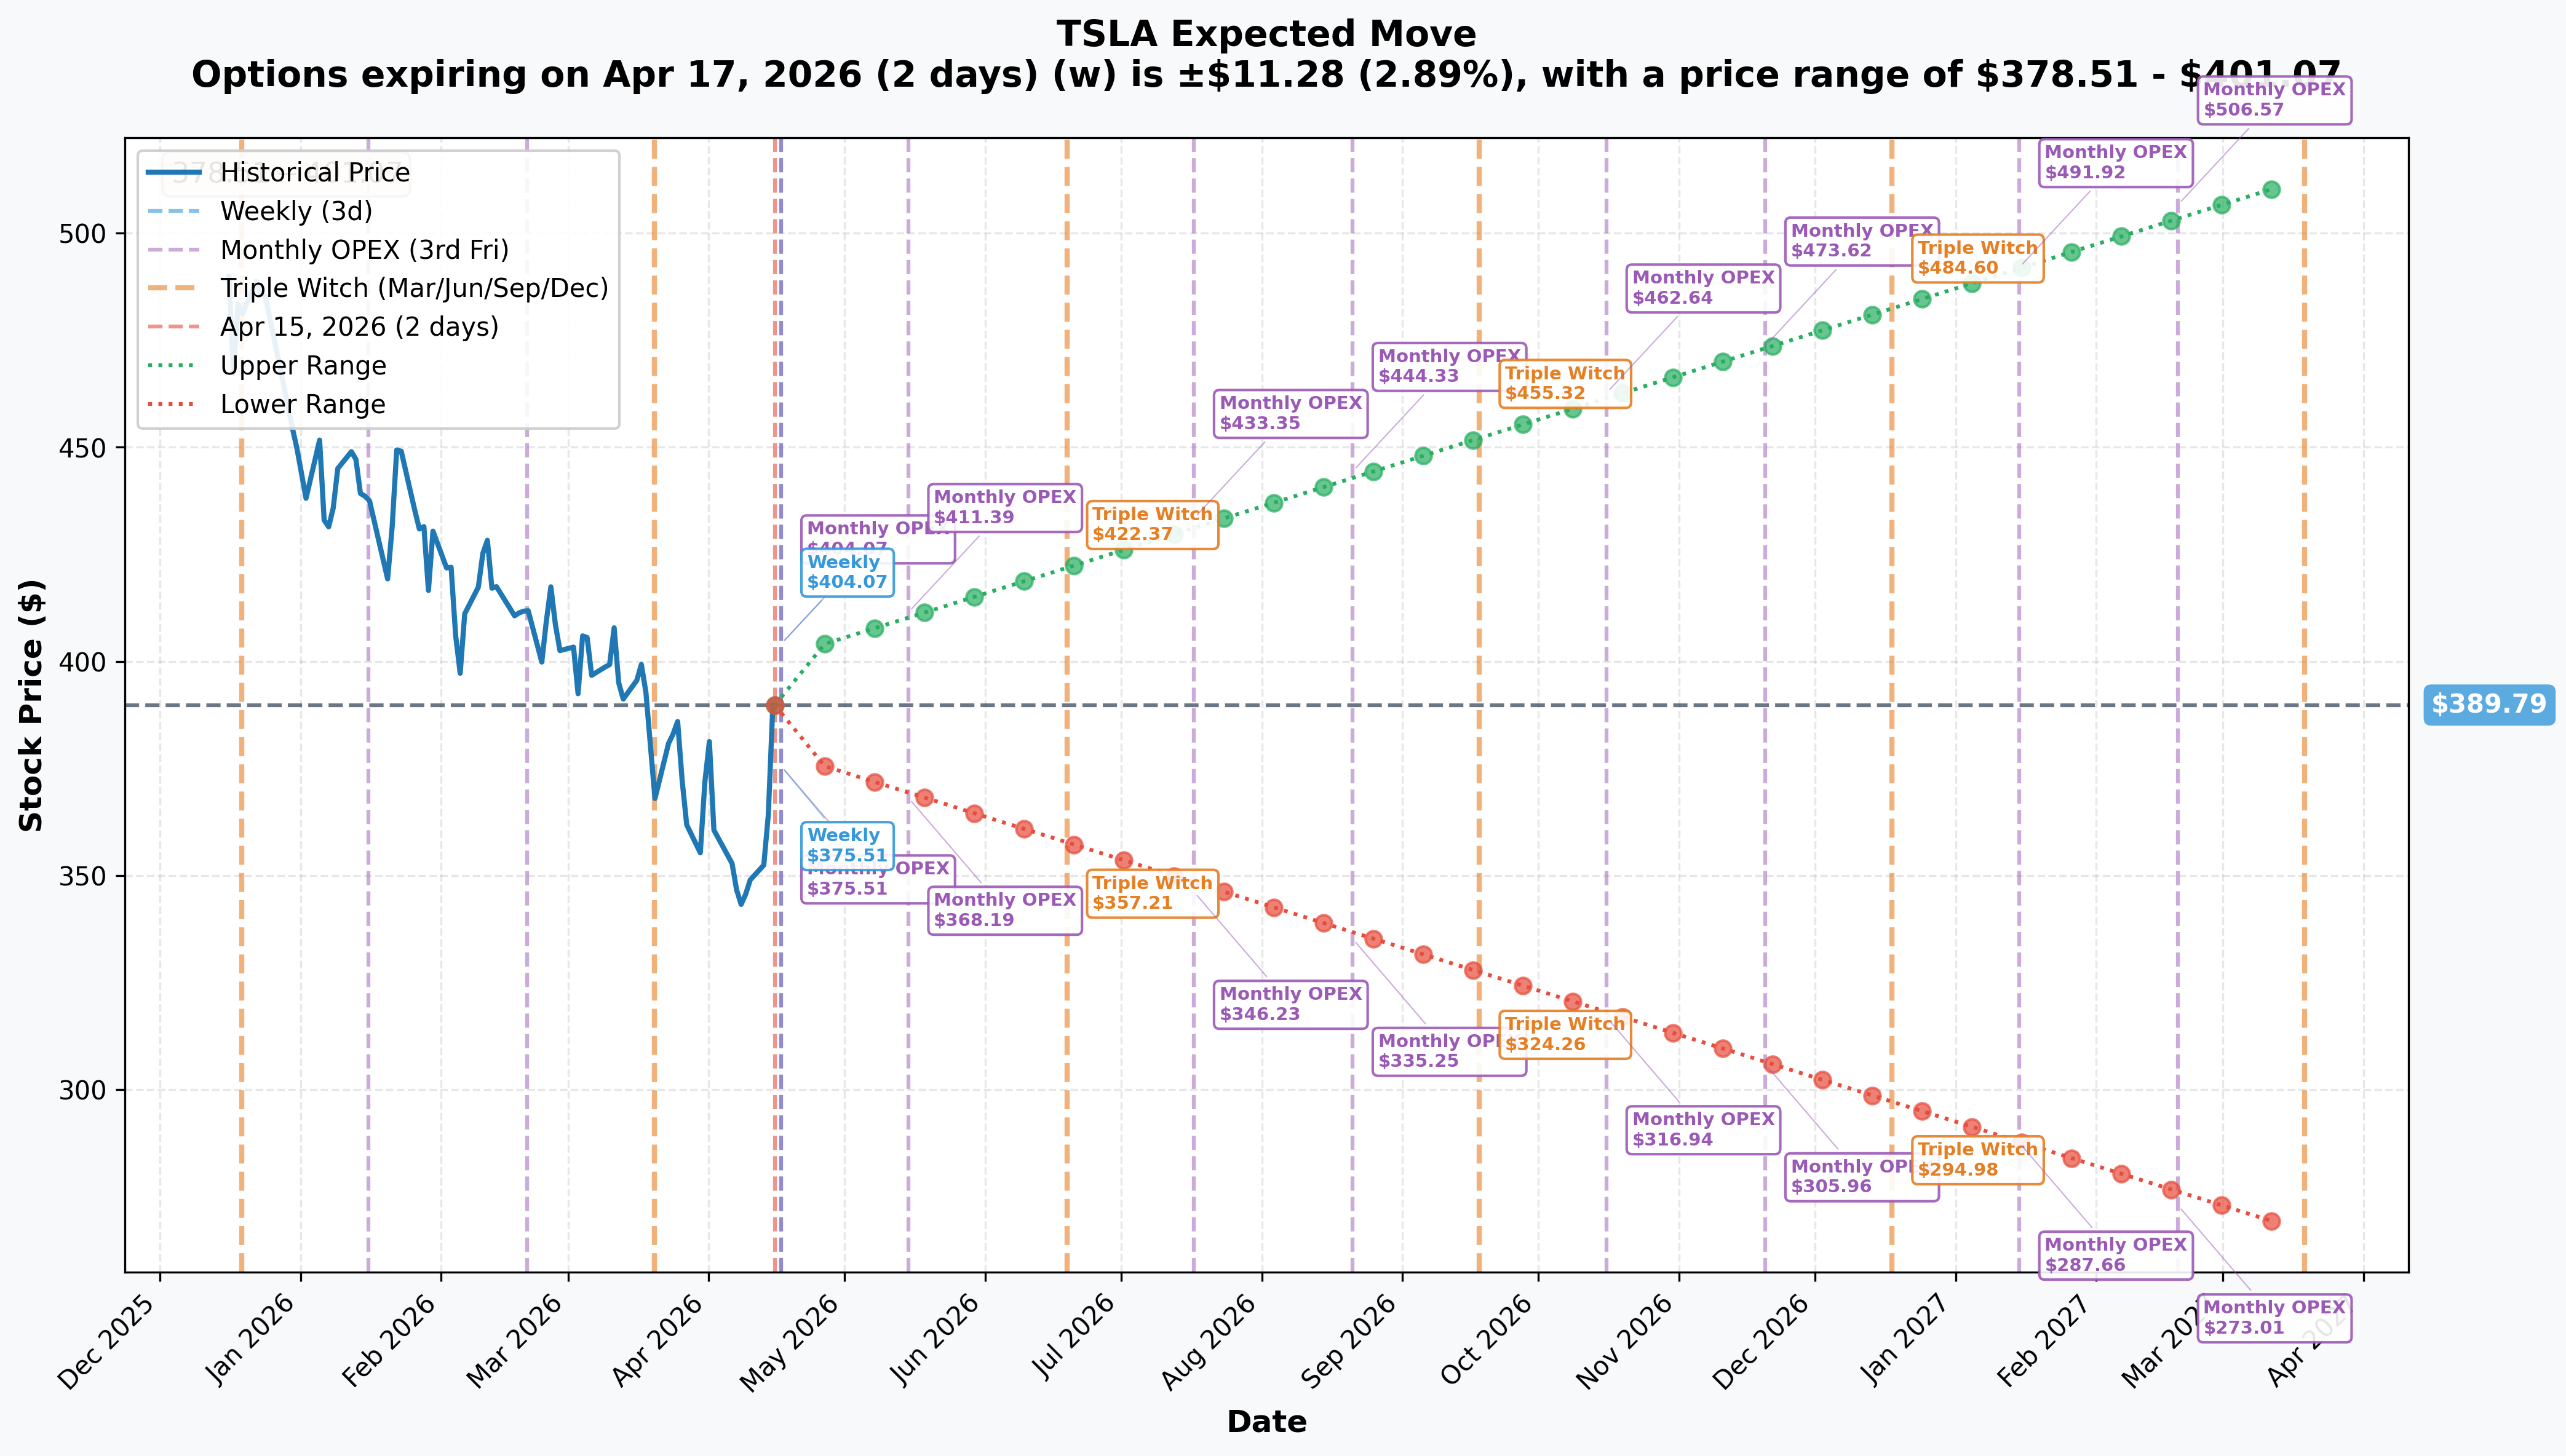
Options market pricing for multiple timeframes:
- 📅 Weekly / Monthly OPEX (Apr 17 — 2 days): ±$11.28 (±2.9%) → Range: $378.51 – $401.07
- 📅 May OPEX (May 15): Upper ~$411, Lower
$368 (±$21) - 📅 June Triple Witch (Jun 19): Upper ~$422, Lower
$357 (±$32) - 📅 Yearly LEAPS (Mar 2027 — 338 days): ±$123.10 (±31.6%) → Range: $266.69 – $512.89
Translation for regular folks: The market is pricing a tight 2.9% move for this week (just $11 on a $390 stock), but expects a 31.6% swing over the next year — that's $123 in either direction. Notice that even the bullish yearly implied move of $513 falls well short of the $650 target in today's spread. This trader is betting on TSLA's execution exceeding the market's current probability assessment by a wide margin. That's what makes this such a high-conviction play.
Key insight: The June 2027 expiry gives this trade 14+ months to capture Cybercab volume ramp, robotaxi city expansion, and multiple earnings cycles. The LEAP structure intentionally gives the thesis time to play out.
🎪 Catalysts
🔥 Immediate Catalyst (This Week!)
Q1 2026 Earnings: April 22, 2026 (4:30 PM CT / 5:30 PM ET) 📊
This is the most anticipated TSLA earnings in recent memory, with the bear-bull divide at an extreme:
- 📊 Consensus EPS: $0.24 (range: $0.09 to $0.44 — an enormous spread)
- 💰 Consensus Revenue: ~$21B
- 🐻 Bear data: Record 50,363-unit production-over-delivery gap in Q1, $7,500 EV tax credit expired, 164,000 unsold vehicles globally
- 🚀 Bull data: Record energy storage deployments (14.2 GWh), Cybercab production just started, Optimus ramping
- ⚠️ Tariff pressure: 25% duties on Mexican components adding ~$2,650/vehicle cost
- 🤖 Key asks: Cybercab production numbers, robotaxi city expansion timeline, Optimus unit economics
JPMorgan warning: Ryan Brinkman maintains $145 price target with 60% downside — the most bearish mainstream call on any large-cap stock right now.
🤖 Near-Term Catalysts (H1 2026)
Cybercab Volume Ramp — April-June 2026
- Formal production began at Gigafactory Texas in April 2026
- Target: 2-4 million units annually at $25,000-$30,000 — this is the product that could transform TSLA's economics
- Note: AI5 hardware delayed to mid-2027; launching on AI4 — a potential limiting factor on autonomous capability
Robotaxi City Expansion — H1 2026
- Plans for 7 additional cities beyond Austin in first half of 2026
- Current Austin fleet: ~42 cars, sub-20% availability, requires dry weather
- Safety record: 9x worse crash rate than human drivers — execution risk is very real
Energy Storage Acceleration
- Record 14.2 GWh deployed in Q4 2025
- Megablock facility in Houston targeting 50 GWh annual capacity
✅ Recent Past Catalysts
- Q1 2026 Deliveries (April 2): 358,023 vehicles — missed 365K consensus
- Model S/X Discontinuation: Tesla ending both models in U.S., focusing on Cybercab
- Robotaxi Without Safety Drivers: Launched in Austin in January 2026 without human monitors
🎲 Price Targets & Probabilities
Using gamma levels, implied move data, and catalyst timeline:
🐻 Bear Case — $350 Zone If Q1 earnings disappoint (EPS misses, weak guidance, inventory concerns dominate), TSLA could test the $350 gamma support level. JPMorgan's $145 PT remains the extreme bear case. Near term, $350 is the floor to watch. Probability (3-month): ~35%.
📊 Base Case — $380–$420 Range If earnings are roughly in line with estimates and Cybercab/robotaxi execution is credible, TSLA likely oscillates in the $380-$420 gamma band through Q2. The massive $400 gamma resistance is the ceiling for a bounce. Probability (3-month): ~45%.
🚀 Bull Case — $450–$513 Zone A strong earnings beat combined with meaningful Cybercab production data and robotaxi expansion could push TSLA toward the consensus PT of $416 and beyond toward the yearly implied move upper range of $513. Getting to $650 (today's trade target) requires everything going right over 14 months. Probability (for $650 by June 2027): ~8-12%.
💡 Trading Ideas
🛡️ Conservative — "Wait and Watch the Earnings Reaction"
Strategy: Don't trade ahead of April 22 earnings. Watch the reaction and buy shares near $380 gamma support if TSLA dips on any temporary selloff. Why this works: The $380 level has 39.1B in gamma exposure — dealers will actively defend it. Buying near support with a known downside limit is a disciplined entry. Stop below $360. Cost: $380/share for stock, defined stop at $360 = ~$20/share max risk.
⚖️ Balanced — "Ride the Post-Earnings Bounce"
Strategy: After earnings on April 22, if TSLA holds $380, buy the May 16 $390/$410 bull call spread (approximately $5-7 debit for $20 wide spread). Why this works: Captures the post-earnings stabilization with the gamma structure working in your favor ($400 is both a target and a natural spread ceiling). Risk is limited to your debit. Risk/Reward: Risk $5-7 to potentially make $13-15 if TSLA trades to $410 by May OPEX.
🚀 Aggressive — "Mirror the Whale Play (Scaled Down)"
Strategy: Buy the June 2027 $500/$510 bull call spread as a lower-cost proxy for the whale's $650/$660 trade. Why this works: Still captures a long-duration TSLA bull thesis but at a lower strike that requires less upside to profit. Implied move range extends to $513 by the yearly OPEX window, giving this spread reasonable probability. Costs significantly less net premium than the $650/$660 spread. Risk: Full debit lost if TSLA stays below $500 through June 2027 — this is still a high-conviction, low-probability play.
⚠️ Risk Factors
- ❗ Inventory Crisis: Record 164,000 unsold vehicles globally; 50,363-unit Q1 production-over-delivery gap
- ❗ EV Tax Credit Gone: $7,500 federal EV tax credit has expired, removing a major demand support in the most profitable market
- ❗ Tariff Headwinds: 25% duties on Mexican components, 125% China retaliatory tariffs compressing margins
- ❗ Robotaxi Execution: 42-car fleet, sub-20% availability, 9x worse crash rate vs. human drivers raises real questions about scalability
- ❗ Cybercab Hardware Delay: AI5 hardware pushed to mid-2027; Cybercab launching on AI4 may limit autonomous capability
- ❗ Brand Headwinds: Elon Musk's political activities weighing on demand — JPMorgan calls it "difficult to quantify but very real"
- ❗ $650 target is 73% OTM: The whale's spread only pays off if TSLA nearly doubles — that's the definition of a low-probability, high-reward bet
🎯 The Bottom Line
Here's the deal: Today's $29M TSLA LEAP bull call spread is the most YOLO-flavored institutional trade we've seen recently — someone paid ~$1M net to control $6M in upside if TSLA trades to $650-$660 by June 2027. That requires a 73% rally from current levels.
If you're bullish on TSLA:
- The LEAP spread structure is smart — max loss is the net debit, max gain is $10/share × 6,001 contracts = $6M
- Cybercab production starting + robotaxi expansion + Optimus ramping = real optionality over 14 months
- The $380-$400 gamma range provides near-term support for stock entries
If you're cautious on TSLA:
- April 22 earnings could be ugly — delivery miss, tariff headwinds, inventory crisis are all real
- JPMorgan's $145 target isn't consensus, but it's not crazy given the deteriorating fundamentals
- Getting to $650 requires Tesla to execute flawlessly on multiple fronts simultaneously — that's a high bar
Mark your calendar for April 22 (Q1 earnings at 4:30 PM CT) — whatever TSLA does on earnings will set the tone for the next few months and determine whether this LEAP bet has any realistic shot at paying off.
⚠️ Disclaimer: Options trading involves substantial risk and is not suitable for all investors. The analysis above is for educational and informational purposes only and does not constitute investment advice. Past performance does not guarantee future results. Always consult a financial professional before making investment decisions.