🚀 TSLA $41.3M Bullish Call Stack — Whale Buys May & July Calls After Q1 Print Volatility
Date: May 6, 2026 | Ticker: TSLA on NASDAQ | Spot at Trade: ~$393
The Quick Take
At 10:24:47 AM ET on May 6, 2026, a single institutional actor simultaneously executed two large-premium call purchases on Tesla — $41.3M combined — stacking both a slightly-OTM July 17 contract and a 4%-OTM May 15 contract within the same second. The simultaneity, scale, and two-leg construction are hallmarks of a deliberate strategic position, not an incremental retail accumulation. This whale paid up aggressively for upside on a stock trading ~$393, just two weeks after Q1 2026 earnings produced a mixed signal: EPS beat but revenue miss, with a capex guidance shock that sent free cash flow negative. The trade reads as a conviction bet that TSLA can rally through near-term AI/autonomy catalysts — Cybercab production ramp, Robotaxi 5-city expansion, and Optimus V3 reveal — before the May leg expires in nine trading days and the July leg expires in 72 days.
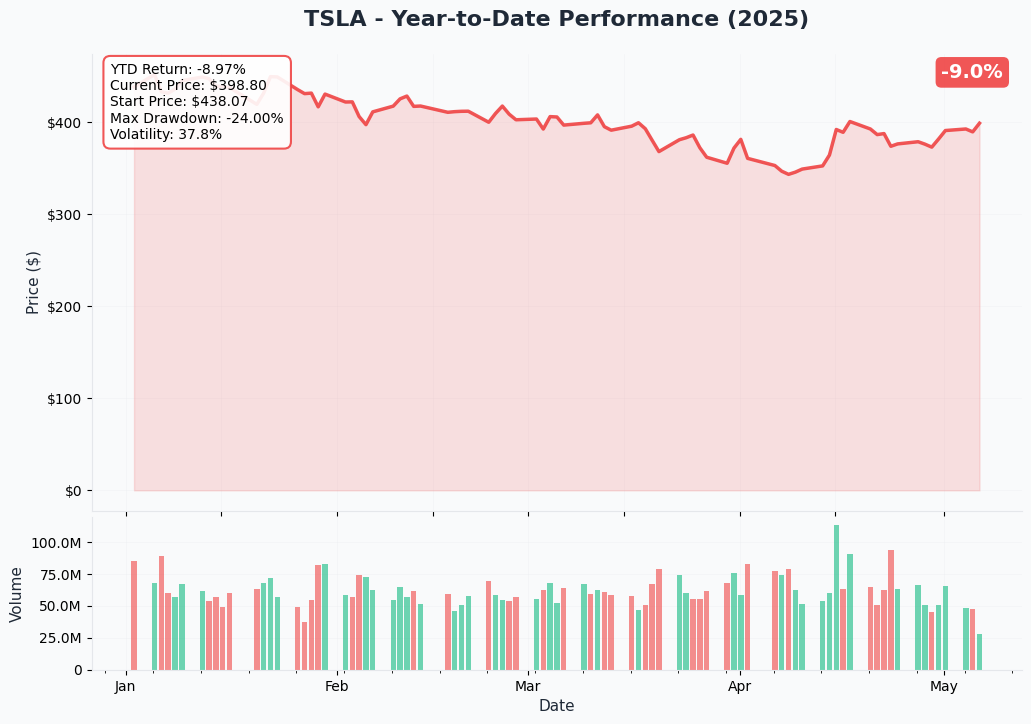
YTD Price Context
📈 Gamma-Based Support & Resistance
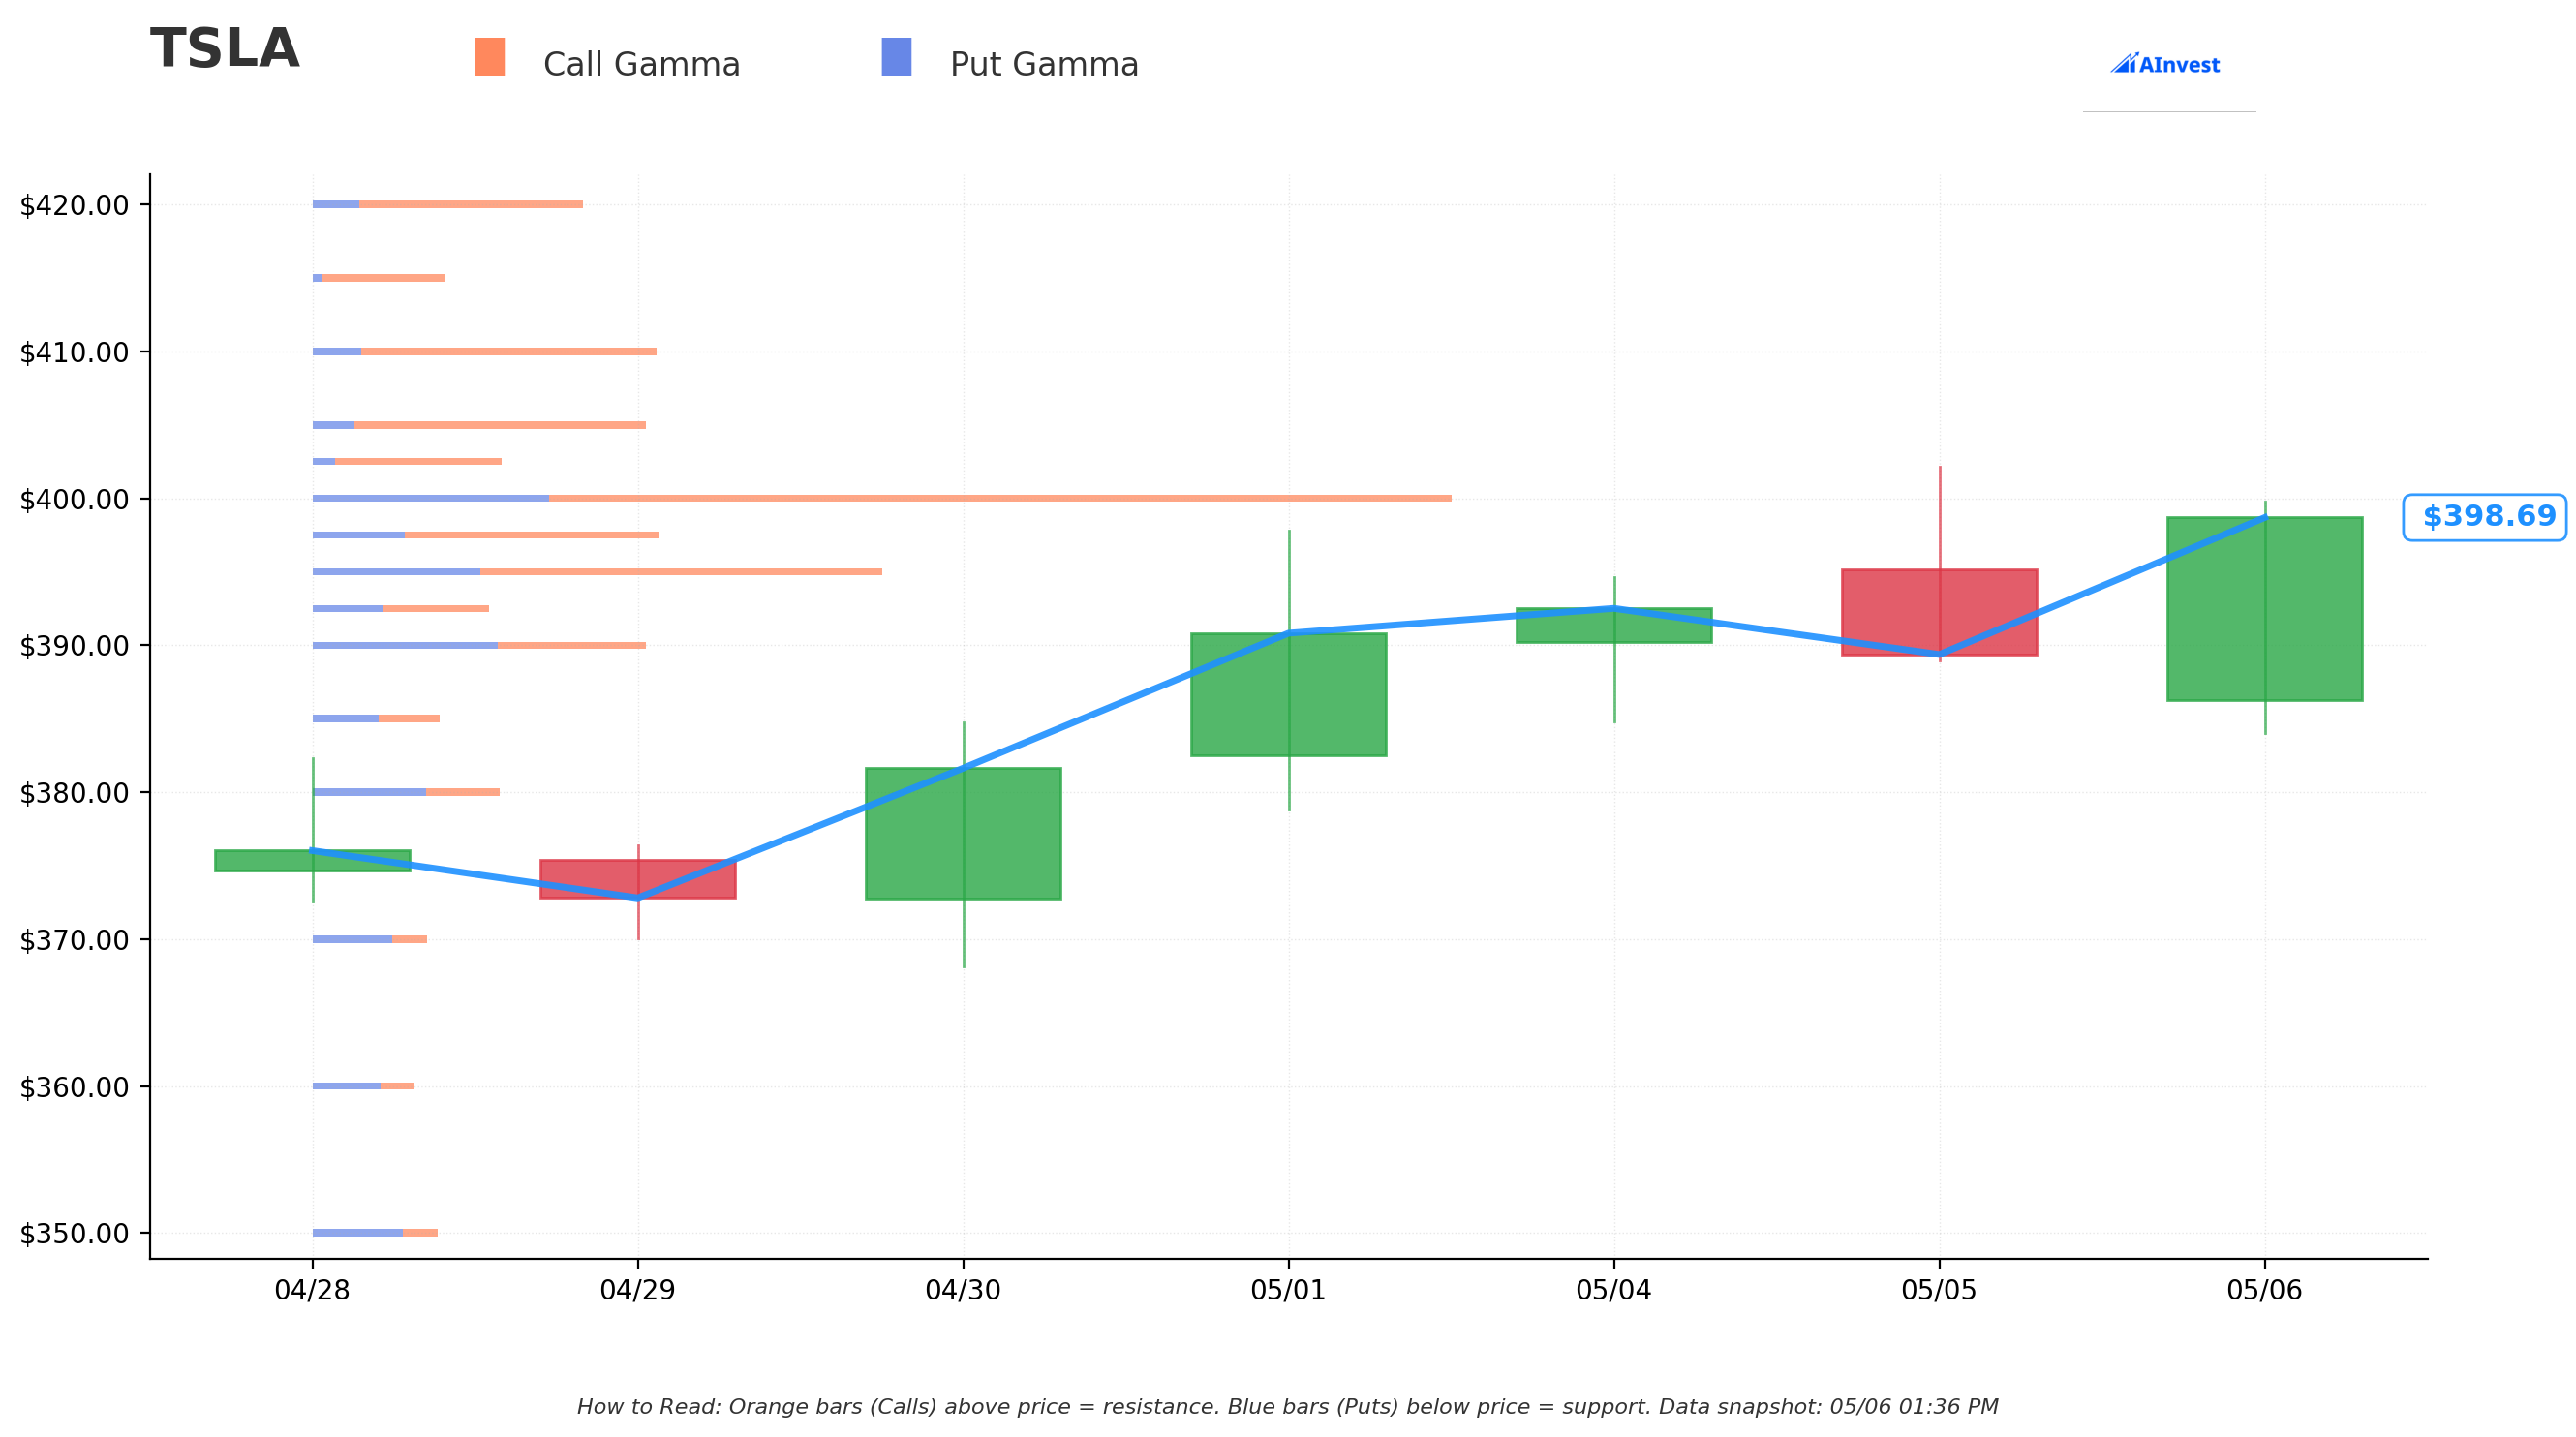
Current Price: $398.71
🔵 Support levels (GEX-based dealer zones):
- $397.50 — net GEX +21.89M, 0.30% below spot ($398.71)
- $395.00 — net GEX +31.22M, 0.93% below spot ($398.71)
- $392.50 — net GEX +5.83M, 1.56% below spot ($398.71)
- $390.00 — net GEX -4.48M, 2.18% below spot ($398.71)
- $380.00 — net GEX -5.31M, 4.69% below spot ($398.71)
🟠 Resistance levels (GEX-based dealer zones):
- $400.00 — net GEX +90.50M, 0.32% above spot ($398.71)
- $402.50 — net GEX +19.59M, 0.95% above spot ($398.71)
- $405.00 — net GEX +33.71M, 1.58% above spot ($398.71)
- $410.00 — net GEX +33.36M, 2.83% above spot ($398.71)
- $420.00 — net GEX +23.82M, 5.34% above spot ($398.71)
With spot at $398.71, the closest GEX wall above is $400.00 (0.32% away) and the closest gamma floor below is $397.50 (0.30% away). Dealers are positioned to dampen volatility around these levels in normal flow.
🎯 Implied Move Analysis
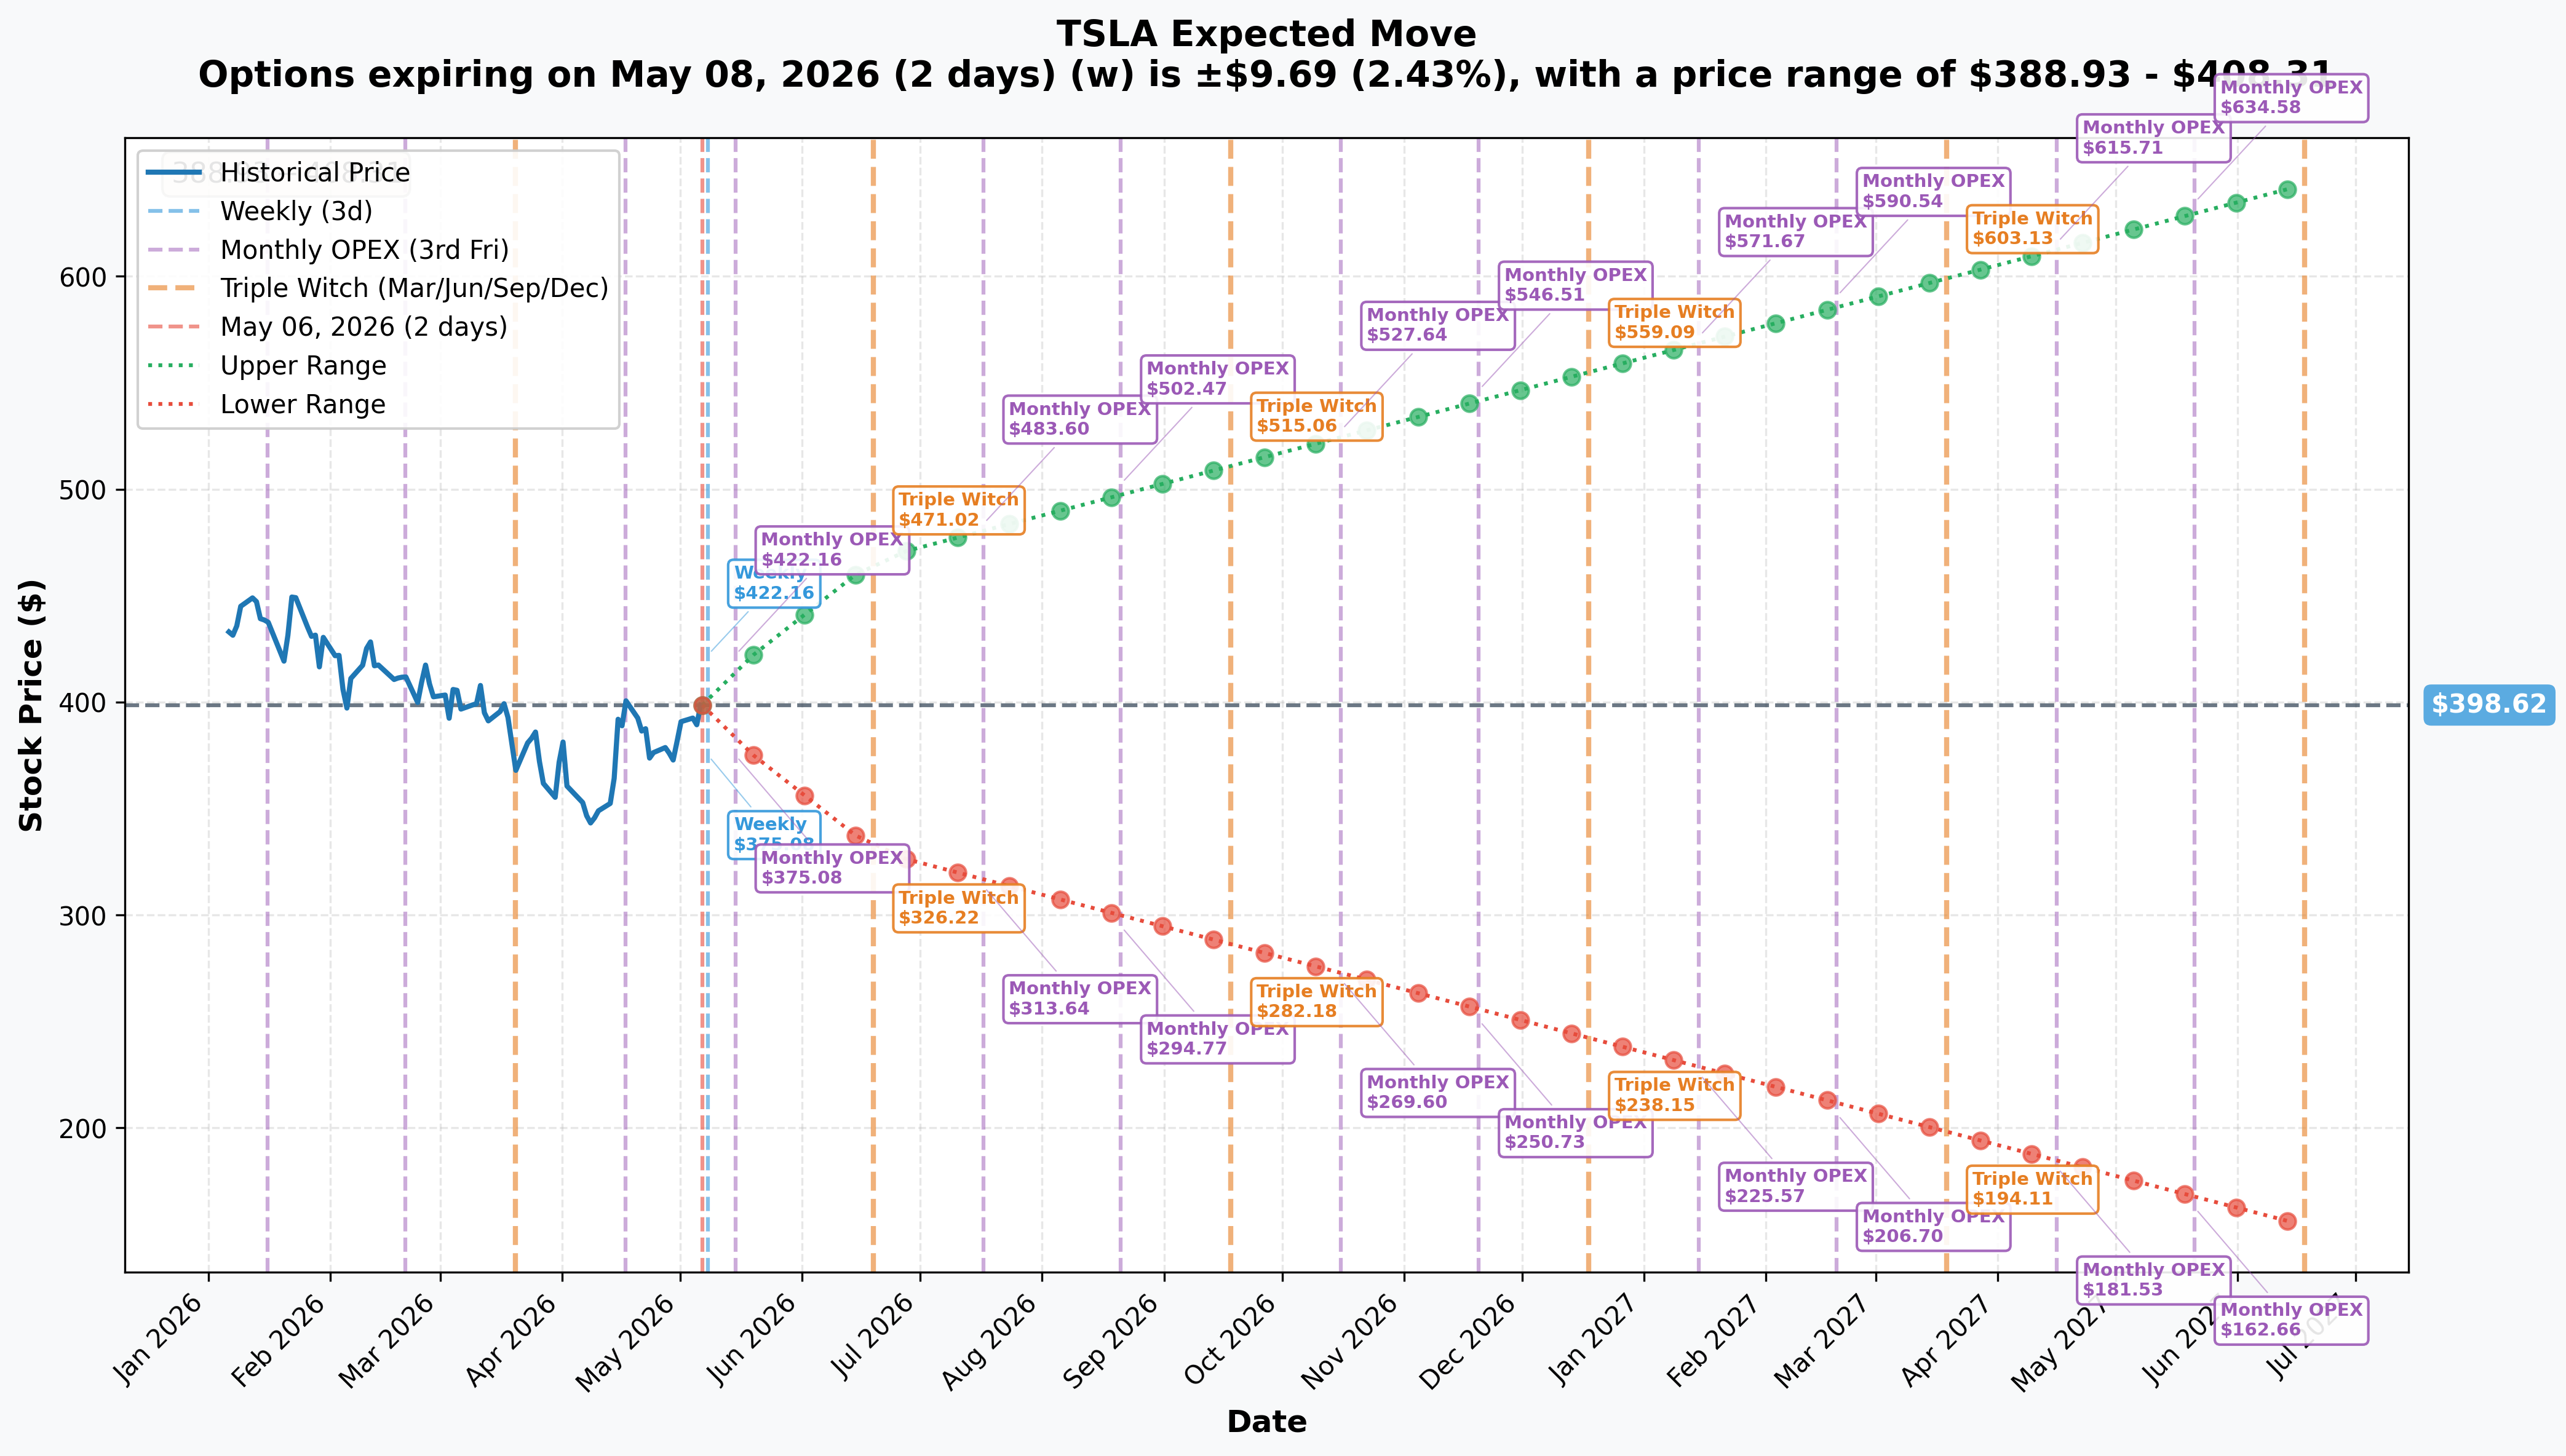
Options market pricing from ~$398.62:
| Expiry | Type | Days | Implied Move | Range |
|---|---|---|---|---|
| 2026-05-08 | Weekly | 2 | ±2.43% / ±$9.69 | $388.93 – $408.31 |
| 2026-05-15 | Monthly OPEX | 9 | ±4.45% / ±$17.74 | $380.88 – $416.36 |
| 2026-06-19 | Quarterly (Triple Witch) | 44 | ±17.19% / ±$68.53 | $330.09 – $467.15 |
| 2027-06-18 | Yearly LEAPS | 408 | ±61.38% / ±$244.67 | $153.95 – $643.29 |
These ranges represent one-standard-deviation moves implied by ATM straddle prices. Roughly 68% of historical outcomes fall inside the band — meaning ~1 in 3 expirations break out of the range. Use these as guideposts, not guarantees.
TSLA entered May 2026 down approximately 13.4% YTD, trading off its December 2025 high of ~$498. The stock has ranged between $271 and $499 over the past 52 weeks, with the Q1 2026 delivery miss on April 2 marking the steepest single-day drop of the year. The subsequent Q1 earnings print on April 22 (EPS beat, revenue miss, capex shock) left the stock treading water near $387–$395, roughly at consensus price target. The whale's entry at ~$393 puts spot essentially at the center of gravity between a structurally bearish China demand thesis and a structurally bullish AI/autonomy optionality thesis.
Tape: What the Whale Actually Did
Both legs were executed at exactly 10:24:47 AM — the same second — indicating a programmatic, planned two-legged entry, not two separate decisions.
| Time | Symbol | Order Type | Call/Put | Expiration | Strike | Volume | OI | Vol/OI | Premium Paid | Contract Price | Leg Link |
|---|---|---|---|---|---|---|---|---|---|---|---|
| 10:24:47 | TSLA | BTO | CALL | Jul 17, 2026 | $390 | 11,000 | ~3 | 3,667x | $36,000,000 | ~$33.13/contract | View Jul 390C |
| 10:24:47 | TSLA | BTO | CALL | May 15, 2026 | $410 | 13,000 | ~20,000 | 0.65x | $5,300,000 | ~$4.80/contract | View May 410C |
TOTAL PREMIUM PAID: $41,300,000
Both legs are confirmed BTO (Buy to Open) per the Order_Type column in the source data — the whale paid $41.3M to open new long call positions. This is not a closing trade, not a hedge, and not a spread sale. It is directional premium outlay with max loss equal to the full $41.3M if both legs expire worthless.
Position Architecture: Why Two Legs?
The two-legged construction is meaningful:
The July 390C ($36M leg) is the primary conviction position. At ~$33.13/contract, this is an expensive, relatively deep-premium call on a slightly OTM strike. With spot at $393, the $390 strike is nearly at-the-money — the whale is essentially buying a 72-day at-the-money call with rich optionality through every major upcoming catalyst: Q2 delivery report (early July), Optimus V3 reveal, Robotaxi 5-city expansion deadline, and FSD Europe launch. The 11,000 contracts on just ~3 open interest confirms this is an aggressive new opening — not an existing position being added to.
The May 410C ($5.3M leg) is the near-term speculative kicker. At $4.80/contract with 13,000 volume against 20,000 OI, this leg is smaller but still meaningful. The 0.65 vol/OI ratio suggests existing positioning in this contract, and the near-term May 15 expiration (9 calendar days out, fewer trading days) means this leg is a high-gamma bet on an imminent catalyst or price re-rating within the week. Possibilities include a China weekly insurance registration print, Robotaxi city launch announcement, or FSD Europe regulatory green light. If the stock doesn't move quickly, this leg decays to near zero by expiration.
The combined architecture suggests: primary thesis is bullish on a 2–3 month horizon (July leg), with a leveraged near-term gamma bet on something specific happening in the next 9 days (May leg).
Breakeven and Risk/Reward Analysis
Leg 1: July 17, 2026 — $390 Call (BTO)
- Premium paid: ~$33.13/contract
- Breakeven at expiration: $390.00 + $33.13 = $423.13
- Required move from spot ($393): +$30.13, or approximately +7.7%
- Days to expiration: ~72 calendar days
- Max profit: Theoretically unlimited as TSLA rises above $423.13
- Max loss: $33.13/contract x 11,000 contracts x 100 = $36,443,000 (full premium)
- Delta (estimated): ~0.50–0.55 at-the-money, so position has ~5,500–6,050 delta-equivalent shares at trade initiation
Leg 2: May 15, 2026 — $410 Call (BTO)
- Premium paid: ~$4.80/contract
- Breakeven at expiration: $410.00 + $4.80 = $414.80
- Required move from spot ($393): +$21.80, or approximately +5.5%
- Days to expiration: ~9 calendar days
- Max profit: Theoretically unlimited above $414.80
- Max loss: $4.80/contract x 13,000 contracts x 100 = $6,240,000 (full premium)
- Delta (estimated): ~0.20–0.25 OTM near-expiry, so position has ~2,600–3,250 delta-equivalent shares
Combined Position Summary
| Metric | July 390C | May 410C | Combined |
|---|---|---|---|
| Contracts | 11,000 | 13,000 | 24,000 |
| Total Premium | $36.0M | $5.3M | $41.3M |
| Breakeven | $423.13 | $414.80 | N/A (two legs) |
| % Rally Needed | ~7.7% | ~5.5% | — |
| Time Horizon | 72 days | 9 days | — |
| Max Loss | $36.0M | $5.3M | $41.3M |
A move to $425 by May 15 would put the May leg in-the-money by $10.20/contract ($13.3M profit on that leg alone) while the July leg would have appreciated materially. A flat or declining tape into May 15 expiration loses the entire $5.3M near-term kicker, leaving the July leg as the only live position.
Greeks Context
July 390C (72-day ATM)
- Delta: ~0.50–0.55 — position moves nearly 1:1 with TSLA near the strike
- Gamma: Moderate; will accelerate as stock moves through $390–$423 range
- Theta: At $33.13 with 72 days left, daily theta decay is approximately -$0.14 to -$0.18/contract, or ~$1,500–2,000/day in premium bleed for the full 11,000-contract position. Over 72 days, if the stock goes nowhere, the full $36M is at risk.
- Vega: High — a 1-point rise in implied volatility adds roughly $0.55–0.65/contract value. If TSLA IV compresses post-catalyst, the position suffers vega headwind even on a modest underlying rally.
May 410C (9-day OTM)
- Delta: ~0.20–0.25 — position moves more slowly per dollar of stock movement
- Gamma: High and accelerating — near-term OTM options have explosive gamma if the stock moves through the strike
- Theta: Brutal — with only 9 days left, daily theta could be -$0.25 to -$0.35/contract. The full 13,000-contract position bleeds roughly $325K–$455K per day in time value.
- Vega: Relatively low — short-dated options are less vega-sensitive than the July leg
Q1 2026 Earnings Context: Mixed Signal, Bullish Interpretation
The whale's entry on May 6 comes two weeks after Tesla's Q1 2026 earnings on April 22. Understanding what the earnings revealed — and what remains unresolved — is essential context for why a sophisticated buyer would commit $41.3M to upside calls at this price level.
What was good:
- Adjusted EPS of $0.41 beat consensus of $0.37 by 10.8%, up 51.9% YoY from $0.27, per CNBC
- Gross margin of 21.1%, up 478 basis points YoY from 16.3%, and above Q4 2025's 20.1%
- Cybercab production confirmed live at Giga Texas, with Musk citing sub-10-second target cycle times, per InsideEVs and Electrek
- Robotaxi unsupervised fleet expanded to Dallas and Houston on April 18, 2026, with Austin beginning evening unsupervised operations — first time the fleet has operated without safety oversight during peak hours, per Electric-Vehicles.com and Electrek
- FSD V14.3.2 unified the autonomy stack across Smart Summon, FSD, and Robotaxi — a material technical milestone per Tesla Oracle
What was bad:
- Revenue of $22.4B missed $22.64B consensus, per Electrek
- Capex guidance shocked to >$25B for 2026 — up 25% from prior $20B guide — sending free cash flow negative in Q1, per TIKR and HeyGoTrade
- Energy storage deployed 8.8 GWh, down 38% sequentially, well below 14.4 GWh consensus, per Carbon Credits
- Q1 deliveries of 358,023 missed consensus by ~7,600 units with 50,363 units of excess inventory built in the quarter, per Electrek and autoevolution
- Tesla maxed out its full $5.8B Chinese bank debt facility per the Q1 10-Q — a notable liquidity signal during a period of deteriorating China retail demand, per Electrek
The earnings print left TSLA in a "narrative battleground" state: auto fundamentals deteriorating while AI/autonomy milestones are approaching. The whale's $41.3M bet is a vote that the narrative — not the fundamentals — will drive price over the next 72 days.
Forward Catalyst Map: Why the July Expiration Is Well-Chosen
The July 17 expiration is not accidental. It captures the maximum density of near-term binary catalysts:
Within 9 days (May 15 leg window):
- China weekly insurance registrations (most watched near-term data point — April first week was -83% WoW)
- Potential Robotaxi city launch announcement (5 cities — Phoenix, Miami, Orlando, Tampa, Las Vegas — committed by end of H1 2026, per Electrek)
- FSD V14 Europe regulatory green light (software hints visible in 2026.8.6 update per Tesla Oracle)
- Final Model S/X line conversion at Fremont (early May 2026), clearing the path for Optimus production
Within 72 days (July 17 leg window):
- Q2 2026 Delivery Report (first 2 trading days of July) — street consensus 390K–420K units, Polymarket leans 450K–475K per Polymarket and Lines.com. A beat here, especially if it clears the 50K inventory overhang from Q1, could be the most powerful single-day catalyst
- Optimus V3 public reveal ("middle of this year" — likely June to August, per Electrek)
- Robotaxi expansion to 5 additional cities — end of H1 2026 is the committed deadline
- FSD V14 Lite rollout to Hardware 3 vehicles (Q2 2026 target per Autopilot Review)
- Tesla Semi volume production ramp (on schedule per Q1 commentary)
- Megapack 3 / Megablock production start announcement from new Houston Megafactory
The July 17 expiration is essentially a bet that at least one of these will be a market-moving positive event. The Q2 delivery report alone, dropping in the first two days of July, could be the decisive catalyst — and it falls 16 days before the July 17 expiration.
Bear Case: What Could Kill Both Legs
A balanced analysis requires acknowledging the substantial risks.
China demand spiral. April retail was -25.8% MoM (58,459 units from Gigafactory 3), and the first week of April saw only 3,580 insurance registrations — an -83% week-over-week collapse that pushed Tesla to #10 among Chinese NEV brands, per Global China EV and SCMP. If May/June weekly data confirms a structural decline rather than a temporary tariff-related blip, Q2 delivery estimates will need to be cut, directly threatening the July leg thesis.
Brand erosion and Musk political risk. Tesla brand value has collapsed from a $66.2B peak (January 2023) to $27.61B today — a 58% decline — per CNBC. A Yale study quantified >1 million in lost vehicle sales since 2022 from Musk's political activities per Battery Tech Online. Any additional damaging disclosure — Musk-Epstein email follow-ups (see Bloomberg), further political controversies, or European/Canadian regulatory action against Tesla — would be a direct headwind to the stock.
Capex and FCF trajectory. The raise to >$25B capex guidance for 2026 — a 25% increase over prior guidance — already pushed Q1 FCF negative. If Q2 shows a second consecutive negative FCF quarter, institutional holders on a fundamental basis could accelerate selling. The maxed-out $5.8B Chinese debt facility limits financial flexibility precisely when China retail is in freefall.
Catalyst slippage. Musk admitted in January 2026 that zero Optimus robots were doing useful work in Tesla factories — a significant walk-back from the January 2025 "10,000 units" claim per Tech Republic. Optimus V3 has already slipped one quarter. The Robotaxi 5-city H1 2026 commitment has only 2 months remaining and is likely to slip publicly. If the July 17 expiration arrives and the primary catalysts have all slipped or disappointed, the $36M leg is a total loss.
Valuation gravity. At ~358x trailing P/E with FCF now negative, TSLA's AI optionality is extremely price-dependent. Consensus PT is ~$399 against a spot of $393 — the market is already pricing a meaningful portion of the bull thesis. The breakeven on the July leg at $423.13 requires the stock to trade through consensus PT and reach levels last seen during the post-December 2025 sell-off. A compression in AI/autonomy multiples across the sector (any macro risk-off event) would hit TSLA disproportionately.
Share dilution headwind. Total shares outstanding grew 16.7% YoY largely from Musk's November 2025 pay-package mechanics per Simply Wall St — a persistent EPS headwind that partially offsets the beat narrative.
Volume and Open Interest Signal
The contrasting Vol/OI ratios between the two legs are telling:
July 390C: Vol/OI = 3,667x. Against just ~3 contracts of existing open interest, 11,000 contracts of new volume is essentially a clean, aggressive new opening. There is no prior institutional footprint in this contract to lean on. The trade classifier flags this as HIGH_ACTIVITY and STANDALONE — this is new money expressing a new view, not recycled positioning.
May 410C: Vol/OI = 0.65x. Against ~20,000 existing open interest, 13,000 volume is more moderate. This contract already has institutional attention. The trade adds to an existing cluster of positioning around the $410 near-term strike — suggesting this whale may be aligning with or reinforcing a known crowd of near-term call buyers.
The difference in construction suggests the July leg is the primary new thesis expression, while the May leg taps into existing near-term momentum or event positioning. If you were to characterize the architecture: "I have high conviction on a 2-3 month rally (July), and I want turbo exposure in case something happens in the next 9 days (May)."
Competitive and Market Position Context
Tesla's competitive picture adds texture to the bull/bear tension:
Tesla retook the global BEV sales crown from BYD in Q1 2026 — 358,023 BEV units vs BYD's 310,389 BEVs — per Yahoo Finance. But including PHEVs, BYD sold 688,993 NEVs in Q1, nearly 2x Tesla's volume. The headline "beat" obscures structural weakness in the one market — China — that matters most for Tesla's growth narrative.
On the autonomy side, Waymo remains the commercial volume leader in robotaxi miles deployed. Tesla's 25-vehicle unsupervised fleet is a fraction of Waymo's operation, and Musk acknowledged on the Q1 call that Robotaxi revenue will not be a meaningful P&L contributor in 2026. The bull case on Robotaxi is therefore entirely optionality-driven — the market is being asked to value a service that generates near-zero revenue today at a multi-hundred-billion-dollar future state.
FSD V14.3.2's unification of the autonomy stack across Smart Summon, FSD, and Robotaxi (per Tesla Oracle) is a genuine technical milestone — a single neural network running the full autonomy product suite is architecturally superior to the fragmented approach of prior versions. If FSD V14 launches in Europe (2026.8.6 hints per Tesla Oracle), the subscription revenue unlock is real: Europe is currently a $0 FSD revenue market.
Scenario Analysis: Where Does This Position Stand at Key Price Levels?
The following table maps out approximate P&L for each leg under various TSLA price outcomes at their respective expirations. All figures are per-contract; multiply by 100 (shares/contract) for dollar P&L per contract, then by number of contracts for full position.
May 15, 2026 — $410 Call Expiration Scenarios (13,000 contracts, $4.80 paid)
| TSLA at May 15 Expiry | Intrinsic Value | P&L per Contract | Full Leg P&L (13K contracts) | Commentary |
|---|---|---|---|---|
| $370 (-6%) | $0 | -$4.80 | -$6.24M | Full premium loss; China data or macro selloff |
| $390 (-1%) | $0 | -$4.80 | -$6.24M | Flat tape scenario — no catalyst fired |
| $393 (flat) | $0 | -$4.80 | -$6.24M | Break-even on stock, total loss on this leg |
| $410 (breakeven) | $0 | -$4.80 | -$6.24M | Just below breakeven; still a loss |
| $414.80 (+5.5%) | $4.80 | $0 | $0 | Exact breakeven — premium fully recovered |
| $425 (+8.1%) | $15.00 | +$10.20 | +$13.26M | Strong catalyst scenario; ~2x on this leg |
| $440 (+11.9%) | $30.00 | +$25.20 | +$32.76M | Gap-up catalyst scenario (Robotaxi city, FSD Europe) |
| $460 (+17%) | $50.00 | +$45.20 | +$58.76M | Home run; requires major catalyst surprise |
July 17, 2026 — $390 Call Expiration Scenarios (11,000 contracts, $33.13 paid)
| TSLA at July 17 Expiry | Intrinsic Value | P&L per Contract | Full Leg P&L (11K contracts) | Commentary |
|---|---|---|---|---|
| $350 (-11%) | $0 | -$33.13 | -$36.44M | Deep bear case; China spiral + catalyst slippage |
| $390 (-1%) | $0 | -$33.13 | -$36.44M | Flat/slight down; premium fully lost |
| $393 (flat) | $3.00 | -$30.13 | -$33.14M | Tiny intrinsic value but still a loss |
| $410 (+4%) | $20.00 | -$13.13 | -$14.44M | Partial recovery; catalysts mixed |
| $423.13 (+7.7%) | $33.13 | $0 | $0 | Exact breakeven |
| $440 (+12%) | $50.00 | +$16.87 | +$18.56M | Solid bull case; Q2 deliveries beat + Optimus news |
| $460 (+17%) | $70.00 | +$36.87 | +$40.56M | Strong bull case |
| $480 (+22%) | $90.00 | +$56.87 | +$62.56M | Max bull scenario approaching Dec 2025 highs |
| $498 (+27%) | $108 | +$74.87 | +$82.36M | Near 52-week high; AI re-rating required |
Combined position note: Even if the May 15 leg expires worthless (full -$5.3M loss on that leg), the July leg only needs to reach ~$428 at expiration to recover the combined $41.3M outlay and break even on the full position. That is a ~9% rally from the $393 entry — achievable but demanding.
Implied Volatility Context
Note: Gamma chart and implied move visualization are not available for this report date. The following is based on structural analysis of the trade economics.
The pricing of the July 390C at ~$33.13 against a spot of $393 implies the market is embedding a meaningful volatility premium in this contract. At-the-money 72-day calls on a stock with TSLA's historical volatility profile are typically priced at 8–10% of spot in a normal IV environment (approximately $31–$39 for a $393 stock). The $33.13 contract price is within this range, suggesting IV was in a relatively normal zone at time of trade — not crushed post-earnings (which would cheapen calls further) and not at an IV spike (which would have made calls much more expensive).
The whale paid roughly market-rate premium, not a distressed premium seller's price and not a panicked buyer's price. This suggests either: (a) the whale believes current IV is cheap relative to the upcoming catalyst density, or (b) the whale is indifferent to the IV level because the directional conviction is strong enough to justify the premium outright.
For the May 15 410C at $4.80 on a stock at $393 with 9 days to expiry and a $17 OTM strike, the pricing reflects a ~30–35% annualized IV equivalent. This is elevated for a near-expiry OTM option but consistent with TSLA's typical short-dated vol environment, especially ahead of potential catalysts. The whale is paying up for short-dated gamma and is aware of the theta burn.
Three Trading Ideas
These ideas are not buy/sell recommendations. Options trading involves substantial risk of loss, including total loss of premium paid. These are analytical frameworks for investors who are already following this situation closely. Consult a financial advisor before acting.
Idea 1: Follow the Primary Leg with a Defined-Risk Bull Call Spread
The thesis: Agree with the whale's July directional view but reduce the premium outlay and breakeven requirement by financing part of the long call with a short call at a higher strike.
Construction (illustrative):
- Buy TSLA Jul 17, 2026 $390 Call
- Sell TSLA Jul 17, 2026 $440 Call
Why $440 as the short strike: A $440 target represents a ~12% rally from $393, which would take TSLA back toward its February 2026 levels and above consensus PT of ~$399. Selling this strike caps the upside but dramatically reduces the net debit and lowers the breakeven.
Economics (illustrative, assuming short $440C credit ~$18–20):
- Net debit: ~$13–15 (vs $33.13 for the naked long)
- New breakeven: ~$403–$405, a ~2.5–3% move vs the whale's 7.7%
- Max profit: $440 – $390 – net debit = ~$35–37/spread at $440+
- Max loss: net debit paid (~$13–15/contract)
Tradeoff: If TSLA rips past $440 (possible on a strong Optimus/Robotaxi catalyst), the spread caps out while the naked long continues to profit. The spread is a better risk-adjusted entry for most investors; the naked long is the whales-only play.
Idea 2: May 15 Catalyst Play — Long the Straddle Around the $400 Strike
The thesis: Rather than betting directionally on the 9-day near-term catalyst window, capture volatility in either direction. The China weekly insurance print or a Robotaxi city announcement could move TSLA $15–20 in either direction; paying for optionality in both directions around at-the-money is viable if IV is not already pricing the move.
Construction (illustrative):
- Buy TSLA May 15, 2026 $395 Call (nearest ATM strike to $393)
- Buy TSLA May 15, 2026 $395 Put
Economics: The premium for both will reflect the current IV environment. The breakeven is spot +/- total premium paid. With 9 days to expiration, a straddle on a volatile name like TSLA is typically priced at ~5–8% of spot for the combined legs (rough rule of thumb). At $393, that is approximately a $20–31 move needed in either direction to break even at expiration.
Risk: If TSLA goes sideways for 9 days and neither catalyst fires, the straddle decays to near-zero. This is a pure volatility bet — it requires a catalyst, not a direction.
Contrast with the whale: The whale chose directional (only calls). The straddle player agrees that something is coming but is uncertain which way it resolves. The whale has higher conviction on direction.
Idea 3: Synthetic Covered Call Overlay for Existing TSLA Longs — Harvest Premium While Waiting for Breakeven
The thesis: For investors who already hold TSLA stock and are sitting on underwater positions from entries above current levels, the current options environment offers an opportunity to reduce cost basis by selling short-dated call premium.
Construction (illustrative, for a 100-share stock holder with a $420 cost basis):
- Sell TSLA May 15, 2026 $410 Call (same strike the whale is buying)
- This collects approximately ~$4.80/contract in premium (the same contract the whale purchased)
Economics:
- Premium collected: ~$480/contract
- If TSLA closes below $410 on May 15: keep the full $480, cost basis reduced to ~$415.20
- If TSLA closes above $410 on May 15: shares called away at $410, effective sale price $414.80 (above current spot, slightly below cost basis — still a loss, but smaller)
- Max loss: stock continues to decline and the $480 collected does not offset the underlying loss
Key insight: The whale's May 15 $410 BTO provides the liquidity for this covered call strategy. The whale is happy to pay $4.80 for the right to buy your shares at $410. If you are an existing TSLA holder who would be satisfied exiting at ~$415, selling this call is a rational premium-collection strategy.
Risk disclosures: Covered calls cap upside. If TSLA announces an Optimus V3 reveal or a 5-city Robotaxi launch in the next 9 days and the stock rips to $450, the covered call seller misses the rally above $414.80. This strategy is appropriate for investors with a neutral-to-mildly-bullish short-term view who prioritize income and cost-basis reduction over maximum upside capture.
Disclaimer
Options trading involves substantial risk of loss and is not appropriate for all investors. The strategies described above are analytical frameworks for educational purposes only and do not constitute buy, sell, or hold recommendations for any specific security. All premium figures, Greeks estimates, and breakeven calculations are illustrative based on trade tape data and publicly available information as of May 6, 2026. Actual pricing will vary based on current bid/ask spreads, implied volatility levels, and market conditions at time of execution. Past unusual options activity does not predict future price performance. Consult a qualified financial advisor before making any investment decisions. Maximum loss on any long options position is 100% of premium paid.
Option Labs | Data sourced from public options tape. May 6, 2026. All catalyst sources are inline-linked above. No data vendor names referenced in published content.