🚀 TSM: $11.2M Call Sweep Targets $360 - Whales Betting Big on AI Chip King Before Triple Witch!
📅 February 6, 2026 | 🔥 Unusual Activity Detected
🎯 The Quick Take
Someone just dropped $11.2 MILLION on TSM March $360 calls this morning, buying 10,000 contracts in two 5,000-lot sweeps at $11.10 each on the ASK side. That's a confident, aggressive BUY targeting 5.1% upside from the $342.56 spot price - and the March 20th Triple Witch expiration gives this trade 42 days to work. With TSMC posting 35.9% revenue growth in 2025, 2nm chips fully booked through 2026, and analyst targets as high as $450, this whale is betting the world's most important chipmaker has more room to run. Translation: institutional money is loading up on upside exposure heading into what could be a monster quarter!
📊 Company Overview
Taiwan Semiconductor Manufacturing Company (TSM) is the undisputed king of semiconductor foundry manufacturing - the company that actually BUILDS the chips powering the AI revolution:
- Market Cap: ~$1.72 Trillion (one of the most valuable companies on Earth)
- Industry: World's largest dedicated chip foundry (~70% market share)
- Current Price: $342.56 (at time of trade) / $347.51 (current)
- Core Customers: Apple, NVIDIA, AMD, Qualcomm, Broadcom - basically everyone who matters in chips
- Key Differentiator: 2nm mass production began Q4 2025, capacity fully booked through 2026
- 2025 Revenue: $122.42B (+35.9% YoY) - a record year driven by insatiable AI demand
- Analyst Consensus: 98% of 49 analysts rate BUY with consensus target ~$397
💰 The Option Flow Breakdown
The Tape (February 6, 2026 @ 09:38:13):
| Time | Symbol | Side | Buy/Sell | Type | Expiration | Premium | Strike | Volume | OI | Size | Spot | Option Price |
|---|---|---|---|---|---|---|---|---|---|---|---|---|
| 09:38:13 | TSM | ASK | BUY | CALL | 2026-03-20 | $5,600,000 | $360 | 5K | 4.2K | 5,000 | $342.56 | $11.10 |
| 09:38:13 | TSM | ASK | BUY | CALL | 2026-03-20 | $5,600,000 | $360 | 10K | 4.2K | 5,000 | $342.56 | $11.10 |
Option Symbol: TSM20260320C360 - March 20, 2026 $360 Call
Total Position: 10,000 contracts | Total Premium: $11,200,000
🤓 What This Actually Means
Let's break down why this is such a notable trade:
- 💸 $11.2M on a single strike: This is serious institutional conviction money - not hedging, not spreading, just straight-up buying upside exposure
- 🎯 OTM bet: The $360 strike is 5.1% above the $342.56 spot price at the time of entry. This is a pure directional bullish wager
- 📊 Volume crushes OI: Combined 10,000 contracts traded vs just 4,200 open interest = 2.4x the entire existing position was just opened in seconds
- 🔫 ASK side aggression: Buyer hit the ASK on BOTH legs - this isn't someone patiently waiting for a fill. They wanted IN immediately, paying up for speed
- ⏰ 42 days to expiration: March 20th is Triple Witch (quarterly options/futures expiration) - the most liquid expiration of the quarter with maximum gamma effects
- 💰 Breakeven at $371.10: TSM needs to reach $371.10 by March 20th for this trade to profit (8.3% upside from $342.56)
- 🐋 Notional exposure: 10,000 contracts = 1,000,000 shares = ~$342.5M of underlying TSM stock controlled for just $11.2M (30.6x leverage!)
Why two 5,000-lot clips? The buyer likely split the 10,000-contract order into two blocks to manage execution - even at TSM's deep liquidity, 10K contracts at once can move the market. Same timestamp, same price, same strategy = one institutional decision executed across two legs.
Option Strategy Detection: Both trades classified as Long Call (BTO - Buy to Open, STANDALONE) - straightforward directional bullish positioning, not part of a spread or hedged structure. This trader is making an unhedged bet that TSM goes UP.
Unusual Score: 🔥 EXTREME - Volume-to-OI ratio of 2.4x, $11.2M single-strike premium, ASK-side aggression on both legs, and the timing just 9 minutes into the session all point to informed institutional positioning. This is the kind of flow that happens when someone knows something - or at least BELIEVES something very strongly.
📈 Technical Setup / Chart Check-Up
YTD Performance Chart
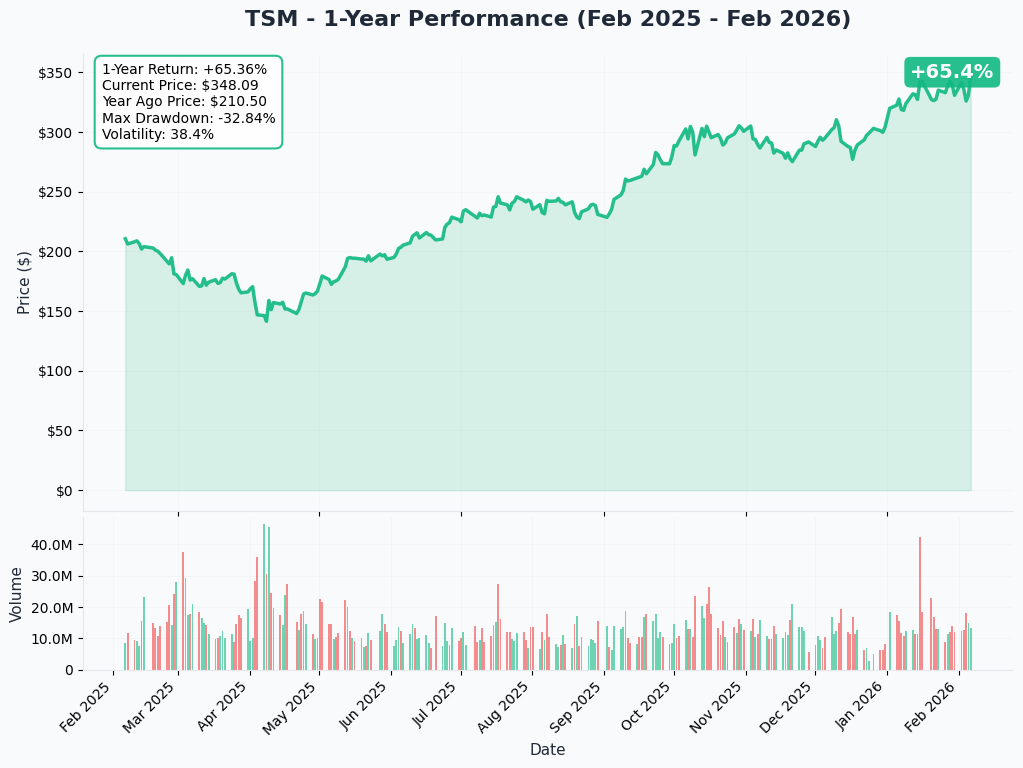
TSM has been on an impressive run fueled by the AI infrastructure buildout:
Key observations:
- 🚀 AI-driven rally: The stock has benefited from every major AI infrastructure announcement - NVIDIA's data center orders, hyperscaler capex expansion, and government chip incentives
- 📈 Current price action: Trading around $347.51 with momentum heading into Q1 earnings season
- 💪 Strong fundamentals backing the move: 35.9% revenue growth in 2025, with Q1 2026 guidance of $34.6-$35.8B (+38% YoY) - this isn't just hype, it's earnings growth
- 📊 Volume patterns: Institutional accumulation visible on high-volume up days throughout the AI buildout
Gamma-Based Support & Resistance Analysis
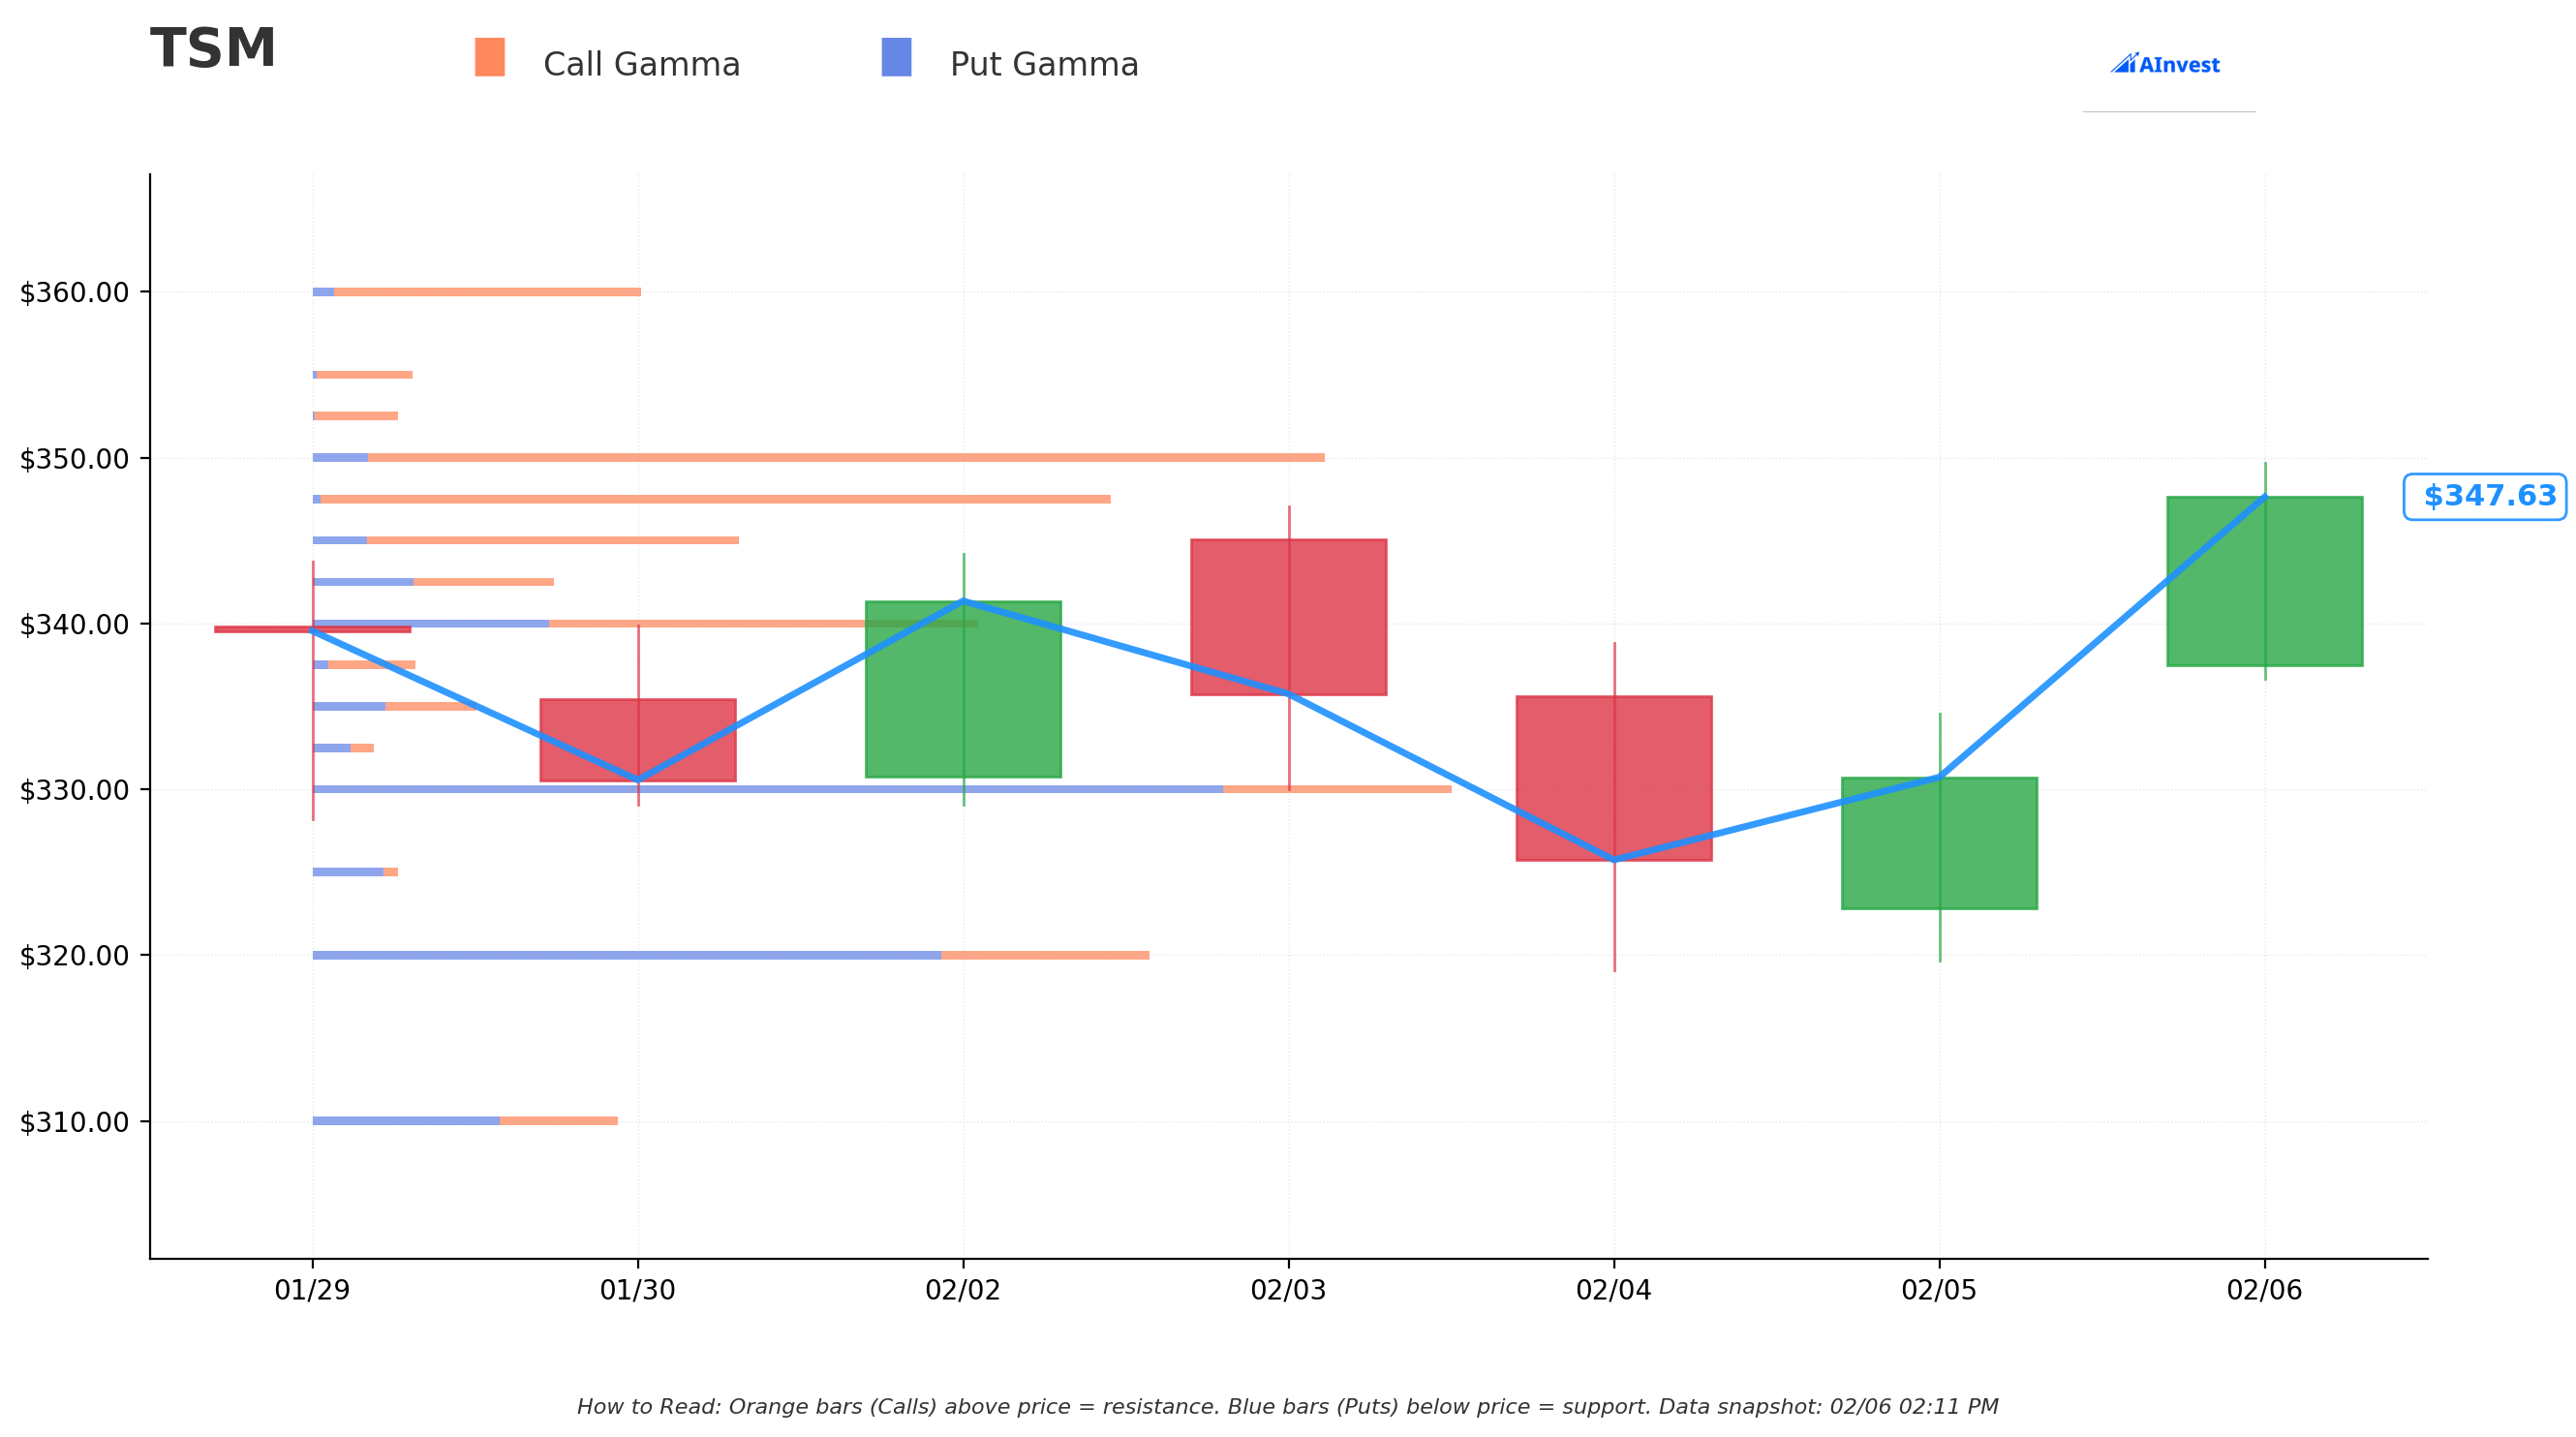
Current Price: $347.51
The gamma exposure map reveals critical dealer positioning levels that will govern near-term price action:
🔵 Support Levels (Where Dealers Buy the Dip):
- $347.50 - Immediate support with 16.5B gamma (dealers aggressively buying right at current price!)
- $345.00 - Near-term support with 9.2B gamma
- $342.50 - Support at 5.9B gamma (where the trade was executed!)
- $340.00 - Major support with 15.2B gamma (strong floor)
- $330.00 - STRONGEST SUPPORT with 25.9B gamma (massive put gamma wall - this is the backstop)
- $320.00 - Deep support at 18.8B gamma
- $310.00 - Secondary deep support at 6.9B gamma
- $300.00 - Structural floor at 13.8B gamma
🟠 Resistance Levels (Where Dealers Sell the Rally):
- $350.00 - STRONGEST RESISTANCE with 21.3B gamma (immediate ceiling, just 0.7% overhead!)
- $360.00 - Resistance at 7.3B gamma - THIS IS THE TRADE STRIKE!
What this means for traders:
TSM is trading right at the boundary between massive $347.50 support and the dominant $350 resistance wall. The gamma map tells a clear story: there's a HUGE ceiling at $350 that needs to be cleared first, and then relatively lighter resistance at $360 (7.3B vs 21.3B at $350). Once $350 breaks, the path to $360 gets considerably easier.
The whale's read: By targeting $360, this buyer is betting that the $350 gamma wall breaks - and once it does, momentum carries through to $360 and beyond with less overhead resistance. The 25.9B support at $330 and 15.2B at $340 provide a thick floor underneath, limiting downside.
Net GEX Bias: Bullish (120.6B call gamma vs 79.7B put gamma) - Overall positioning FAVORS upside, which supports the call buyer's thesis. When call gamma exceeds put gamma, dealer hedging dynamics create natural upward pressure on rallies.
Implied Move Analysis
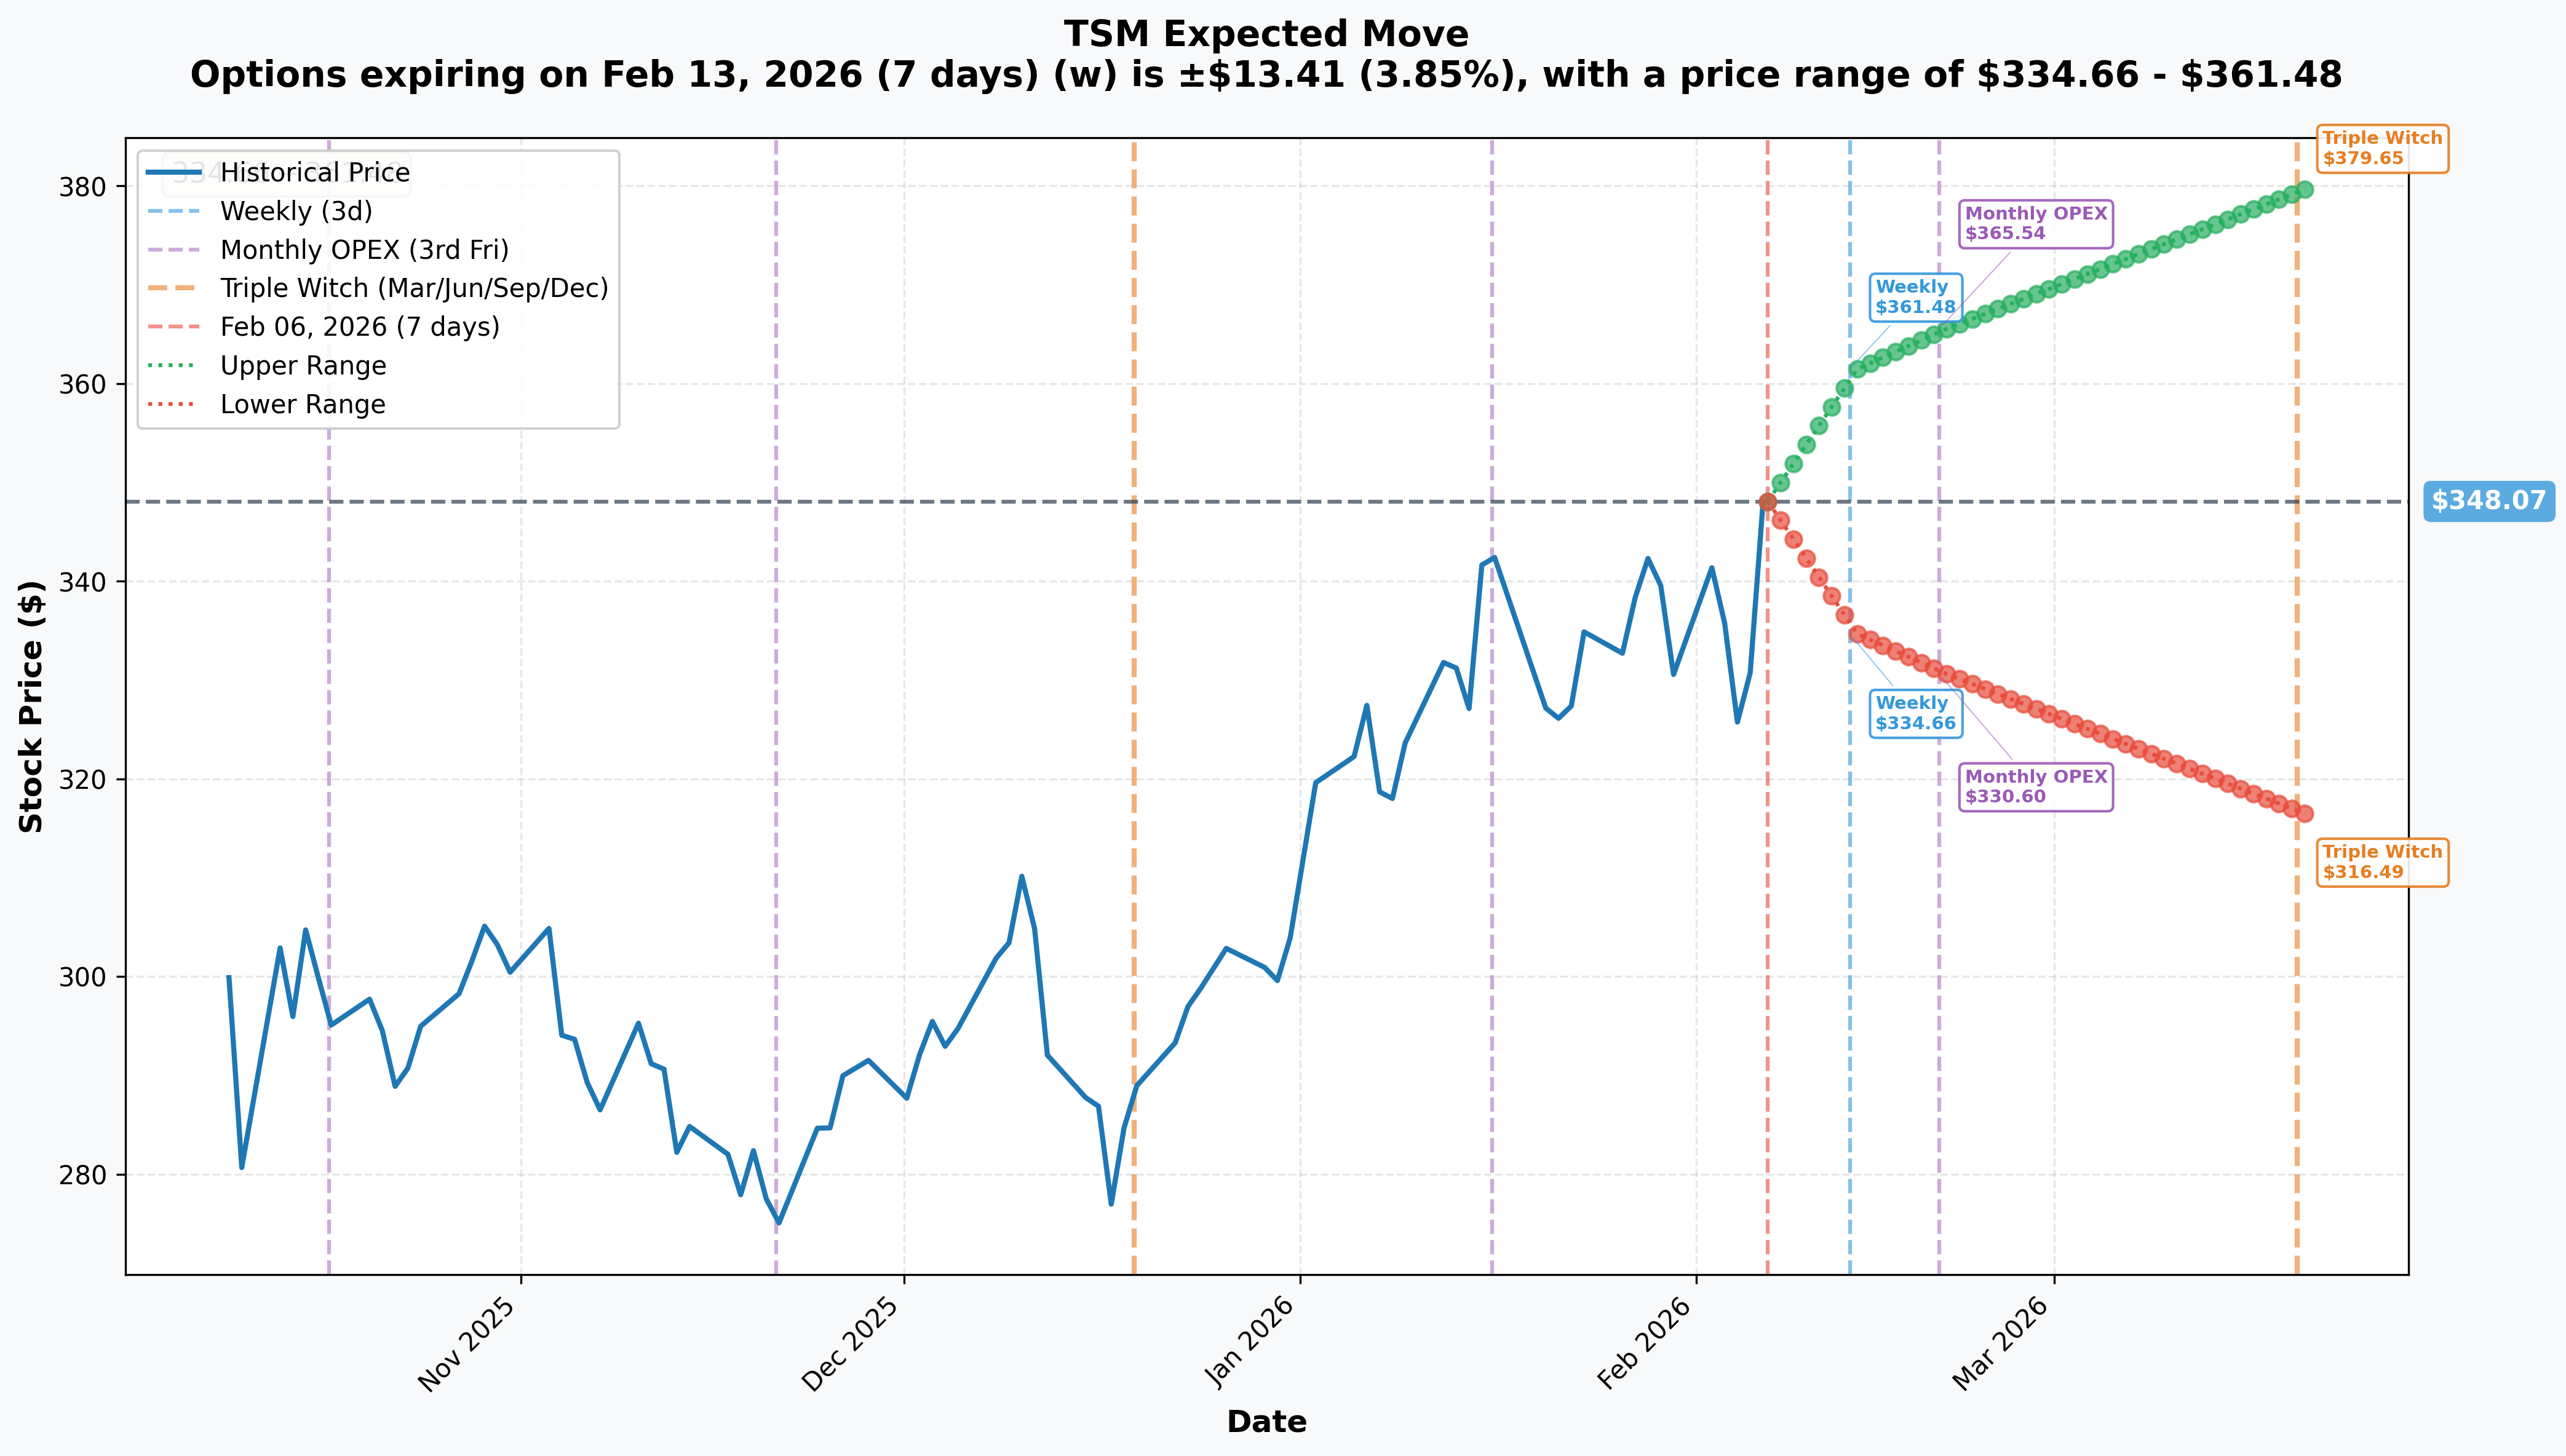
Options market pricing for upcoming expirations (from $348.07 current):
- 📅 Weekly (Feb 13 - 7 days): +/-$13.41 (+/-3.85%) --> Range: $334.66 - $361.48
- 📅 Monthly OPEX (Feb 20 - 14 days): +/-$17.47 (+/-5.02%) --> Range: $330.60 - $365.54
- 📅 Triple Witch (Mar 20 - 42 days - THIS TRADE!): +/-$31.58 (+/-9.07%) --> Range: $316.49 - $379.65
Translation for regular folks:
The options market is pricing in a 3.85% weekly move which puts the UPPER range at $361.48 - meaning even in the NEXT WEEK, the market says $360 is achievable! The monthly implied move extends to $365.54 and the March Triple Witch (when this trade expires) has an upper range of $379.65.
Here's the critical insight: The $360 strike is NOT some moonshot target:
- 🎯 It's within the WEEKLY implied move upper bound ($361.48)
- 🎯 It's well within the monthly upper range ($365.54)
- 🎯 The breakeven of $371.10 is comfortably within the March Triple Witch upper range ($379.65)
This means the options market itself says there's a very reasonable probability of TSM reaching $360+ before this trade expires. The whale isn't betting on a miracle - they're betting on a move the market already considers probable.
Key insight: The implied volatility of 9.07% through March expiration reflects the combination of normal semiconductor volatility plus potential catalysts (monthly revenue data, analyst activity, Q1 earnings expectations). With 42 days and an implied upper range of $379.65, the $360 target and even the $371.10 breakeven are squarely in play.
🎪 Catalysts
🔥 Why $360 Is In Play (The Bull Case In Numbers)
This whale isn't gambling blindly. Here's the catalyst stack that could push TSM through $360 in the next 42 days:
📊 Earnings Momentum & Guidance
- Q4 2025 was a BLOCKBUSTER: Revenue of NT$1,046.09B (+25.5% YoY) with EPS beating estimates by 11.4% - the 8th consecutive quarter of growth
- Full Year 2025 revenue hit $122.42B - up a massive 35.9% YoY - driven by AI chip demand that shows no signs of slowing
- Q1 2026 guidance is jaw-dropping: $34.6B-$35.8B revenue (+38% YoY) - ACCELERATING growth from already massive numbers
- Record 2026 CapEx of $52B-$56B signals management expects demand to keep surging - you don't spend record amounts if you see a slowdown
🇺🇸 US-Taiwan Trade Deal & Fab Expansion
- Tariff relief secured: US-Taiwan trade deal cut tariffs to 15% with $250B investment pledge - removes a major overhang
- $165B U.S. fab commitment: TSMC's massive investment in U.S. manufacturing capacity de-risks the geopolitical narrative
- Arizona Fab 2 equipment install: On track for Q3 2026 - steady progress on U.S. operations
🔬 Technology Leadership
- 2nm mass production: Began Q4 2025, capacity fully booked through 2026 - TSMC stays 1-2 years ahead of competition
- CoWoS packaging expanding: Ramping to 130K wafers/month by end of 2026 - this is the bottleneck for AI chip production, and TSMC is quadrupling capacity
- A16 (1.6nm) coming: Production ready late 2026 with Super Power Rail backside power delivery - another generation of leadership
📅 Near-Term Catalysts Before March 20th Expiry
- ~February 10: Monthly revenue report - January revenue data could be a positive catalyst if it shows Q1 tracking above guidance
- April 16: Q1 2026 earnings - while this is AFTER the March 20th expiration, the pre-earnings run-up effect typically starts 3-4 weeks before the date, which means buying pressure builds in late March right around expiry
🎯 Analyst Targets Point Higher
- Barclays: $450 target (29.5% upside from current)
- Needham: $410 target (18% upside)
- Consensus: ~$397 (14.2% upside)
- 98% of 49 analysts rate BUY - near-universal bullishness
💰 Valuation Still Reasonable
- Forward P/E ~27x with 30%+ revenue growth = PEG ratio of 0.9x - a PEG below 1.0 means the stock is arguably CHEAP relative to its growth rate. For context, NVIDIA trades at a PEG well above 1.0.
🎲 Price Targets & Probabilities
Using gamma levels, implied move data, and the catalyst calendar, here are the scenarios through March 20th expiration:
📈 Bull Case (35% probability)
Target: $370-$380 (Full Breakeven Achievement)
How we get there:
- 💪 January monthly revenue data (around Feb 10) shows Q1 tracking at or above the high end of $35.8B guidance
- 🚀 $350 gamma wall breaks on strong momentum, triggering dealer buying that accelerates the move to $360+
- 📊 CoWoS capacity expansion announcements or new customer wins drive re-rating
- 🎯 Pre-earnings positioning for April 16 Q1 report starts building in late February/early March
- 🌐 Positive semiconductor sector rotation as AI capex cycle continues
- 📈 Breakout through $360 gamma level opens path to $379.65 (implied move upper range)
Trade P&L at $375: ($375 - $360 - $11.10) x 10,000 = +$3.9M profit (34.8% return on $11.2M)
Trade P&L at $380: ($380 - $360 - $11.10) x 10,000 = +$8.9M profit (79.5% return)
🎯 Base Case (40% probability)
Target: $350-$370 (Partial Win or Small Loss)
Most likely scenario:
- ✅ TSM consolidates between $345-$365, working through the $350 gamma resistance gradually
- 📊 Monthly revenue data is solid but largely priced in
- ⚖️ Market digests strong fundamentals while broader macro uncertainty creates chop
- 🔄 Stock drifts toward $360 by mid-March as Q1 earnings anticipation builds
- 💤 Gamma resistance at $350 takes 2-3 weeks to clear, compressing time value
Trade P&L at $360: ($360 - $360 - $11.10) x 10,000 = -$11.1M loss (essentially the full premium if stock is exactly at strike)
Trade P&L at $365: ($365 - $360 - $11.10) x 10,000 = -$6.1M loss (still underwater but recovering)
Trade P&L at $371: ($371 - $360 - $11.10) x 10,000 = -$1M (near breakeven)
Why 40% probability: The base case reflects the reality that $350 resistance is formidable (21.3B gamma) and grinding through it takes time. The fundamental story is excellent but the market may need a fresh catalyst to push aggressively through.
📉 Bear Case (25% probability)
Target: $320-$345 (Full Premium Loss)
What could go wrong:
- 😰 Broader market selloff drags semiconductor stocks lower (macro fears, rate concerns)
- 🇨🇳 Cross-strait tensions escalate or China trade war fears resurface
- 🏭 Customer concentration risk: Apple or NVIDIA order cuts/delays leak
- 📉 Monthly revenue misses consensus, creating negative sentiment
- 🔄 Sector rotation out of semiconductors into defensive names
- 💸 Profit-taking after massive 2025 gains creates correction to $330 gamma support
Critical support levels if selling intensifies:
- 🛡️ $347.50: Immediate gamma support (16.5B) - first line of defense
- 🛡️ $340: Strong floor with 15.2B gamma
- 🛡️ $330: STRONGEST SUPPORT at 25.9B gamma - major institutional demand zone
- 🛡️ $320: Deep support at 18.8B gamma
Trade P&L: Full $11.2M premium loss (calls expire worthless below $360)
Probability assessment: 25% because TSMC's fundamental story remains exceptionally strong with accelerating revenue growth, technology leadership, and resolved trade concerns. A bear case requires external shocks rather than company-specific deterioration.
💡 Trading Ideas
🛡️ Conservative: "Own the AI Foundation"
Play: Buy TSM shares at $347-$348
Why this works:
- 📊 Own the world's most critical technology company directly - no expiration risk
- 💰 Forward P/E ~27x with 30%+ growth = PEG 0.9x (still reasonably valued!)
- 🛡️ Set stop-loss at $330 (5% risk, right at the 25.9B gamma support wall)
- 🎯 Target: $397 (consensus), $410 (Needham), $450 (Barclays)
- 📈 Collect any future dividend increases as company matures
- ⏰ No time decay - let the multi-year AI capex cycle play out
Risk level: Moderate | Skill level: Beginner-friendly
⚖️ Balanced: "Follow the Whale - Smaller Size"
Play: Buy TSM March $360 Calls (same trade, right-sized for retail)
Structure: Buy 1-5 contracts of TSM20260320C360 at ~$11-12
Why this works:
- 🐋 You're literally mirroring a trade someone paid $11.2M to make - they did the research
- 🎯 $360 is within the WEEKLY implied move upper range ($361.48) - achievable target
- ⏰ 42 days to expiration gives plenty of time for catalysts to play out (Feb revenue data, pre-earnings run)
- 💰 Risk $1,100-$1,200 per contract vs $34,750 to buy 100 shares
- 📊 Breakeven at $371.10 is within the March implied move upper range ($379.65)
Estimated P&L:
- TSM at $375 by March 20: ~$3.90 profit per contract (+35%)
- TSM at $380 by March 20: ~$8.90 profit per contract (+80%)
- TSM stays below $360: Full premium loss ($1,100-$1,200 per contract)
Risk level: High (leveraged, time-decaying) | Skill level: Intermediate
🚀 Aggressive: "Bull Call Spread for Better Risk/Reward"
Play: Buy $355/$375 call spread (March 20 expiration)
Structure: Buy $355 calls / Sell $375 calls on TSM
Why this could work:
- 💥 Reduces cost basis vs naked call purchase (spread costs ~$7-8 vs $11+ for straight calls)
- 🎯 Max profit of $12-13 per spread if TSM above $375 (150-185% ROI!)
- 📊 Lower breakeven (~$362-$363) vs the whale's $371.10
- 🛡️ Defined risk - can't lose more than the debit paid
- 📈 $375 upper strike is well within March implied move range ($379.65)
Estimated P&L:
- 💰 Cost: ~$7-8 per spread ($700-$800 per contract)
- 📈 Max profit: $12-13 per spread if TSM above $375 (150-185% ROI)
- 📉 Max loss: $7-8 per spread (full debit)
- 🎯 Breakeven: ~$362-$363
Risk level: HIGH | Skill level: Advanced
⚠️ Risk Factors
Don't ignore these - even with strong conviction, here's what could go wrong:
-
🌏 Geopolitical risk remains the #1 threat: Cross-strait tensions between China and Taiwan are the existential risk for TSMC. While the US-Taiwan trade deal and $165B U.S. fab investment diversify production, the majority of cutting-edge manufacturing still happens in Taiwan. Any escalation - military drills, diplomatic incidents, trade threats - could send TSM down 10-20% in hours.
-
📊 $350 gamma wall is a real barrier: The 21.3B gamma resistance at $350 is the STRONGEST overhead level. Market makers will systematically sell into any rally toward this level to manage their exposure. Breaking through requires sustained institutional buying pressure - one $11.2M trade may not be enough alone. If $350 holds for 2-3 weeks, time decay eats into the call premium rapidly.
-
💸 100% premium at risk on OTM calls: The $360 strike is 5.1% out of the money. If TSM doesn't rally above $360 by March 20th, every penny of the $11.2M (or your position) goes to zero. There's no intrinsic value cushion like there would be with ITM calls.
-
🇨🇳 Tariff/trade war uncertainty: While the US-Taiwan deal cut tariffs to 15%, the broader trade environment remains volatile. Any escalation in US-China tensions could ripple through semiconductor supply chains. TSMC derives significant indirect revenue from China-bound chip orders.
-
👥 Customer concentration risk: Apple and NVIDIA together represent a massive portion of TSMC revenue. Any negative development - iPhone demand weakness, NVIDIA order pushbacks, inventory correction at hyperscalers - directly impacts TSMC's top line and sentiment.
-
⏰ Time decay accelerates in final weeks: With 42 days to expiration, the $11.10 premium will lose approximately $0.25-$0.35 per day initially, accelerating to $0.40-$0.60 per day in the final two weeks. If TSM stalls near $350 for 3-4 weeks, the calls could lose 50%+ of their value even without a meaningful price decline.
-
📉 Semiconductor cycle risk: Despite current AI tailwinds, the semiconductor industry is cyclical. Any signs of demand peaking, inventory builds, or capex pullbacks at customers could trigger a sector-wide derating. TSMC's record $52-56B capex plan assumes demand stays robust - if it doesn't, overcapacity concerns emerge.
-
🔄 Broader market risk: This trade expires on Triple Witch (March 20), historically one of the most volatile sessions of the year. Quad-witching-style dynamics can create unpredictable price action regardless of fundamentals.
🎯 The Bottom Line
Here's the deal: Someone just paid $11.2 MILLION for 10,000 March $360 calls on TSM - hitting the ASK aggressively on both legs within the first 9 minutes of trading. This is the kind of confident, institutional, "I want in NOW" flow that typically signals informed positioning.
Why this trade makes sense:
- 🎯 The $360 target is within the WEEKLY implied move upper range ($361.48) - this is NOT a lottery ticket
- 📊 TSMC's fundamentals are arguably the best in semiconductors: 35.9% revenue growth, 2nm fully booked, PEG ratio under 1.0
- 🌐 Major overhangs resolved: US-Taiwan trade deal done, $165B U.S. fab commitment made, tariffs cut to 15%
- 🔬 Technology leadership widening: 2nm shipping, A16 (1.6nm) coming late 2026, CoWoS quadrupling
- 💰 Analyst consensus target of $397 implies 14% upside from here - and Barclays is at $450
- 📈 Net gamma bias is bullish (call GEX 120.6 > put GEX 79.7), and the $330 gamma wall at 25.9B provides a thick downside floor
The key challenge: The $350 gamma resistance wall (21.3B - the strongest level) sits just 0.7% overhead. TSM needs to punch through this level with conviction before $360 comes into play. Watch for a decisive close above $350 as the trigger.
If you like this trade:
- ✅ Size it appropriately - the whale can afford to lose $11.2M, you probably can't
- 📊 1-5 contracts of the March $360 calls gives you the same directional exposure at $1,100-$6,000 risk
- ⏰ Set a mental stop - if TSM drops below $340 support, consider cutting losses early rather than waiting for full time decay
If you're cautious:
- 🛡️ Buy shares instead at $347-$348 with a $330 stop (5% risk vs massive upside to $397-$450 targets)
- ⚖️ Use a bull call spread ($355/$375) for better risk/reward and lower breakeven
If you're bearish:
- ⚠️ Respect the institutional flow and the 98% analyst buy rating. Fighting this tape requires strong conviction AND a catalyst
- 📊 $350 gamma resistance provides a natural selling zone if you want to fade the rally
Mark your calendar - Key dates:
- 📅 ~Feb 10 - TSMC monthly revenue report (potential near-term catalyst!)
- 📅 Feb 13 - Weekly OPEX (+/-3.85% implied, upper range $361.48)
- 📅 Feb 20 - Monthly OPEX (+/-5.02% implied, upper range $365.54)
- 📅 Mar 20 - Triple Witch / THIS TRADE EXPIRES (+/-9.07% implied, upper range $379.65)
- 📅 Apr 16 - Q1 2026 Earnings (the bigger catalyst, but pre-earnings run starts ~3 weeks before)
Final verdict: This is a high-conviction directional bet on the world's most important semiconductor company, backed by accelerating revenue growth, unmatched technology leadership, and a resolved geopolitical overhang. The $360 target is aggressive but achievable - it's within the weekly implied move range and well below the consensus analyst target of $397. The whale is betting that the next 42 days bring more of what 2025 delivered: relentless AI demand driving TSMC higher. With a PEG ratio under 1.0 and 98% of analysts bullish, the fundamental case is hard to argue against.
The risk is real - $11.10 per contract goes to zero if TSM stays below $360 - but the risk/reward profile at these levels, with these fundamentals, and with this much institutional conviction behind it, makes this one of the more compelling bullish setups in the semiconductor space right now.
Trade smart, size right, and always know your max loss before you enter. 💪
Disclaimer: Options trading involves substantial risk of loss and is not suitable for all investors. This analysis is for educational purposes only and does not constitute financial advice. Past performance does not guarantee future results. The unusual options activity described reflects one trader's positioning and does not imply the trade will be profitable or that you should follow it. OTM calls carry the risk of 100% premium loss if the stock does not exceed the strike price by expiration. Always do your own research, understand the risks, and consider consulting a licensed financial advisor before trading. Triple Witch expiration creates elevated volatility and unpredictable price action.
About Taiwan Semiconductor Manufacturing Company: TSMC is the world's largest dedicated semiconductor foundry, manufacturing chips for the world's leading technology companies including Apple, NVIDIA, AMD, and Qualcomm. With approximately 70% global foundry market share, 2nm mass production underway, and a record $52-56B capital expenditure plan for 2026, TSMC sits at the center of the global AI infrastructure buildout. Market cap: ~$1.72 trillion in the Semiconductors industry.