🐋 TSM: Institutional Trader Rolls $28M Put Position -- Closing March $370, Opening May $340!
📅 March 9, 2026 | 🔥 Unusual Activity Detected
🎯 The Quick Take
An institutional trader just executed a textbook put roll on TSM, moving $28 million in premium across two trades. First, they closed a short $370 put expiring March 20 (pocketing profits on the decline from $370 to $340), then immediately opened a new short $340 put expiring May 15 -- rolling down $30 in strike and out 56 days. With a combined z-score of 46.32 on the new leg (trades this large are exceptionally rare), this is a sophisticated institutional play that says: "I still want to own TSM at lower levels, but I'm acknowledging the pullback and adjusting my exposure accordingly."
🏢 Company Snapshot
Taiwan Semiconductor Manufacturing Company (NYSE: TSM) -- The world's largest dedicated chip foundry and the most important company most people have never heard of. With a $1.76 trillion market cap and roughly 75% of leading-edge foundry revenue, TSMC manufactures the most advanced chips on the planet for Apple, NVIDIA, AMD, Qualcomm, and Broadcom. The company controls over 90% of the world's most advanced chip production at leading-edge nodes (3nm, 5nm). In 2025, TSMC posted full-year revenue of $122 billion (+35.9% YoY) and is now ramping its revolutionary 2nm process with capacity fully booked through year-end 2026.
The stock currently trades at ~$340, down approximately 13% from its all-time high of $390.21 set just two weeks ago on February 25. The pullback reflects broader tech volatility and tariff concerns, not any fundamental deterioration -- Q1 2026 revenue guidance of $34.6-$35.8 billion (+38% YoY) is the strongest the company has ever issued.
💰 The Option Flow Breakdown
📊 The Tape
| Field | Trade 1 (Close Short Put) | Trade 2 (Open Short Put) |
|---|---|---|
| 🕐 Time | March 9, 9:55:36 AM ET | March 9, 11:34:03 AM ET |
| 📌 Ticker | TSM | TSM |
| 📞 Type | PUT $370 (Sell to Close) | PUT $340 (Sell to Open) |
| 🎯 Strike | $370 (8.7% above spot) | $340 (at the money) |
| 📅 Expiration | 2026-03-20 (11 days out) | 2026-05-15 (67 days out) |
| 📦 Size | 5,100 contracts | 11,000 contracts |
| 💵 Premium | $16M (received) | $12M (received) |
| 🏷️ Order Type | STC -- Sell to Close | STO -- Sell to Open |
| 🔢 Z-Score | 5.05 (Very Unusual) | 46.32 (Extremely Unusual) |
| 🧩 Strategy | Closing existing short put | Opening new short put |
Option Symbols:
- TSM20260320P370 -- March 20, 2026 $370 Put (CLOSED)
- TSM20260515P340 -- May 15, 2026 $340 Put (OPENED)
🤓 What This Actually Means
Let me walk through this step by step, because this is one of the most textbook institutional put rolls you will ever see on the tape.
Step 1: Closing the March $370 Put (9:55 AM)
This trader originally sold (shorted) the March 20 $370 puts at some point in the past -- likely when TSM was trading near or above $370. They collected premium upfront, betting the stock would stay above $370 through March expiration. But TSM dropped from $390 to $340, which means those $370 puts are now deep in-the-money (about $30 of intrinsic value). Rather than wait for assignment and be forced to buy 510,000 shares at $370 (a $189M commitment at an above-market price), the trader bought the puts back for $16M to close the position.
✅ Why close now? With only 11 days until expiration and the stock $30 below the strike, assignment risk is extremely high. Closing at $16M likely still represents a manageable loss or even a partial profit depending on the original premium collected.
Step 2: Opening the May $340 Put (11:34 AM)
Ninety minutes later, the same institution opens a new short put position -- 11,000 contracts at the $340 strike, expiring May 15. This is a Sell to Open (STO), meaning they are initiating a fresh position. They collect $12M in premium and are now obligated to buy 1.1 million shares of TSM at $340 if assigned.
✅ The z-score of 46.32 -- This is not a typo. A z-score this high means the trade is over 46 standard deviations above average volume. You might see a trade this outsized a handful of times per year across all tickers. This is big institutional money, full stop.
The Big Picture: A Classic Put Roll
When you combine these two trades, the picture becomes crystal clear:
📌 Closing the March $370 put (near-term, high-strike, deep ITM)
📌 Opening the May $340 put (further-term, lower strike, at the money)
This is a roll down and out -- the trader is:
-
Acknowledging the correction -- TSM dropped from $370+ to $340. Rather than fight reality, they are adjusting their positioning to reflect the new price level.
-
Staying bullish long-term -- By selling the $340 put for May, they are saying: "I am willing to own TSM at $340 or below. I believe the stock holds this level over the next 67 days." If TSM stays above $340 through May 15, they keep the $12M premium as pure profit.
-
Extending the timeline -- Moving from March 20 to May 15 gives them an extra 56 days. This conveniently bridges past the April 16 Q1 earnings report -- they want exposure through this catalyst.
-
Doubling down on size -- Going from 5,100 contracts to 11,000 contracts means they are increasing their conviction at the lower strike. More contracts, more premium collected, more shares they are willing to buy.
Translation for us regular folks: A major institution just said, "TSM at $340 is a price I am willing to own at, and I am so confident the stock holds this level that I will collect $12M in premium for the privilege of buying it here if it dips further." That is a structurally bullish signal wrapped in a risk-management adjustment.
📈 Technical Setup / Chart Check-Up
YTD Chart
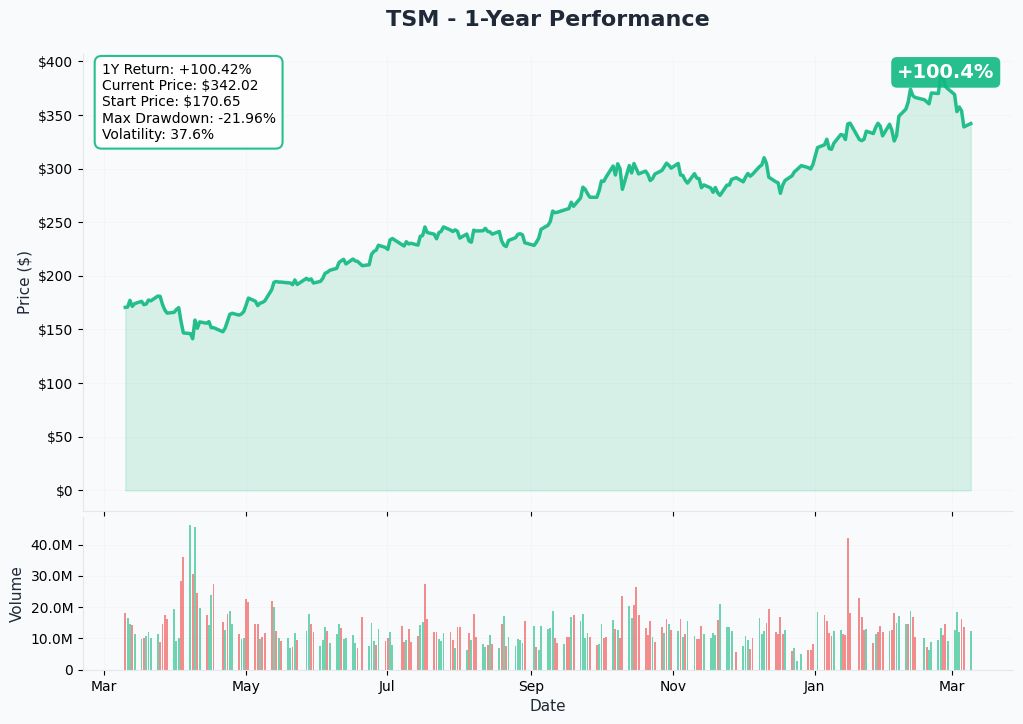
TSM has had a wild ride in 2026. The stock ripped from roughly $355 at the start of the year to an all-time high of $390.21 on February 25, only to give back essentially all of those gains and then some, pulling back 13% to $340 over just two weeks.
Key technical levels from the chart:
📈 All-time high: $390.21 -- Set February 25, 2026. This is now a major resistance level that the stock will need to reclaim for the long-term uptrend to resume.
📉 50-day moving average: ~$375.50 -- The stock is trading well below this level, confirming short-term bearish momentum. A reclaim of the 50-day MA would be a significant bullish signal.
📊 200-day moving average: ~$353.32 -- TSM just sliced through this level on the recent selloff. The 200-day MA has now flipped from support to resistance. This is a critical battleground level.
📉 Current price: ~$340 -- Sitting right at the round number and coinciding with massive gamma support (more on this below). This is the level where the institutional trader chose to plant their flag.
📈 52-week low: $134.25 -- Set April 7, 2025, during the tariff shock. TSM has rallied over 150% from those lows. The longer-term trend remains firmly positive.
🔵🟠 Gamma-Based Support & Resistance
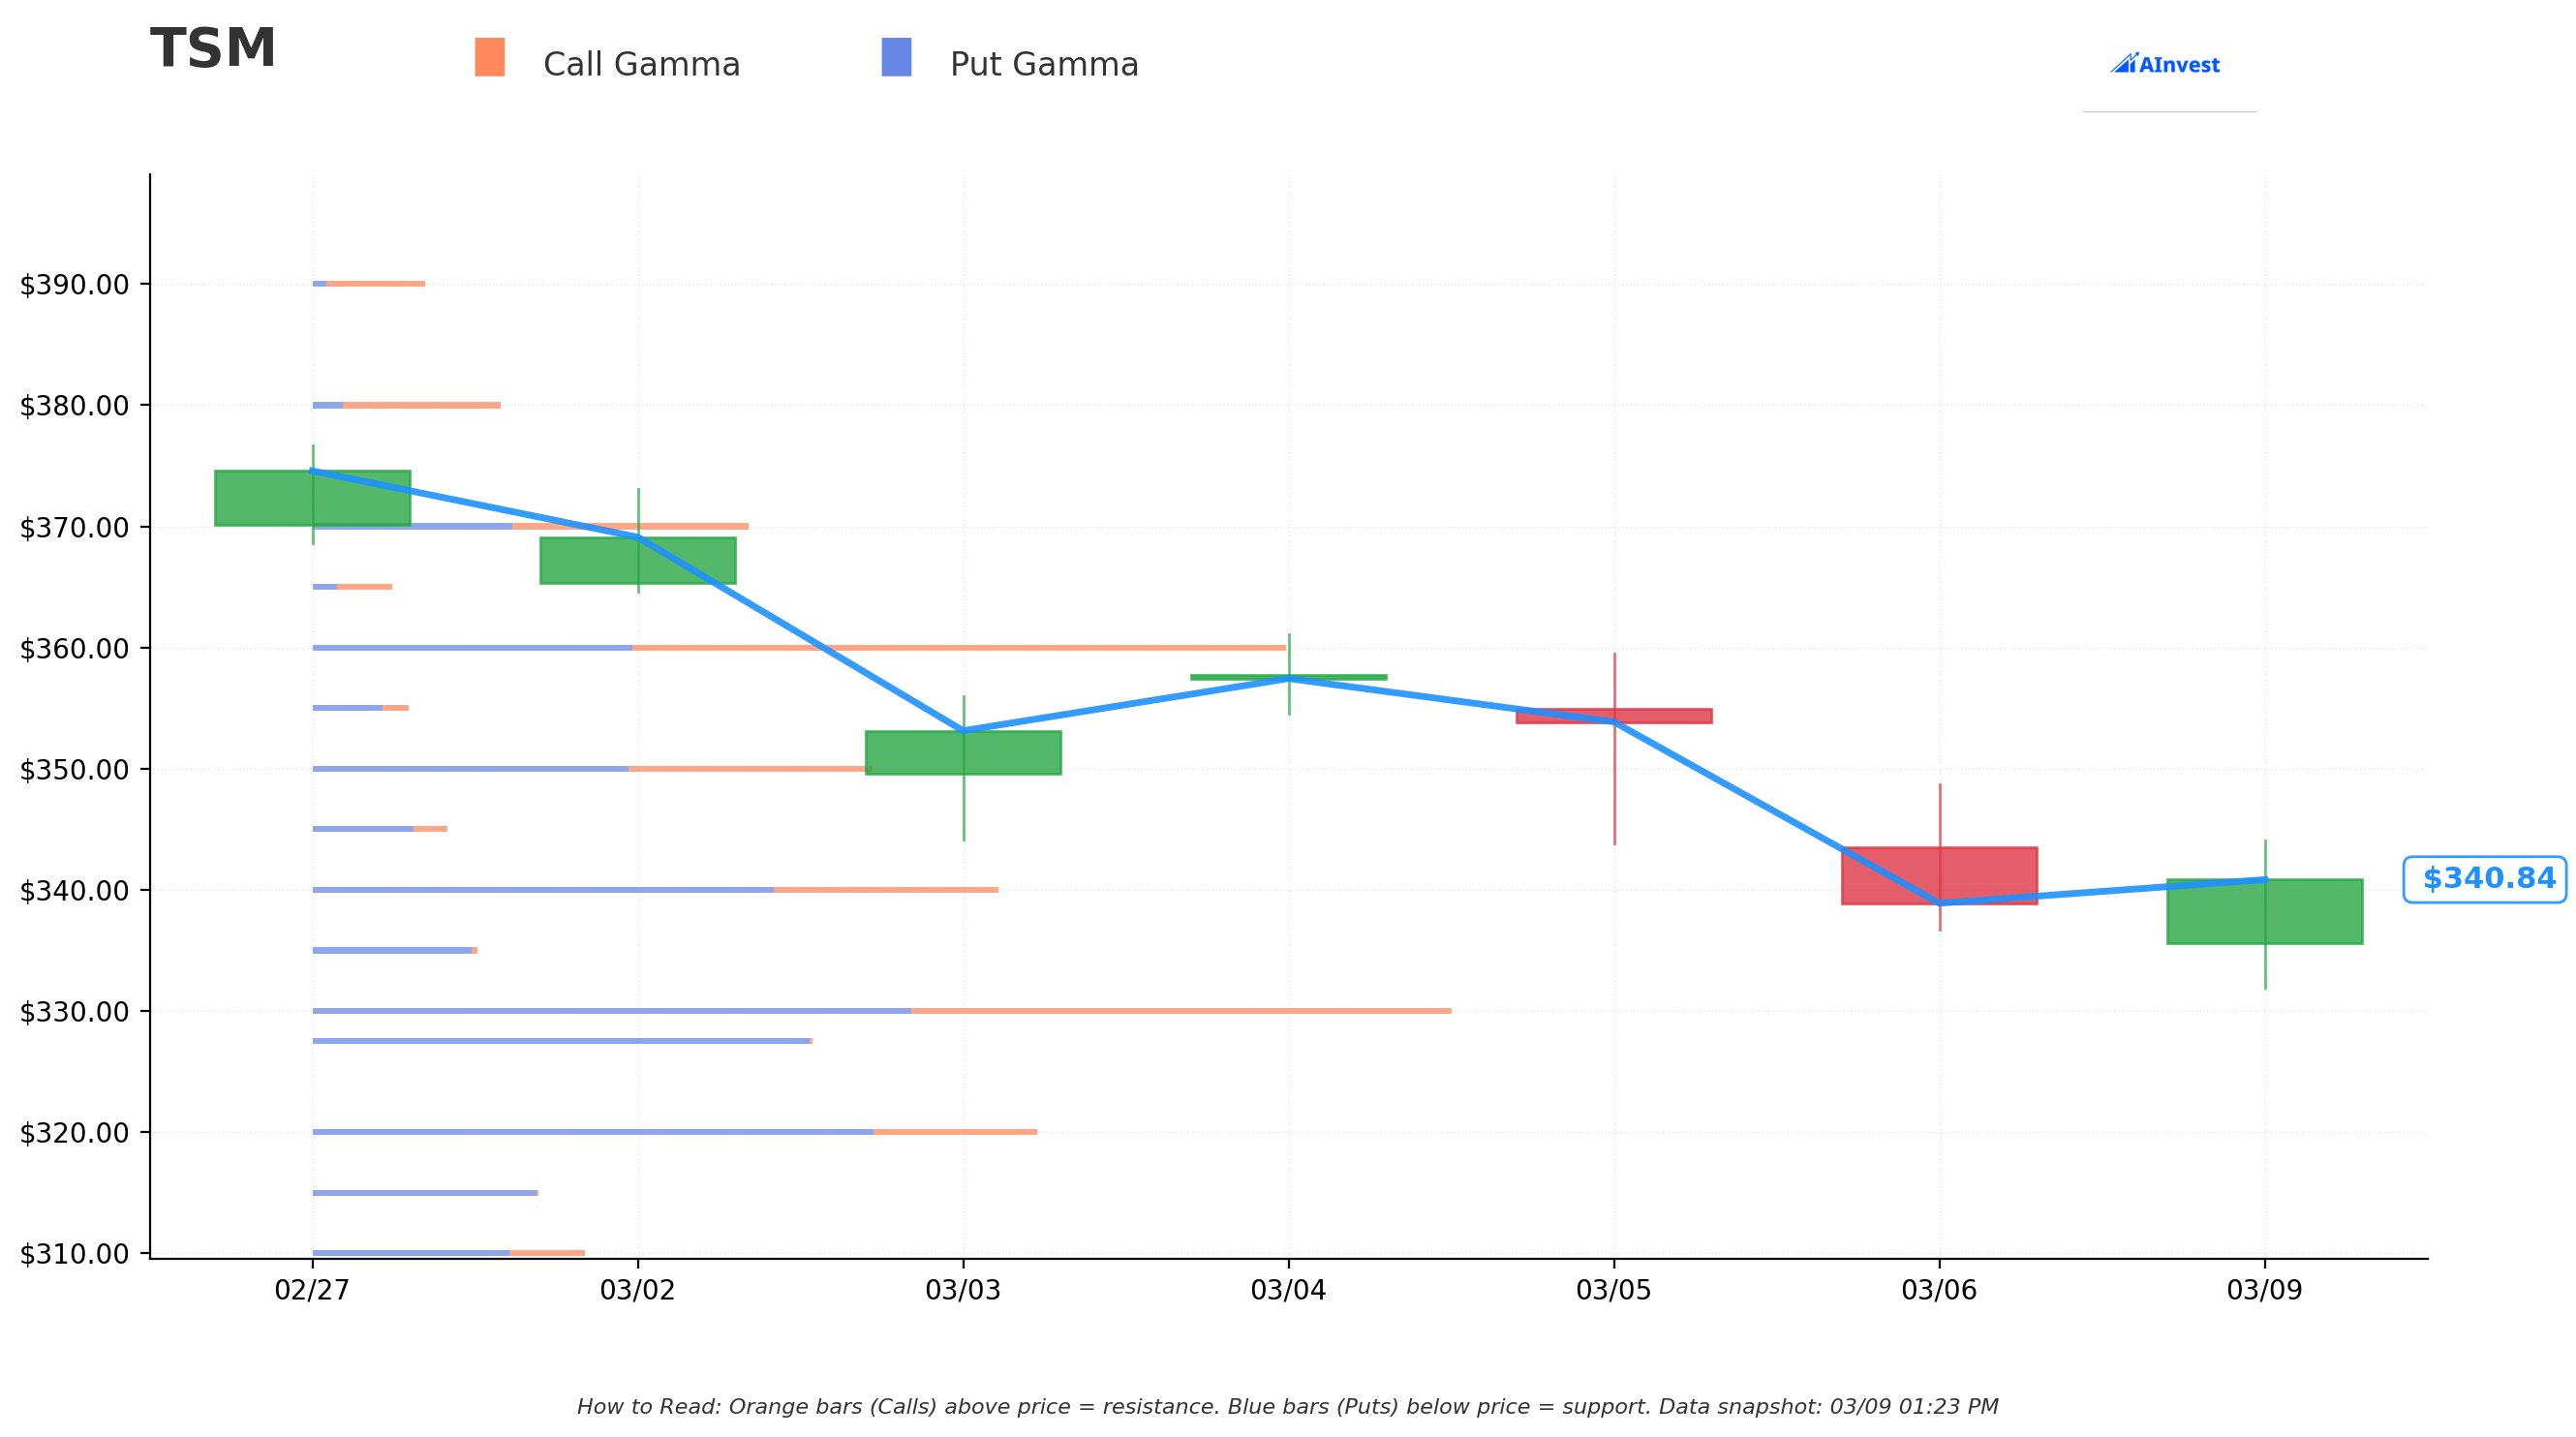
How to read this chart: The blue bars (put gamma) below the current price act as support floors -- heavy options activity that tends to slow down declines. The orange bars (call gamma) above the current price act as resistance ceilings -- strikes where hedging pressure can cap rallies. Bigger bars mean stronger levels.
Current Price: $340.33
🔵 Support Levels (Below Price):
- $340 -- $14.4B total GEX -- Immediate support right at the current price. This is exactly where the whale planted the new short put. Heavy put gamma here creates dealer buying pressure that should help the stock hold this level.
- $330 -- $24.1B total GEX -- The strongest single-strike support on the board, sitting 3% below current price. This is the gamma wall -- if $340 breaks, expect a magnetic pull toward $330 where massive dealer hedging flows kick in.
- $327.50 -- $10.7B total GEX -- Secondary support 3.8% below, reinforcing the $330 zone. The cluster of support between $327.50 and $330 creates a formidable floor.
🟠 Resistance Levels (Above Price):
- $350 -- The nearest significant resistance level. This sits 2.8% above the current price and represents the first hurdle TSM needs to clear for any meaningful recovery. A close above $350 would put the 200-day moving average ($353) back in play.
Net GEX Bias: Bearish -- Dealer positioning currently leans bearish, suggesting the path of least resistance in the very near term is sideways to slightly lower. However, the massive gamma concentration at $330-$340 creates a strong floor that should limit further downside.
Key insight: The institutional trader's $340 short put strike sits precisely at the first major gamma support level. This is not a coincidence. Sophisticated traders use gamma exposure data to select strikes where dealer hedging flows naturally support the stock. If $340 holds as gamma support, the short puts decay profitably. If it breaks, $330 (with $24.1B in GEX) provides a secondary floor only 3% lower.
Note: Gamma levels are dynamic and shift as new trades open and close. These represent the current snapshot.
📐 Implied Move Analysis
The options market is pricing in notable volatility ahead of the April 16 earnings report. Here is what the implied move data tells us:
| Timeframe | Expiration | Expected Range | Move % |
|---|---|---|---|
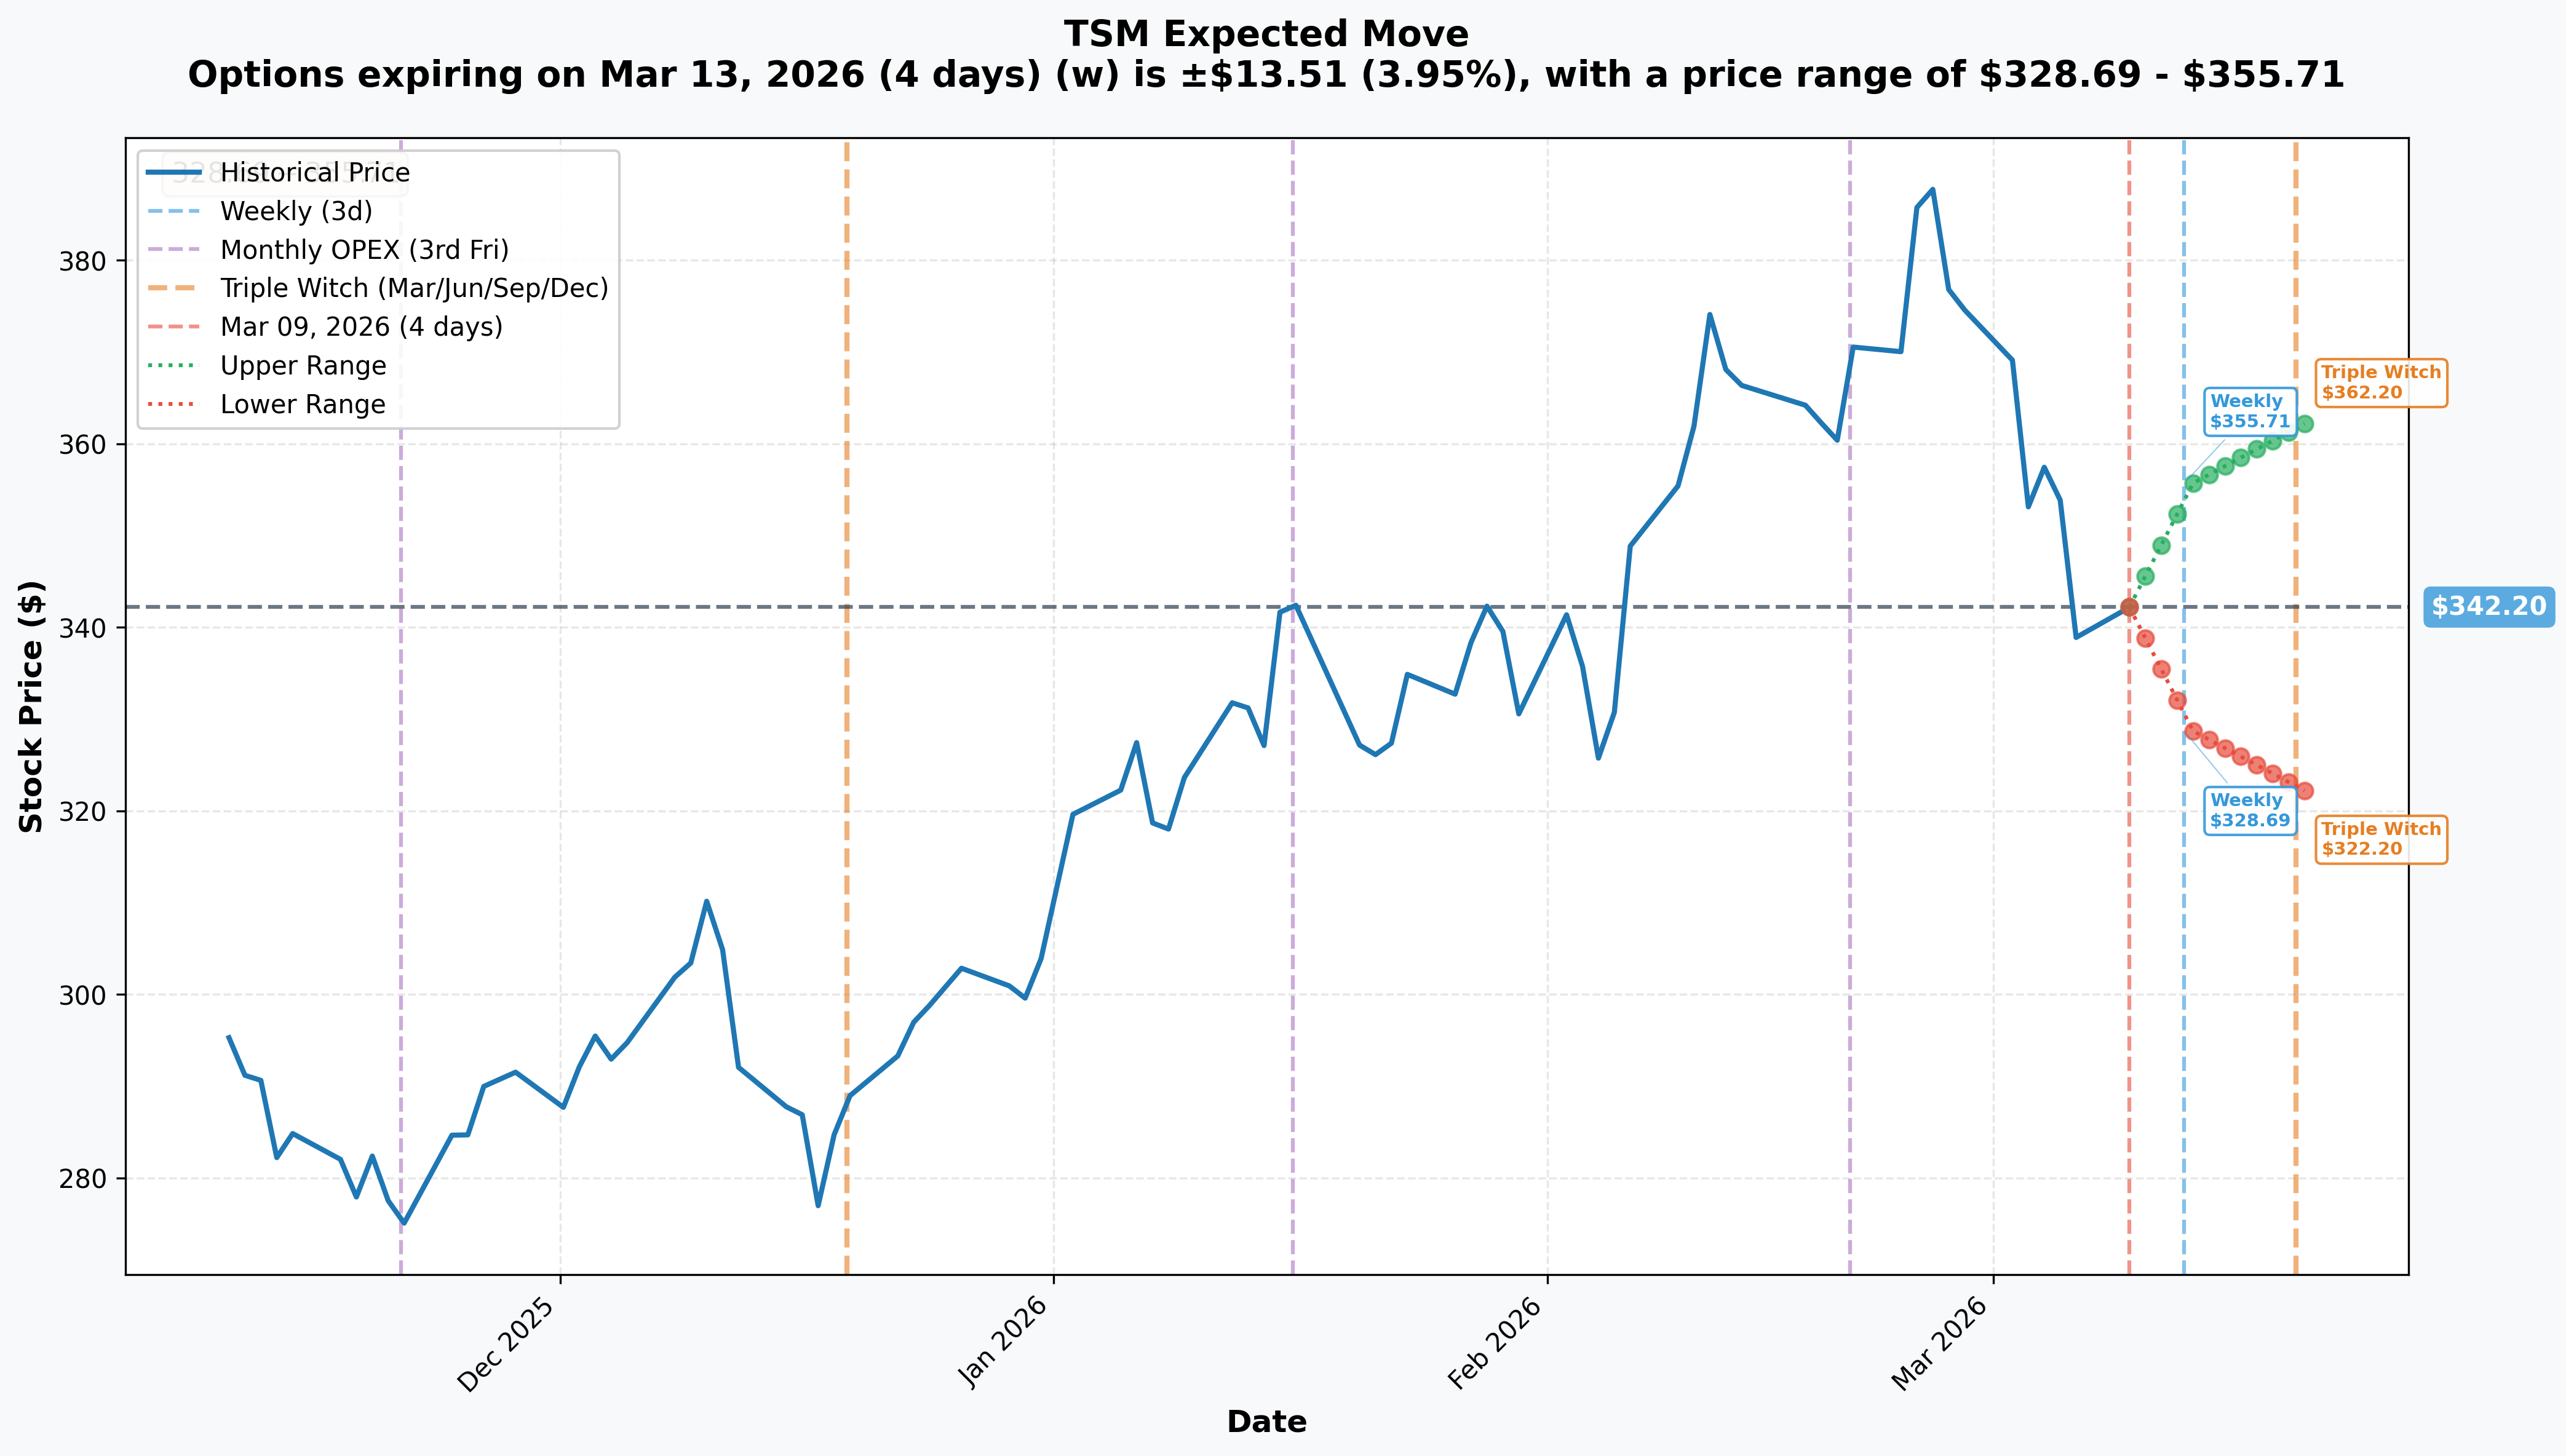
| 📅 Weekly | 2026-03-13 | $328.69 - $355.71 | +/- 3.95% ($13.51) |
| 📅 Monthly OPEX (March Put Expires!) | 2026-03-20 | $322.20 - $362.20 | +/- 5.84% ($20.00) |
| 📅 May (THIS TRADE!) | 2026-05-15 | Est. $305 - $380 | Est. +/- 10-11% |
Translation for us regular folks:
📈 Weekly range: $328.69 - $355.71 -- The market expects TSM to stay within roughly $14 of its current price this week. The lower end of this range ($328.69) is still above the massive $330 gamma support.
📅 Monthly OPEX range: $322.20 - $362.20 -- This is the window for the March 20 expiration of the OLD put position. The market says TSM could swing up to $20 in either direction through OPEX. The lower bound ($322) barely dips below the $327.50 gamma support cluster.
📊 The May $340 put expiration -- By May 15, the options market implies a wider range as the April 16 earnings event falls within this window. The institutional trader is betting that TSM holds $340 through earnings and beyond -- a level that sits within the lower half of the current implied distribution.
Key insight: The weekly implied move of only 3.95% suggests the market does not see an imminent catalyst to drive the stock much lower from here. The heavy-volume selloff from $390 may already be largely priced in. The real volatility event is the April 16 earnings report, which the May $340 put is specifically positioned to capture. If earnings are strong (as guided), IV crush will erode the put's value rapidly -- exactly what the short put seller wants.
🎪 Catalysts
📅 Upcoming (The Big Ones)
| Date | Event | Why It Matters |
|---|---|---|
| ~March 10 📊 | February 2026 Monthly Revenue Report | January set an all-time record at NT$401.26B (+36.8% YoY). February data will confirm the growth trajectory. Market expects continued +35-38% YoY growth. |
| April 16 🔥 | Q1 2026 Earnings Report | THE catalyst. Management guided revenue of $34.6-$35.8B (+38% YoY) with gross margins of 63-65% -- the highest guidance in company history. Consensus EPS ~$3.15 per ADS. |
| May 15 ⏰ | NEW SHORT PUT EXPIRES | 67 days for the thesis to play out. TSM must hold $340 for maximum profit. |
| Throughout 2026 🔬 | 2nm (N2) Production Ramp | Volume production commenced Q4 2025. Ramping from ~40K to 100K wafers/month in 2026. Capacity fully booked. Apple expected as first major adopter. |
| Q3 2026 🇺🇸 | Arizona Fab 2 Equipment Installation | Tool move-in for 3nm production begins, months ahead of schedule. Targeting production by Q4 2027. |
| H1 2026 🤝 | U.S.-Taiwan Tariff Deal Expected | Taiwan negotiating to reduce tariff from 20% to 15%. Could confirm expanded $465B Arizona investment. |
✅ Already Happened (Recent)
📊 Q4 2025 Results (January 15, 2026) -- Blowout quarter: Revenue of NT$1.05 trillion (~$33.7B), net income of NT$505.7B (+35% YoY, a new quarterly record), and gross margins of 62.3% that exceeded expectations. Advanced technologies (7nm and below) reached 77% of total wafer revenue.
💰 28% Dividend Increase (February 2026) -- TSMC raised its annual dividend to at least TWD 23 per share, up from TWD 18 in 2025. A strong signal of management confidence in sustained earnings growth.
🏗️ Record $52-$56 Billion 2026 CapEx -- The largest single-year CapEx in semiconductor industry history. 70-80% allocated to advanced process technologies. Management: "Higher capital expenditures always correlate to high growth opportunities in the following years."
🔄 NVIDIA Becomes Largest Customer -- In a historic shift, NVIDIA is set to supplant Apple as TSMC's top customer in 2026, reflecting the AI infrastructure buildout. NVIDIA secured over 60% of TSMC's total 2026 CoWoS advanced packaging output.
📦 CoWoS Capacity Quadrupling -- TSMC is scaling from ~35K wafers/month to 130K wafers/month by late 2026 -- a nearly 4x increase in the advanced packaging capacity that is critical for AI accelerators.
🇺🇸 $165B Arizona Investment + Potential $465B Expansion -- Reports emerged that TSMC is preparing a potential expansion to $465 billion total Arizona investment as part of a proposed U.S.-Taiwan tariff deal. The U.S. government has indicated potential tariff exemptions for TSMC conditional on U.S. investment.
🎲 Price Targets & Probabilities
Based on gamma levels, implied move data, the catalyst calendar, and analyst consensus, here are the scenarios through the May 15, 2026 expiration:
Analyst Consensus
| Firm | Rating | Price Target |
|---|---|---|
| Barclays | Overweight | $450 |
| DA Davidson | -- | $450 |
| TD Cowen | Hold | $370 |
| Bernstein | -- | $330 |
| Consensus | Buy (83%) | ~$392 (median ~$405) |
The consensus target of ~$392 implies roughly 15% upside from the current $340 level. Even TD Cowen's relatively cautious $370 target suggests 9% upside.
🚀 Bull Case: $380 - $405 (+12% to +19%)
How we get there:
- 📊 Q1 earnings on April 16 deliver at or above the $34.6-$35.8B revenue guidance with 63-65% gross margins
- 🔬 2nm production ramp updates show yields exceeding expectations and Apple/NVIDIA adoption timeline on track
- 🤝 U.S.-Taiwan tariff deal announced, reducing the tariff rate from 20% to 15% and confirming the expanded Arizona investment
- 📈 Stock reclaims the 200-day MA ($353), triggering a momentum chase back toward the 50-day MA ($375) and beyond
- 🏦 Analysts reiterate $450 targets as the AI infrastructure cycle remains intact
What this means for the whale trade: Maximum profit. The May $340 puts expire worthless, and the trader keeps the entire $12M premium. The put roll from $370 to $340 looks like a masterful adjustment.
Probability: ~30% -- Requires earnings to land at the top of guidance plus a positive macro catalyst (tariff deal or AI demand acceleration).
⚖️ Base Case: $335 - $370 (-2% to +9%)
Most likely scenario:
- ✅ TSM meets Q1 guidance -- revenue ~$35B, gross margins ~64% -- solid but largely expected
- 📊 Stock stabilizes in the $340-$360 range as the market digests the numbers and monitors 2nm ramp progress
- 🔄 Gamma support at $330-$340 holds on any dips, preventing a deeper selloff
- 📈 Gradual recovery toward the 200-day MA ($353) as tariff fears moderate and AI demand remains strong
- ⚖️ The 13% pullback from ATH is viewed as a buying opportunity, but the stock needs time to rebuild momentum
What this means for the whale trade: Profitable. As long as TSM stays above $340 by May 15, the short puts expire worthless (or close to it) and the trader keeps most or all of the $12M premium. Even if the stock dips briefly to $335, time decay and post-earnings IV crush work in the trader's favor.
Probability: ~45% -- The most likely path. TSM delivers solid earnings, the stock consolidates, and the put seller benefits from time decay.
🐻 Bear Case: $305 - $335 (-10% to -2%)
What could go wrong:
- 😰 Q1 earnings miss on revenue or gross margins -- even a slight miss after the company's strongest-ever guidance would be punishing
- 🌏 Taiwan Strait geopolitical tensions escalate -- Bloomberg models estimate a $10.6 trillion global economic shock
- 📉 AI demand deceleration -- any evidence that hyperscaler spending is slowing would directly impact the thesis
- 💱 Tariff deal falls through, keeping the 20% rate and creating uncertainty around the Arizona expansion
- 📉 Stock breaks below $340 gamma support, testing the $330 wall (24.1B GEX) and potentially the $327.50 level
What this means for the whale trade: Painful. If TSM drops to $320 by May, the $340 put has $20 of intrinsic value. On 11,000 contracts, that is a significant mark-to-market loss. However, the trader collected $12M in premium, which provides a cushion -- the effective breakeven is roughly $329 (strike minus premium per contract). The real pain starts below $329.
Probability: ~25% -- Would require an earnings miss combined with a negative macro shock. Possible but not the base case given the strong Q4 results and Q1 guidance.
💡 Trading Ideas
🛡️ Conservative: "Own the AI Backbone"
Structure: Buy TSM shares at ~$340
Why this works: TSM is 13% below its all-time high, trading at a discount to the consensus price target of ~$392 (15% upside). The institutional trader who just sold $340 puts is effectively saying they are willing to own the stock at this level. You can do the same by buying shares outright -- no expiration risk, no theta decay, and you collect TSMC's recently-raised dividend (28% increase) while you wait.
📊 Entry: ~$340 📊 Stop loss: $315 (-7.4% risk) -- below the $327.50 gamma support cluster 📊 Target 1: $370 (TD Cowen target, +8.8%) 📊 Target 2: $405 (consensus median, +19%) 📊 Best for: Long-term investors who believe the AI infrastructure cycle has years to run and want to own the company that manufactures 90% of the world's most advanced chips.
⚖️ Balanced: "Shadow the Whale" -- Cash-Secured Put
Structure: Sell TSM May $330 Put
Why this works: This follows the whale's playbook but at a slightly lower strike for extra margin of safety. The $330 strike sits right at the massive $24.1B gamma support wall -- the single strongest support level on the board. You collect premium for agreeing to buy TSM at $330 (3% below current price), and if the stock stays above $330 through May 15, you keep the premium as profit.
📊 Estimated premium: ~$8-$10 per contract 📊 Effective buy price: ~$320-$322 (strike minus premium) 📊 Cash required: $33,000 per contract (cash-secured) 📊 Win probability: ~65-70% (stock needs to stay above $330) 📊 Best for: Traders who agree with the whale's thesis but want the extra cushion of a below-ATM strike and the massive gamma support at $330.
Pro tip: If TSM drops below $340 before April 16 earnings, reassess whether the fundamental thesis still holds before maintaining the position. The beauty of this trade is that you get paid to potentially buy TSM at a ~6% discount to where a major institution just expressed willingness to buy.
🚀 Aggressive: "Earnings Breakout Play" -- Bull Call Spread
Structure: Buy TSM Apr $345 Call / Sell TSM Apr $370 Call, April 17 expiration
Why this works: This is a pure earnings bet. TSM reports April 16 (after close), and the April 17 expiration captures the overnight reaction. Management already guided Q1 revenue of $34.6-$35.8B (+38% YoY) with record 63-65% gross margins. If the company delivers, the stock should gap through $350 resistance and potentially test the $370 level (where the old short put was struck). The $25-wide call spread gives you defined-risk upside exposure.
📊 Estimated cost: ~$8-$10 per spread 📊 Max profit: ~$15-$17 per spread (at $370+, roughly 150-170% return) 📊 Breakeven: ~$353-$355 📊 Max risk: Premium paid ($800-$1,000 per spread) 📊 Best for: Traders with high conviction that TSM's Q1 earnings will trigger a recovery rally. Only risk what you can afford to lose -- this is a binary event play.
Real talk: TSM has beaten earnings estimates in 8 consecutive quarters, and Q1 guidance was set above Street consensus. The bar for a positive reaction is reasonable, not impossibly high. But the stock is in a downtrend, and sometimes even good earnings get sold. Size accordingly.
⚠️ Risk Factors
❗ 13% Pullback and Negative Momentum -- TSM has fallen from $390 to $340 in just two weeks. The stock is trading below both its 50-day ($375) and 200-day ($353) moving averages. Stocks in active downtrends can continue falling even after positive news. The whale is expressing a value thesis, but catching a falling knife requires conviction and proper risk management.
❗ Geopolitical Risk Remains the Elephant in the Room -- Taiwan Strait tensions are the #1 existential risk for TSMC shareholders. Bloomberg models estimate a conflict could cost the global economy $10.6 trillion in the first year. TSMC controls ~90% of leading-edge chip production, making any disruption catastrophic. The Arizona and Japan fabs provide geographic diversification, but leading-edge production remains overwhelmingly Taiwan-based.
❗ Tariff and Trade Policy Uncertainty -- U.S. 25% tariffs on select semiconductor imports create cost pressure. Taiwan's current 20% tariff rate is under negotiation to reduce to 15%, but a failed deal could keep the higher rate and rattle investor confidence. China's rare earth export restrictions add another layer of supply chain risk.
❗ Customer Concentration -- NVIDIA and Apple together represent an outsized share of revenue. NVIDIA is becoming TSMC's #1 customer, which creates binary risk. Any slowdown in AI infrastructure spending by hyperscalers would directly impact TSMC. The company has even warned NVIDIA and Broadcom of capacity constraints, which could push customers to seek alternatives.
❗ Margin Dilution From Overseas Expansion -- The Arizona, Japan, and Germany fab ramp-ups are expected to dilute gross margins by 2-4% for several years. The 2nm technology ramp will add another 2-3% of dilution in H2 2026 as initial yields are lower. While Q1 guidance of 63-65% margins shows pricing power, the direction of margin pressure is real.
❗ AI Demand Sustainability -- TSMC's growth thesis depends on a mid-to-high-fifties CAGR for AI chips through 2029. CEO C.C. Wei has dismissed "bubble" concerns but acknowledged the need to "invest carefully." Any evidence of overcapacity or slowing AI adoption would significantly impact the stock.
❗ Execution Risk on $56B CapEx -- TSMC is deploying a record $52-$56 billion in CapEx in 2026 across multiple continents simultaneously. Arizona fabs face higher labor costs and construction challenges. The 2nm yield ramp must meet an aggressive timeline. CoWoS capacity must quadruple without bottlenecks. Executing all of this simultaneously at scale is a tall order, even for TSMC.
🎯 The Bottom Line
Here's the deal: An institutional trader just executed a textbook $28M put roll on the world's most important semiconductor company. They closed their losing March $370 put position, accepted the new reality of TSM at $340, and immediately re-established a larger position at the current price level with 67 more days of runway.
This is not a panicked exit. This is not capitulation. This is disciplined risk management combined with continued conviction.
The trader rolled down $30 in strike (from $370 to $340), rolled out 56 days in time (from March 20 to May 15), and increased their contract size from 5,100 to 11,000. They are saying: "The pullback from $390 was painful, but TSM at $340 with Q1 earnings guidance of +38% YoY revenue growth, record gross margins, fully-booked 2nm capacity, and NVIDIA becoming its largest customer? That is a price I am willing to own at."
If you are bullish on TSM: The $330-$340 zone is a technically and structurally supported level to build a position. The gamma wall at $330 ($24.1B GEX) provides a meaningful floor. The April 16 earnings report is your next major catalyst -- if TSM delivers on its strongest-ever guidance, the recovery toward $370-$390 could be swift. Consider the cash-secured put at $330 to get paid while you wait, or buy shares outright with a stop below the gamma support cluster.
If you are on the sidelines: The institutional put roll tells you sophisticated money believes $340 is a fair entry. But the stock is in a downtrend, trading below both major moving averages, with tariff uncertainty and geopolitical risk as real overhangs. If you want to wait, watch for one of these signals: (1) a close above $350 resistance, (2) a strong February revenue number (expected ~March 10), or (3) Q1 earnings on April 16 that confirms the growth trajectory.
If you are bearish: Respect the gamma support at $330 and the $327.50 secondary floor. A break below $327 would signal something more than a routine correction and could open the door to $315-$320. But going short a stock where an institution just put $12M behind the $340 level -- with $24.1B in gamma support at $330 and Q1 earnings guided well above consensus -- requires serious conviction and precise risk management.
The smart money has spoken. $28 million. A clean roll. Bullish bias. Now we wait for April 16 to find out if they are right. 👀
Disclaimer: This analysis is for informational purposes only and does not constitute financial advice. Options trading involves significant risk of loss. Always do your own research and consider your risk tolerance before entering any trade. Past unusual options activity is not a reliable predictor of future stock price movement.
About Taiwan Semiconductor Manufacturing Company: TSMC is the world's largest dedicated semiconductor foundry, manufacturing chips for Apple, NVIDIA, AMD, Qualcomm, and Broadcom. Founded in 1987, headquartered in Hsinchu, Taiwan, with a market cap of $1.76 trillion and over 75,000 employees. The company controls approximately 75% of leading-edge foundry revenue and over 90% of the world's most advanced chip production at 3nm and 5nm nodes.