🔬 TSM Options Flow Analysis — March 20, 2026
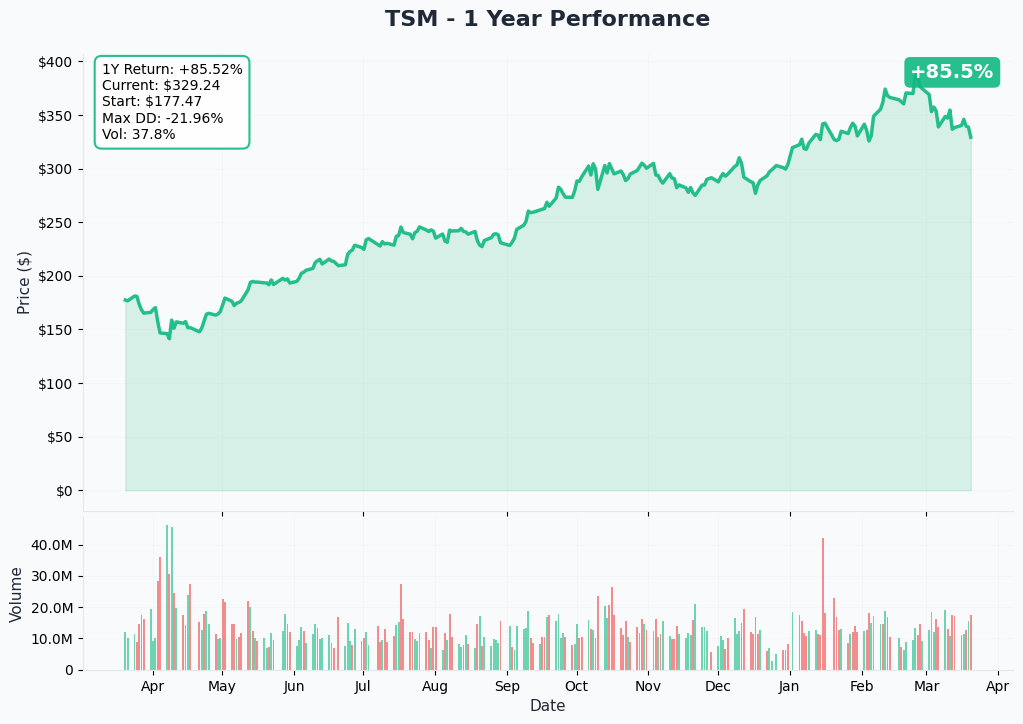
Taiwan Semiconductor Manufacturing (TSM) | $327.43 | Market Cap: $1.76T
📋 The Trades at a Glance
| Field | Trade 1 (Call) | Trade 2 (Put) |
|---|---|---|
| Time | 15:44:24 | 15:44:24 |
| Ticker | TSM | TSM |
| Symbol | TSM20260327C300 | TSM20260327P300 |
| Type | CALL | PUT |
| Strike | $300 | $300 |
| Expiration | Mar 27, 2026 | Mar 27, 2026 |
| Side | MID | MID |
| Buy/Sell | BUY | BUY |
| Volume | 16,000 | 17,000 |
| Open Interest | 32 | 4,500 |
| Size | 16,000 | 16,000 |
| Option Price | $29.35 | $2.00 |
| Spot at Fill | $327.43 | $327.43 |
| Premium | ~$47M | ~$3.2M |
| Z-Score | 4.24 | 5.41 |
Combined Premium: $50.2 million
🧩 What Actually Happened Here
At 3:44 PM on a Friday — in the final minutes of a weekly expiry week — someone just moved $50.2 million across two TSM option legs simultaneously. Same strike ($300), same expiration (March 27), same timestamp down to the second, and nearly identical contract sizes. This isn't a directional bet on TSM going up or down. This is a position management event — specifically, the unwinding of a synthetic long or conversion that was previously established at the $300 strike.
The Plain English Version
Think of it like this: at some point in the past, a large institution built a complex structure that effectively acted like owning TSM stock at $300 per share. That structure involved holding a call and selling a put at the same strike — a combination called a "synthetic long." To close it out, they now need to do the reverse: buy back both legs at the same time. That's exactly what happened here.
This kind of trade is sometimes called a conversion unwind or closing synthetic long. The institution isn't saying "TSM is going up" or "TSM is going down." They're saying "our time in this particular structure is done, and we're getting out cleanly."
Why the Math Tells the Story
The $300 call was trading at $29.35 when TSM was at $327.43. That means:
- Intrinsic value (how deep in-the-money it is): $27.43
- Time value remaining: $1.92 (just 7 days to expiry, nearly all intrinsic)
The $300 put was trading at $2.00 — pure time value, fully out-of-the-money.
A rational speculator would never pay $29.35 for a call that's expiring in 7 days with almost no time premium left if they were making a fresh directional bet. They would buy a longer-dated option or buy the stock outright. Paying $47 million to capture $1.92 of time value on a 1-week call makes no sense as a new trade. It makes complete sense as a closing trade on an existing synthetic position.
The two Z-scores confirm how unusual this is in the context of normal market activity:
- Call Z-Score: 4.24 (extremely unusual vs. typical flow)
- Put Z-Score: 5.41 (even more extreme — only ~17 puts of OI existed before this print)
📊 Gamma & Support/Resistance Map
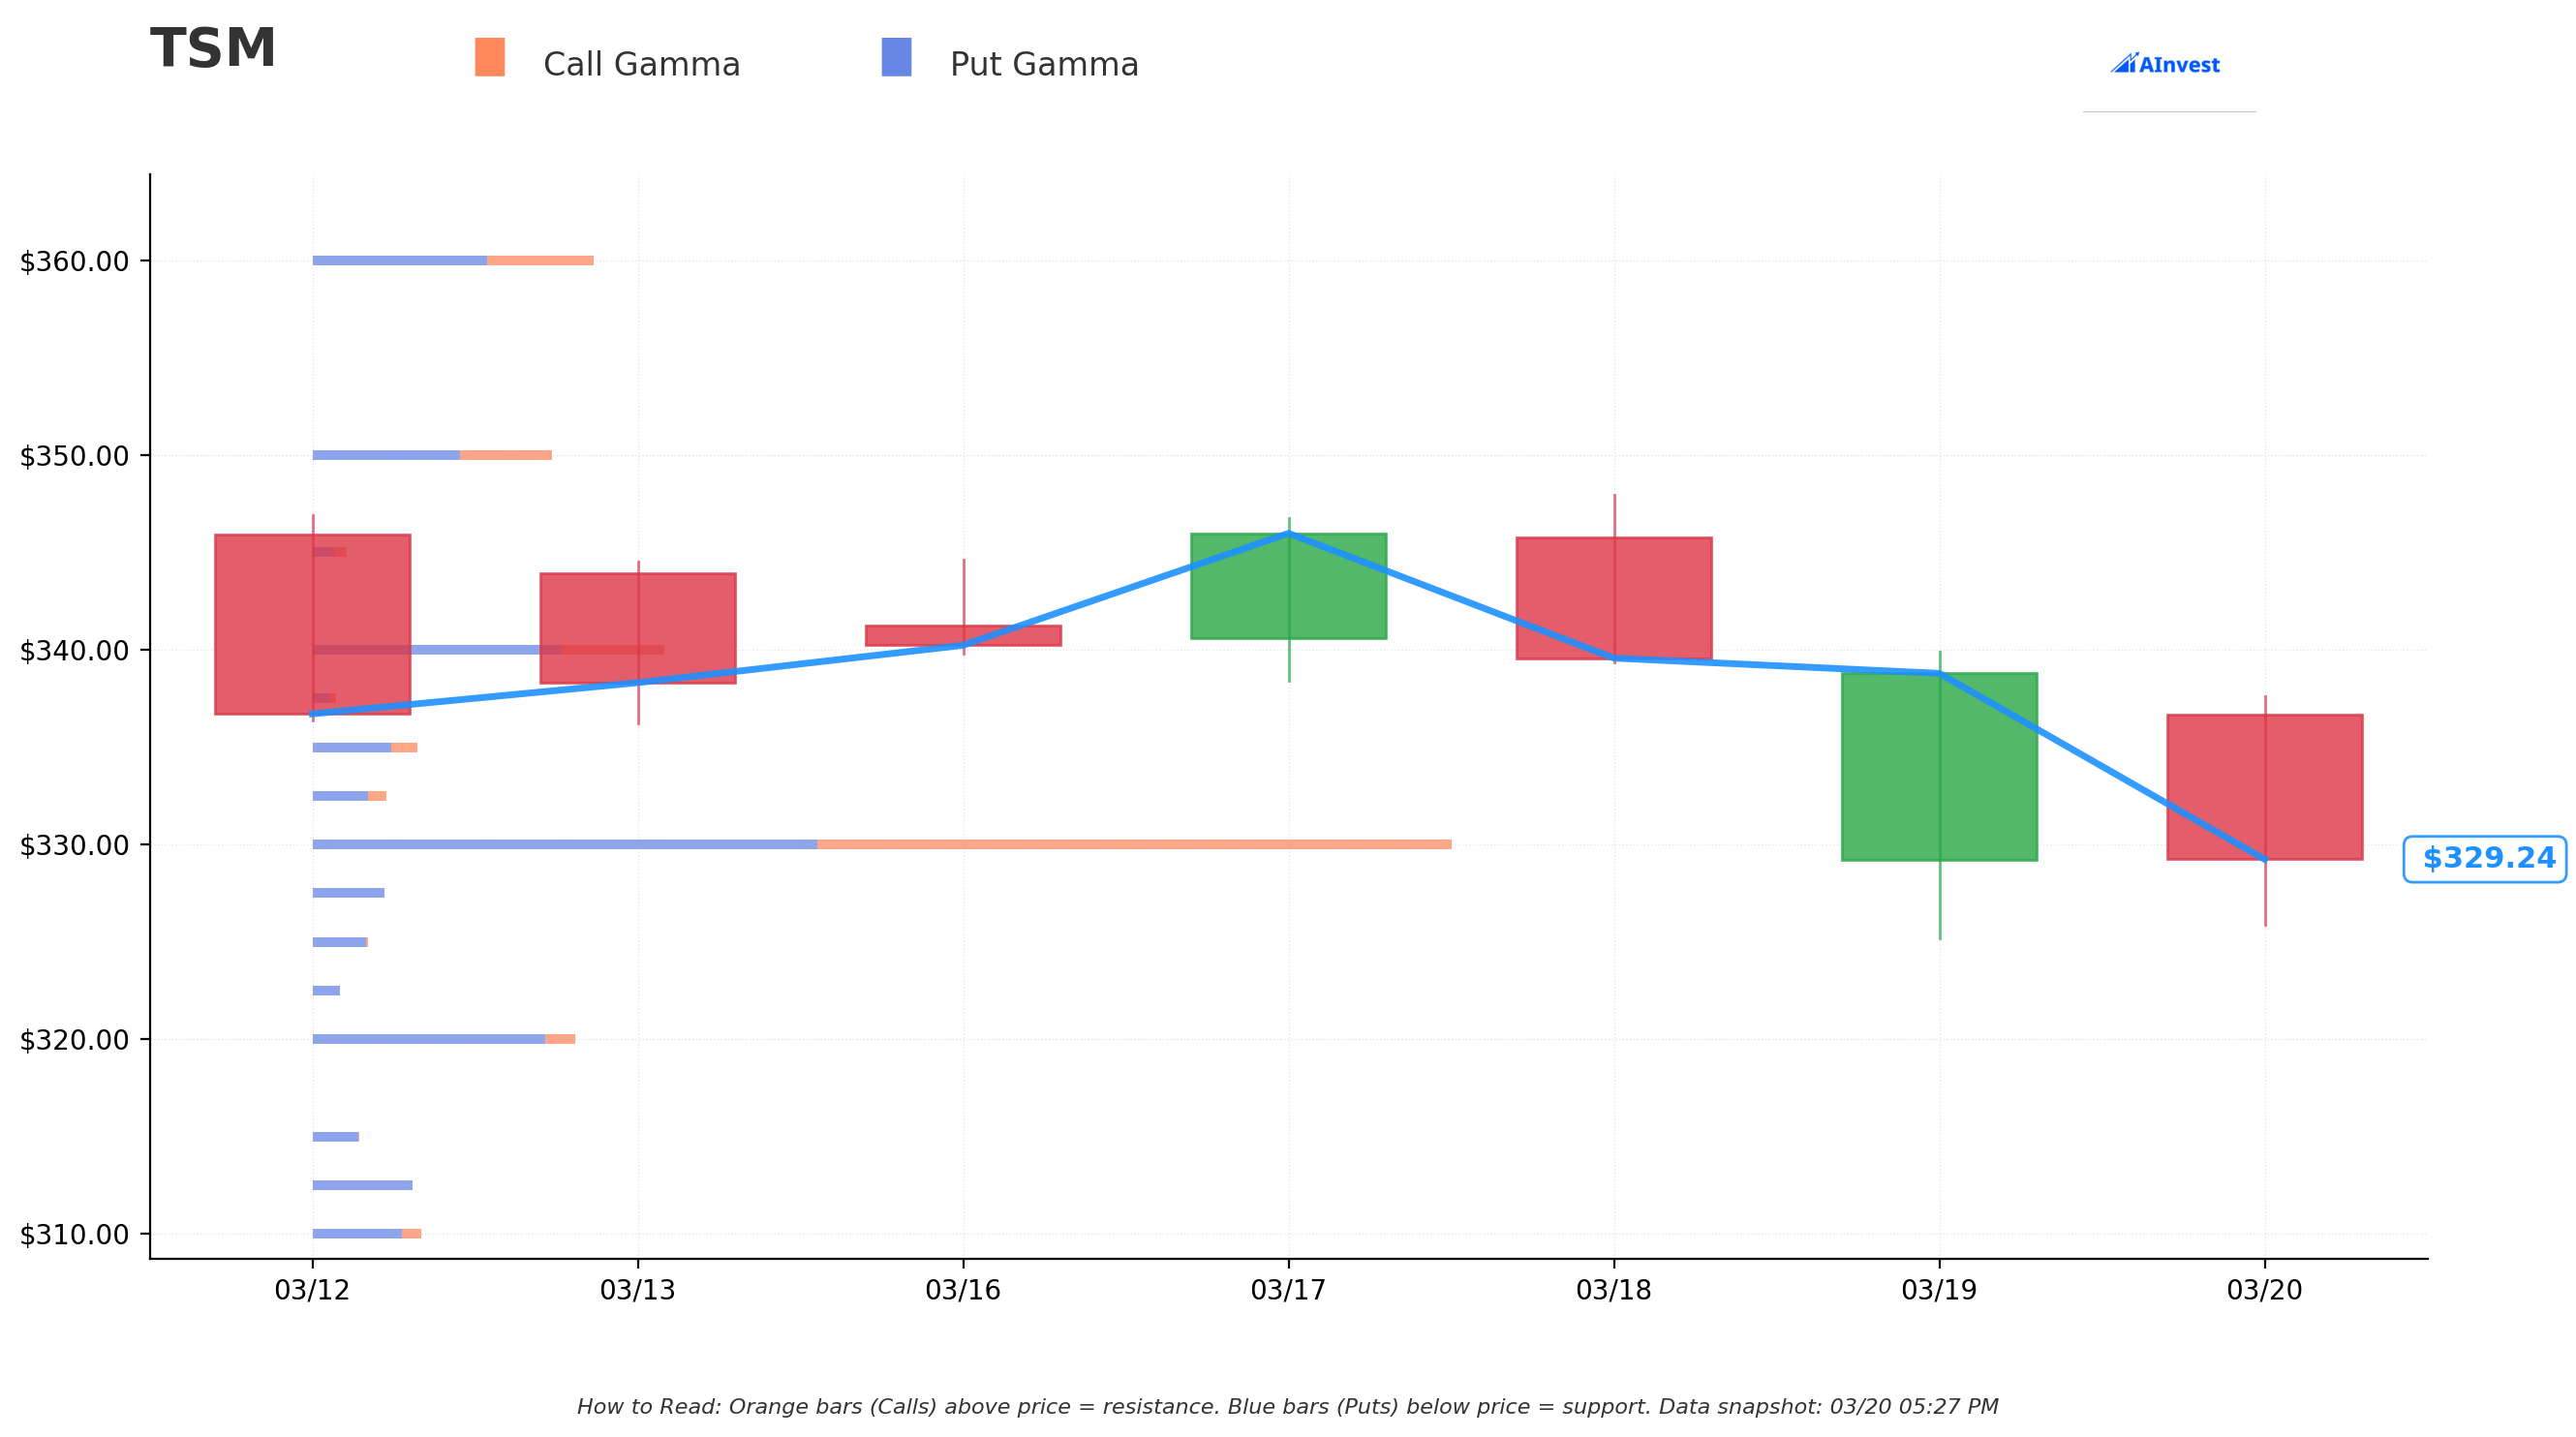
The GEX (Gamma Exposure) picture for TSM tells an interesting story about where the real structural support sits right now.
Current Price: $330.63 GEX Bias: Bearish (109B calls vs. 169B puts — more put gamma in the market)
| Level | GEX (Billions) | Role |
|---|---|---|
| $370 | 5.4B | Resistance |
| $360 | 19.1B | Resistance |
| $350 | 16.2B | Resistance |
| $340 | 23.9B | Resistance |
| $335 | 7.2B | Resistance |
| $330 | 77.3B | STRONGEST SUPPORT — stock sitting here |
| $320 | 17.9B | Support |
| $312.50 | 6.8B | Support |
| $310 | 7.4B | Support |
| $300 | 11.1B | Strike where this trade hit |
The standout feature here: TSM is essentially sitting right on top of the $330 level which carries 77.3 billion in gamma exposure — the single largest GEX cluster in the entire structure. This acts as a gravitational magnet for price. Dealer hedging at this level creates a self-reinforcing dynamic where moves away from $330 tend to get pulled back.
The $300 strike where this synthetic was structured also shows 11.1B in GEX support — a meaningful floor in its own right and consistent with why a large institution would have chosen that level to build a synthetic position in the first place.
📐 Implied Move Analysis
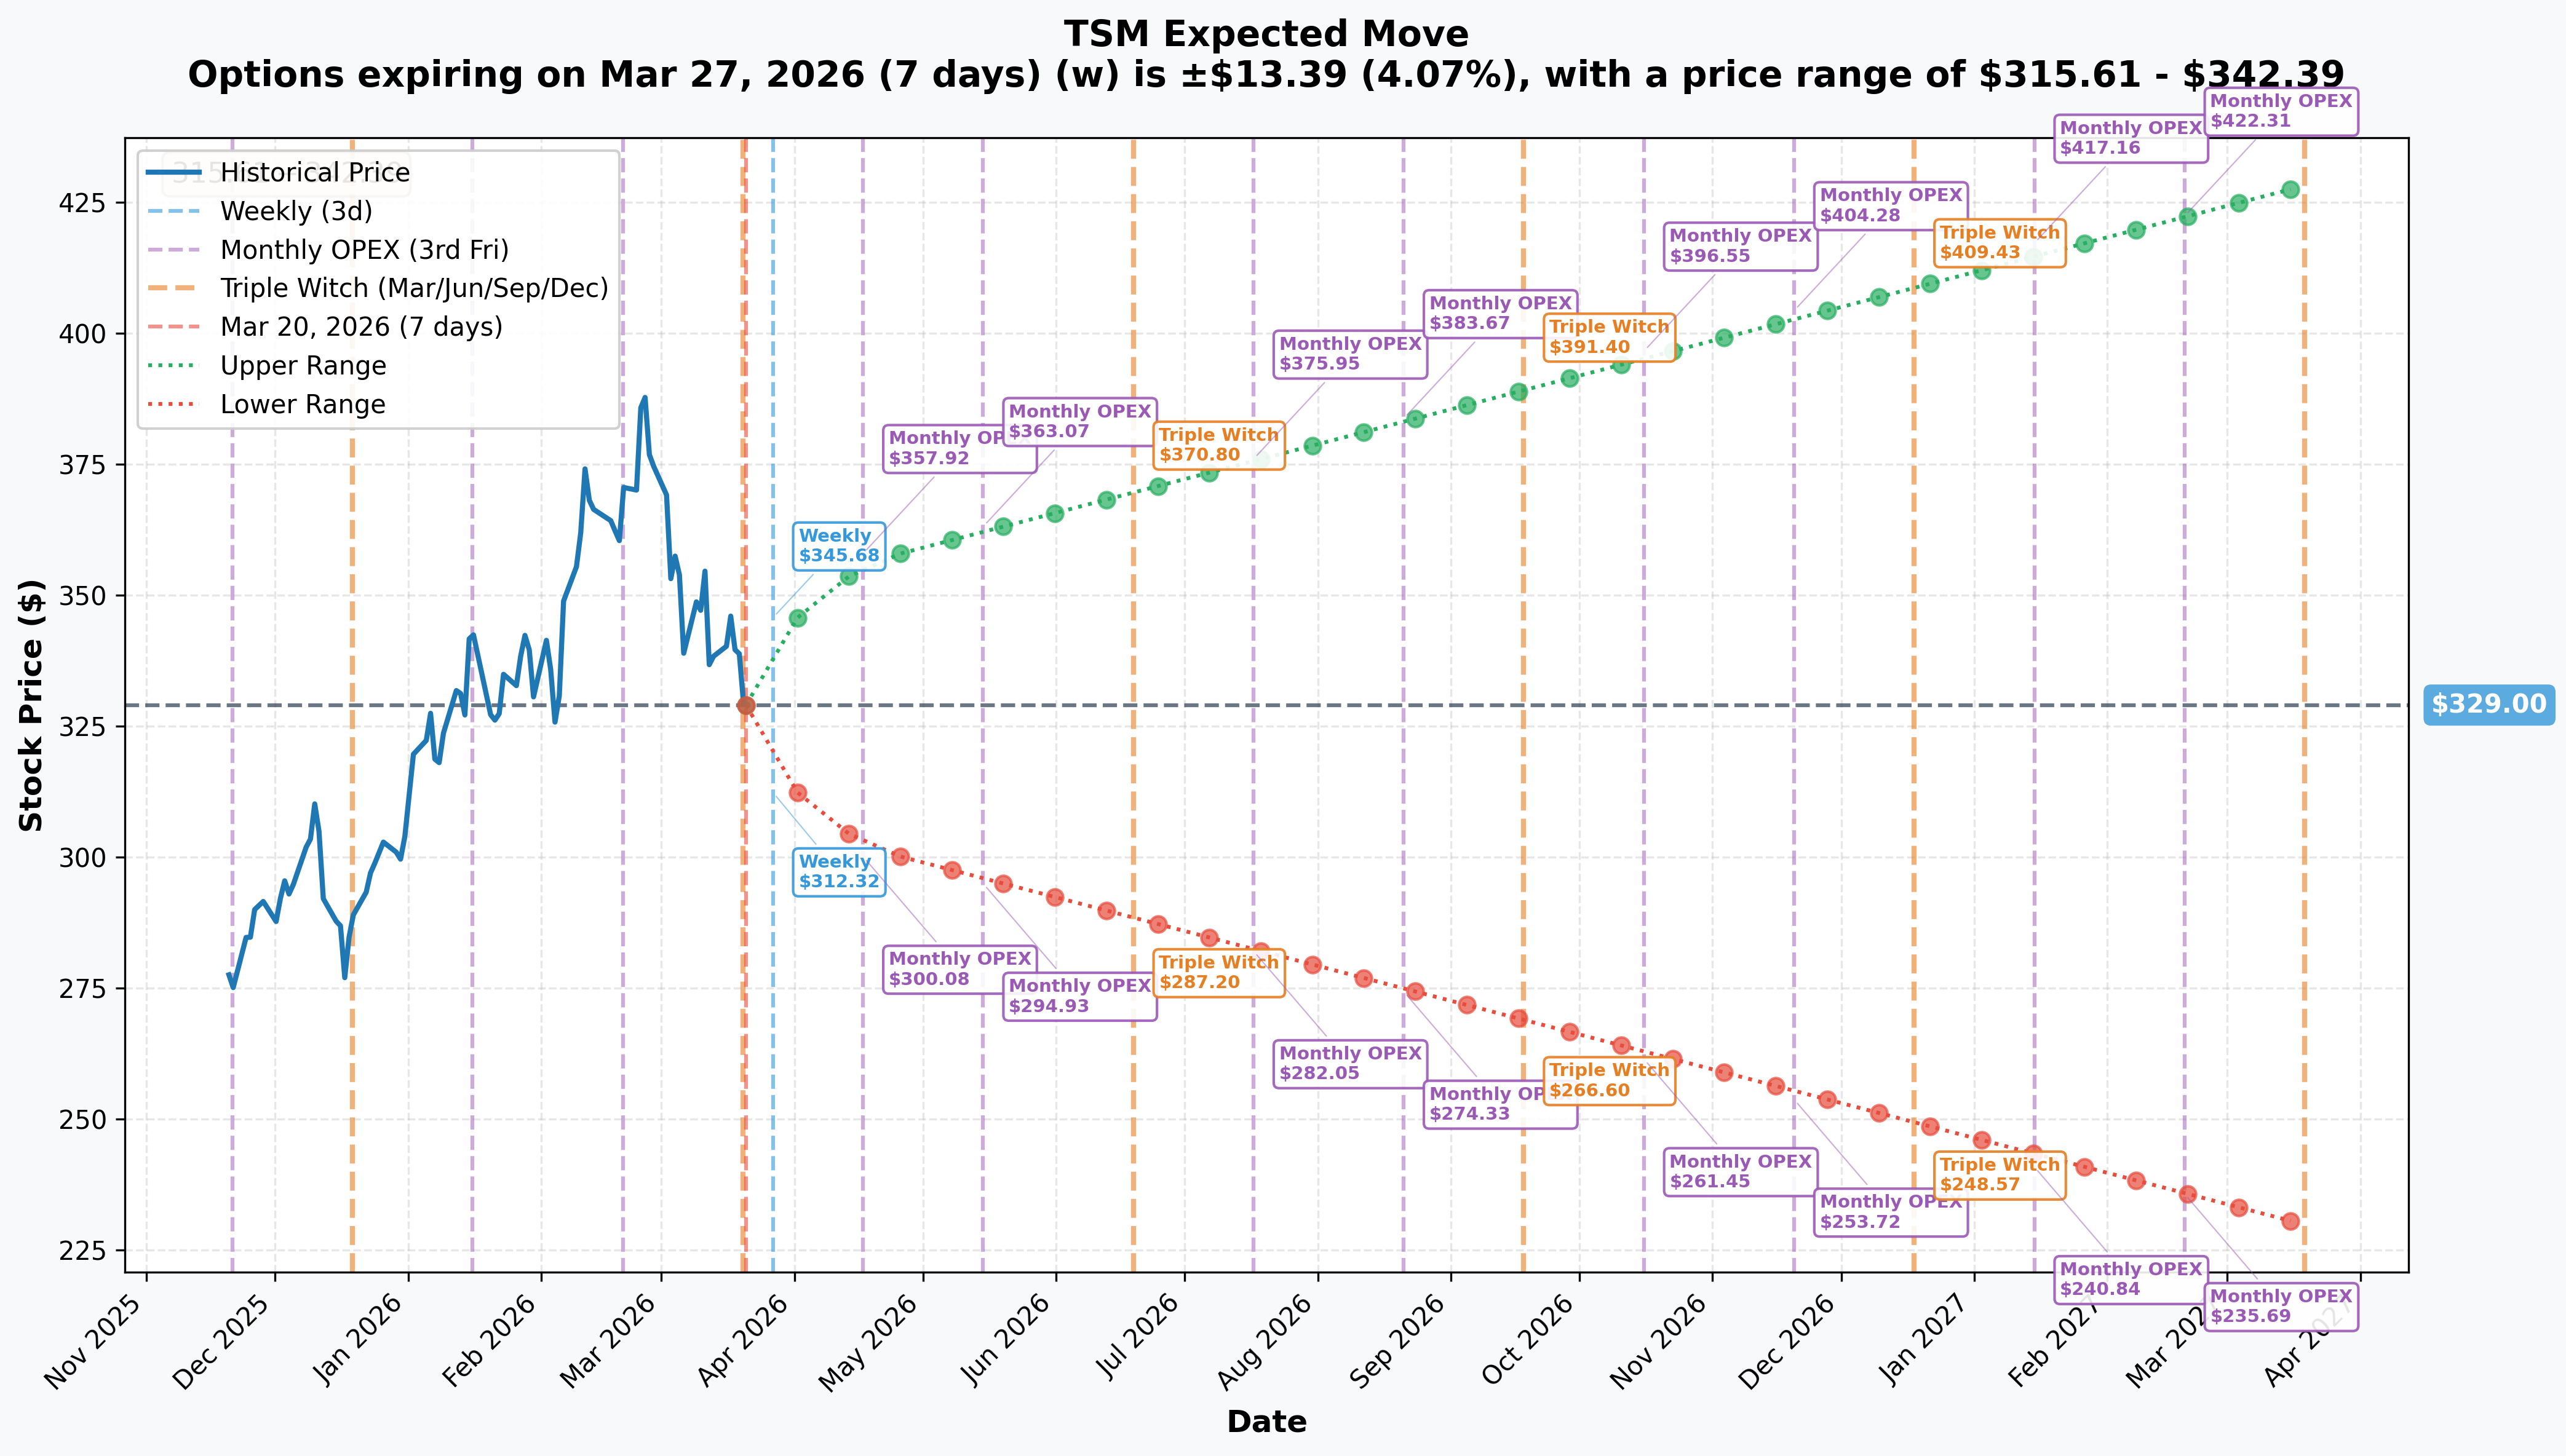
| Timeframe | Implied Move | Range |
|---|---|---|
| Weekly (Mar 27 — THIS trade's expiry) | ±4.07% ($13.39) | $315.61 – $342.39 |
| Monthly OPEX (Apr 17) | ±8.27% ($27.20) | $301.80 – $356.20 |
| Yearly LEAPS | ±30.19% | $229.68 – $428.32 |
The options market is pricing in a ±$13.39 move for TSM through March 27 — the same expiry as the trade that just closed. With the stock at $329, the weekly implied range runs from $315.61 on the downside to $342.39 on the upside.
Note that the $300 strike that was just unwound sits $15 below the implied range floor. This isn't coincidental — when the original synthetic was built, $300 would have represented a comfortably out-of-the-money put strike, functioning as a defined risk level well outside normal weekly trading ranges.
🏭 Company Context: Why TSM Matters
TSMC is the world's largest dedicated semiconductor foundry with approximately 60-70% global market share at advanced nodes. It is not just a chip company — it is the physical substrate of the AI infrastructure build-out. Every Nvidia H100, every Apple A-series chip, every AMD EPYC processor runs through TSMC's fabs.
Recent Fundamental Highlights:
- Q4 2025 earnings beat (January 15, 2026): Revenue NT$1,046B (+20.5% YoY), EPS $3.14/ADR (+35% YoY), 62.3% gross margin — a record quarter by net profit
- Full Year 2025: $122B revenue, up 35.9% YoY in USD terms
- 2nm production commenced Q4 2025, 15 customers booked, capacity fully allocated through 2026 — including Apple (50%+ of initial capacity), Nvidia, AMD, Qualcomm, MediaTek
- Nvidia overtaking Apple as largest customer in 2026, reflecting the magnitude of AI infrastructure spending
- 28% dividend increase announced February 2026 — management confidence in earnings trajectory
- Wafer price increases: 3-10% across nodes for 2026; four consecutive years of price hikes confirmed
- U.S. tariff exemption secured via $165B Arizona investment commitment
- Big Tech AI capex at $720B in 2026 — TSMC collects revenue on virtually every dollar
Analyst Consensus: Strong Buy | Average Price Target: $424–$431 (~25-31% upside from current $329; range of $351–$520 across analysts)
🗓️ Upcoming Catalysts
| Date | Event | Significance |
|---|---|---|
| ~Apr 10, 2026 | March 2026 monthly revenue report | Demand pulse check before earnings |
| Apr 16, 2026 | Q1 2026 Earnings | Primary near-term catalyst — guided $34.6B–$35.8B revenue (+38% YoY), 63-65% gross margin |
| Q3 2026 | Arizona Fab 2 equipment installation begins | Signals accelerated U.S. production timeline |
| H2 2026 | N2P enhanced node volume production | Apple reportedly leading the ramp |
| H2 2026 | A16 (1.6nm) production readiness | First "Angstrom-class" node with backside power delivery |
| Late 2026 | CoWoS capacity to 130K wafers/month | Nvidia has secured 60%+ of 2026 output |
The most important upcoming event is Q1 2026 earnings on April 16. TSMC guided $34.6B–$35.8B revenue with 63-65% gross margin — both would be records. January-February 2026 monthly revenue data showed +29.9% YoY combined, running slightly below the 33% consensus Q1 estimate, but within normal monthly variance. How management characterizes 2nm demand, CoWoS utilization, and AI customer order visibility will set the tone for the next leg of the trade.
💡 Three Trading Ideas
Important disclosure: Options trading involves substantial risk and may not be suitable for all investors. The following are analytical frameworks, not personalized investment advice. All strategies carry risk of total loss of premium paid.
Idea 1: Long Call Spread into Q1 Earnings (Defined Risk, Bullish)
View: TSM holds $330 GEX support and rallies toward the $355–$370 resistance cluster into April 16 earnings.
Structure: Buy the Apr 17 $335 call / Sell the Apr 17 $360 call
- Defined maximum risk (debit paid)
- Benefits from directional move with reduced vega exposure vs. outright calls
- The $335/$360 spread captures approximately 60% of the implied monthly move on the upside
- Breakeven at approximately $335 + net debit paid
Key levels to watch:
- Support: $330 (must hold — 77.3B GEX anchor)
- Resistance: $340 (23.9B), $350 (16.2B), $360 (19.1B)
Risk: Loses full debit if TSM trades below $335 at Apr 17 expiry. The monthly implied move of ±8.27% means the stock could trade anywhere from $301 to $356 and still be "within expectations."
Idea 2: Cash-Secured Put at $310 Support (Income, Neutral-to-Bullish)
View: TSM consolidates above the $310–$320 GEX support band through April expiry.
Structure: Sell Apr 17 $310 put, cash-secured
- Collects premium as income if TSM stays above $310
- $310 carries 7.4B in GEX support; $312.50 adds another 6.8B — meaningful dealer hedging support
- Effective purchase price if assigned: $310 minus premium received
- Annualized yield can be meaningful for large accounts
Key context: The monthly implied move puts the downside range at $301.80. A $310 short put sits inside that range, so assignment is a realistic scenario — not a tail risk. Size accordingly.
Risk: If TSM breaks sharply below $310 on geopolitical news or an earnings miss, losses extend below the put strike. Maximum loss is strike price minus premium ($310 minus credit, or effective cost basis on assignment).
Idea 3: Long LEAPS Call for AI Infrastructure Exposure (Directional, Longer Horizon)
View: TSMC's structural position as the exclusive manufacturer of the world's most advanced chips creates multi-year earnings visibility that the current $329 price undervalues.
Structure: Buy Jan 2027 $360 call
- Leaps provide time for the thesis to develop — removes the noise of short-term GEX dynamics
- ±30.19% yearly implied move puts upside range at $428 (above $360 strike)
- Consensus analyst target of $424–$431 aligns with this level
- Captures potential appreciation without full capital commitment of stock ownership
Key catalysts that could drive appreciation: Q1 earnings beat (April 16), A16 node production announcement (H2 2026), continued CoWoS ramp confirmation, Nvidia/Apple order book updates.
Risk: Full loss of premium paid if TSM trades below $360 through January 2027. Vega risk — if implied volatility compresses after earnings, option value decreases even if the stock moves higher. Long-dated options carry significant time decay in the final months.
⚠️ Risk Factors
Geopolitical — The Non-Diversifiable Tail Risk Beijing has identified Taiwan tensions as its #1 external security concern for 2026. More than 80% of TSMC's production capacity remains in Taiwan despite diversification efforts. An acute escalation scenario would be immediately and severely negative for TSM regardless of fundamental business performance. This risk does not appear in any option pricing model.
AI Capex Deceleration TSMC's growth rate is pricing in a sustained $720B+ annual AI infrastructure spending environment. Any material slowdown in hyperscaler capex commitments — whether from macro conditions, regulatory action, or a reset in AI monetization expectations — would compress revenue growth forecasts and multiple. Bloomberg noted Jan-Feb 2026 combined revenue (+29.9% YoY) was running slightly below the 33% Q1 consensus.
Tariff Policy Uncertainty The current exemption framework is tied to investment commitments and political goodwill. Policy reversals or renegotiations could disrupt the cost structure, particularly for chips imported to U.S. customers. After 2032, TSMC may lack sufficient U.S. capacity to maintain full coverage.
Margin Pressure from Overseas Fabs U.S. manufacturing costs run 30-50% above Taiwan. Rising effective tax rate (17-18% vs. historical ~15%) and record capex ($52-56B in 2026) weigh on free cash flow generation even as revenue grows strongly.
Execution Risk TSMC has warned Nvidia and Broadcom of capacity constraints at advanced nodes — a near-term positive on pricing power, but a risk if yield issues or equipment delays limit the ramp. Arizona Fab 1 already encountered construction and cultural challenges (now resolved).
🔑 Key Takeaways
-
This was a $50.2M position management event, not a directional trade. The simultaneous BUY of both a deep ITM call and an OTM put at the same strike/expiry/size is the signature of an institutional synthetic long unwind — not a speculative bet.
-
TSM is anchored to $330 by 77.3B in gamma exposure — the dominant structural feature in the current options market. Until that level breaks definitively, price will tend to oscillate around it.
-
Weekly implied move (±4.07%) defines the near-term range at $315.61–$342.39. The $300 strike that just closed sits well outside this range, consistent with how the original synthetic was likely sized — as a defined-risk structure with a floor comfortably below normal market noise.
-
The fundamental setup remains strong — Q1 earnings on April 16 arrive with 63-65% gross margin guidance and +38% YoY revenue growth, against a backdrop of fully-booked 2nm capacity, CoWoS quadrupling, and Nvidia displacing Apple as the largest customer.
-
The geopolitical risk is real and binary — it should inform position sizing on any TSM exposure, regardless of the strength of the fundamental thesis.
Analysis generated March 20, 2026. Options trading involves substantial risk of loss. This analysis is for informational purposes only and does not constitute investment advice. Past unusual options activity does not guarantee future price movements.