🏦 XLF Dueling Put Strategies - $9.9M in Institutional Hedging Ahead of Fed Chair Transition!
February 5, 2026 | Unusual Activity Detected
🎯 The Quick Take
Two BIG money moves on XLF puts this morning totaling $9.9 MILLION - but they're going OPPOSITE directions! One institution sold $7.2M worth of June $53 puts (bullish bet collecting premium), while another bought $2.7M of May $52 puts (bearish protection). With Jerome Powell's term expiring in May and Kevin Warsh awaiting Senate confirmation, smart money is positioning for VOLATILITY in financials - the question is which direction!
📊 ETF Overview
Financial Select Sector SPDR Fund (XLF) is the go-to ETF for exposure to America's largest financial institutions:
- AUM: $55.15B
- Expense Ratio: 0.08% (dirt cheap!)
- Current Price: $53.74
- 52-Week Range: $42.21 - $56.52
- Dividend Yield: 1.31%
- P/E Ratio: 18.43
Top Holdings:
| Holding | Weight |
|---|---|
| Berkshire Hathaway (BRK.B) | 11.55% |
| JPMorgan Chase (JPM) | 10.84% |
| Visa (V) | 7.28% |
| Mastercard (MA) | 5.89% |
| Bank of America (BAC) | 4.69% |
Source: Stock Analysis, February 2026
💰 The Option Flow Breakdown
📊 What Just Happened
The Tape (February 5, 2026):
| Time | Symbol | Buy/Sell | Call/Put | Expiration | Premium | Strike | Volume | OI | Size | Spot | Option Price | Option Chart |
|---|---|---|---|---|---|---|---|---|---|---|---|---|
| 09:35:20 | XLF | SELL | PUT | 2026-06-18 | $7.2M | $53 | 40,000 | 45,000 | 40,000 | $53.74 | $1.81 | Chart |
| 10:00:43 | XLF | BUY | PUT | 2026-05-15 | $2.7M | $52 | 20,000 | 12,000 | 20,000 | $53.67 | $1.37 | Chart |
🤓 What This Actually Means
We've got a tale of TWO institutions with VERY different views on financials!
Trade #1: The Premium Collector (BULLISH) - $7.2M
- 🏦 Strategy Detected: Short Put (STO - Sell to Open)
- 📝 Sold 40,000 contracts of $53 June puts
- 💰 Collected: $7.2M in premium ($1.81 per contract)
- 📊 Z-Score: 10.19 (EXTREMELY UNUSUAL - happens maybe a few times a year!)
- 🎯 Thesis: XLF stays above $53 through June, they pocket all that premium
- ⚠️ Risk: If XLF crashes below $53, they're obligated to buy 4 million shares at $53
- 📈 Breakeven: $51.19 ($53 strike - $1.81 premium)
- 🤝 What they're really saying: "I'm SO confident financials stay strong that I'll bet $212M on it" (40,000 contracts = 4M shares x $53 = $212M notional exposure)
Trade #2: The Hedger (BEARISH/PROTECTIVE) - $2.7M
- 🛡️ Strategy Detected: Long Put (BTO - Buy to Open)
- 📝 Bought 20,000 contracts of $52 May puts
- 💸 Paid: $2.7M in premium ($1.37 per contract)
- 📊 Z-Score: 12.96 (EXTREMELY UNUSUAL - even rarer than trade #1!)
- 🎯 Thesis: Protecting against downside risk through Fed Chair transition
- ⏰ Timing: May expiration captures Powell's term expiration and potential Warsh confirmation volatility
- 📉 Breakeven: $50.63 ($52 strike - $1.37 premium)
- 🤝 What they're really saying: "I own a ton of financials and I'm willing to pay $2.7M for insurance through this uncertain period"
The Big Picture: These aren't random retail traders - combined $9.9M in premium with a combined Z-score signaling activity that happens only a handful of times per year. The SHORT put is betting on strong bank earnings momentum continuing, while the LONG put is hedging against Fed policy uncertainty. Both are rational given the current backdrop!
📈 Technical Setup / Chart Check-Up
YTD Performance Chart
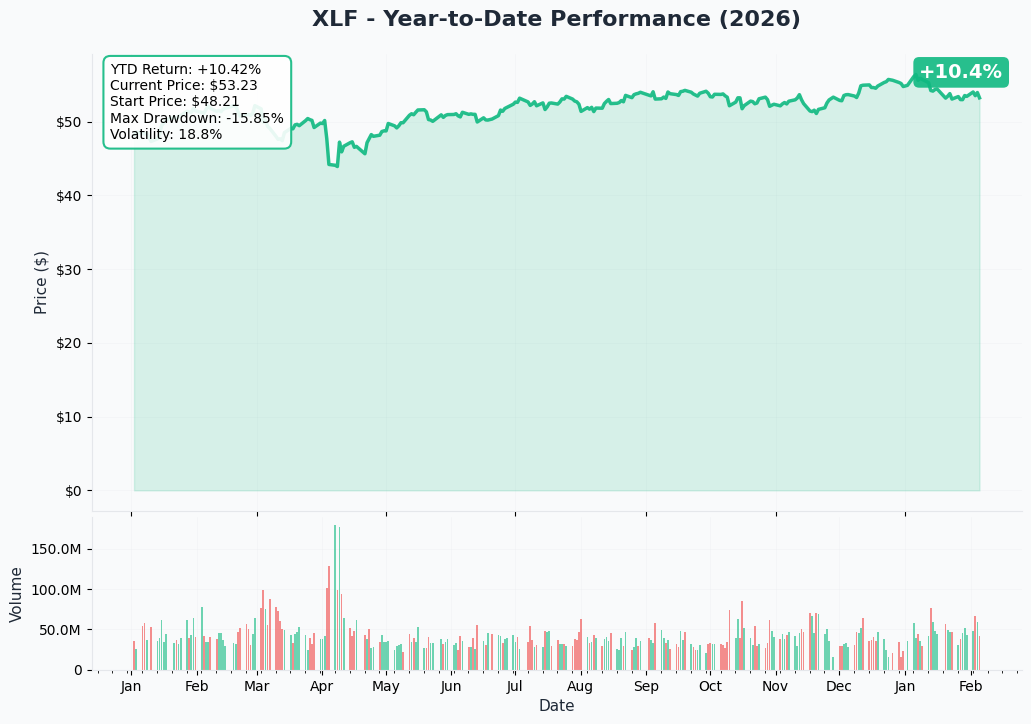
XLF is having a solid 2026 - up +10.42% YTD from $48.21 to $53.23. After a rough April selloff (max drawdown of -15.85%), the ETF has been grinding higher, benefiting from strong Q4 2025 bank earnings and regulatory tailwinds under the new administration.
Key observations:
- 📈 Recovery mode: Bounced 25%+ off the April lows near $44
- 🎢 Volatility: 18.8% annualized - relatively calm for financials
- 💪 Support confirmed: Multiple tests of $52-53 area have held
- 📊 Volume patterns: Heavy institutional activity during January earnings season
- ⚠️ Below 52-week high: Still 6% below the $56.52 peak - room to run or distribution?
Gamma-Based Support & Resistance Analysis
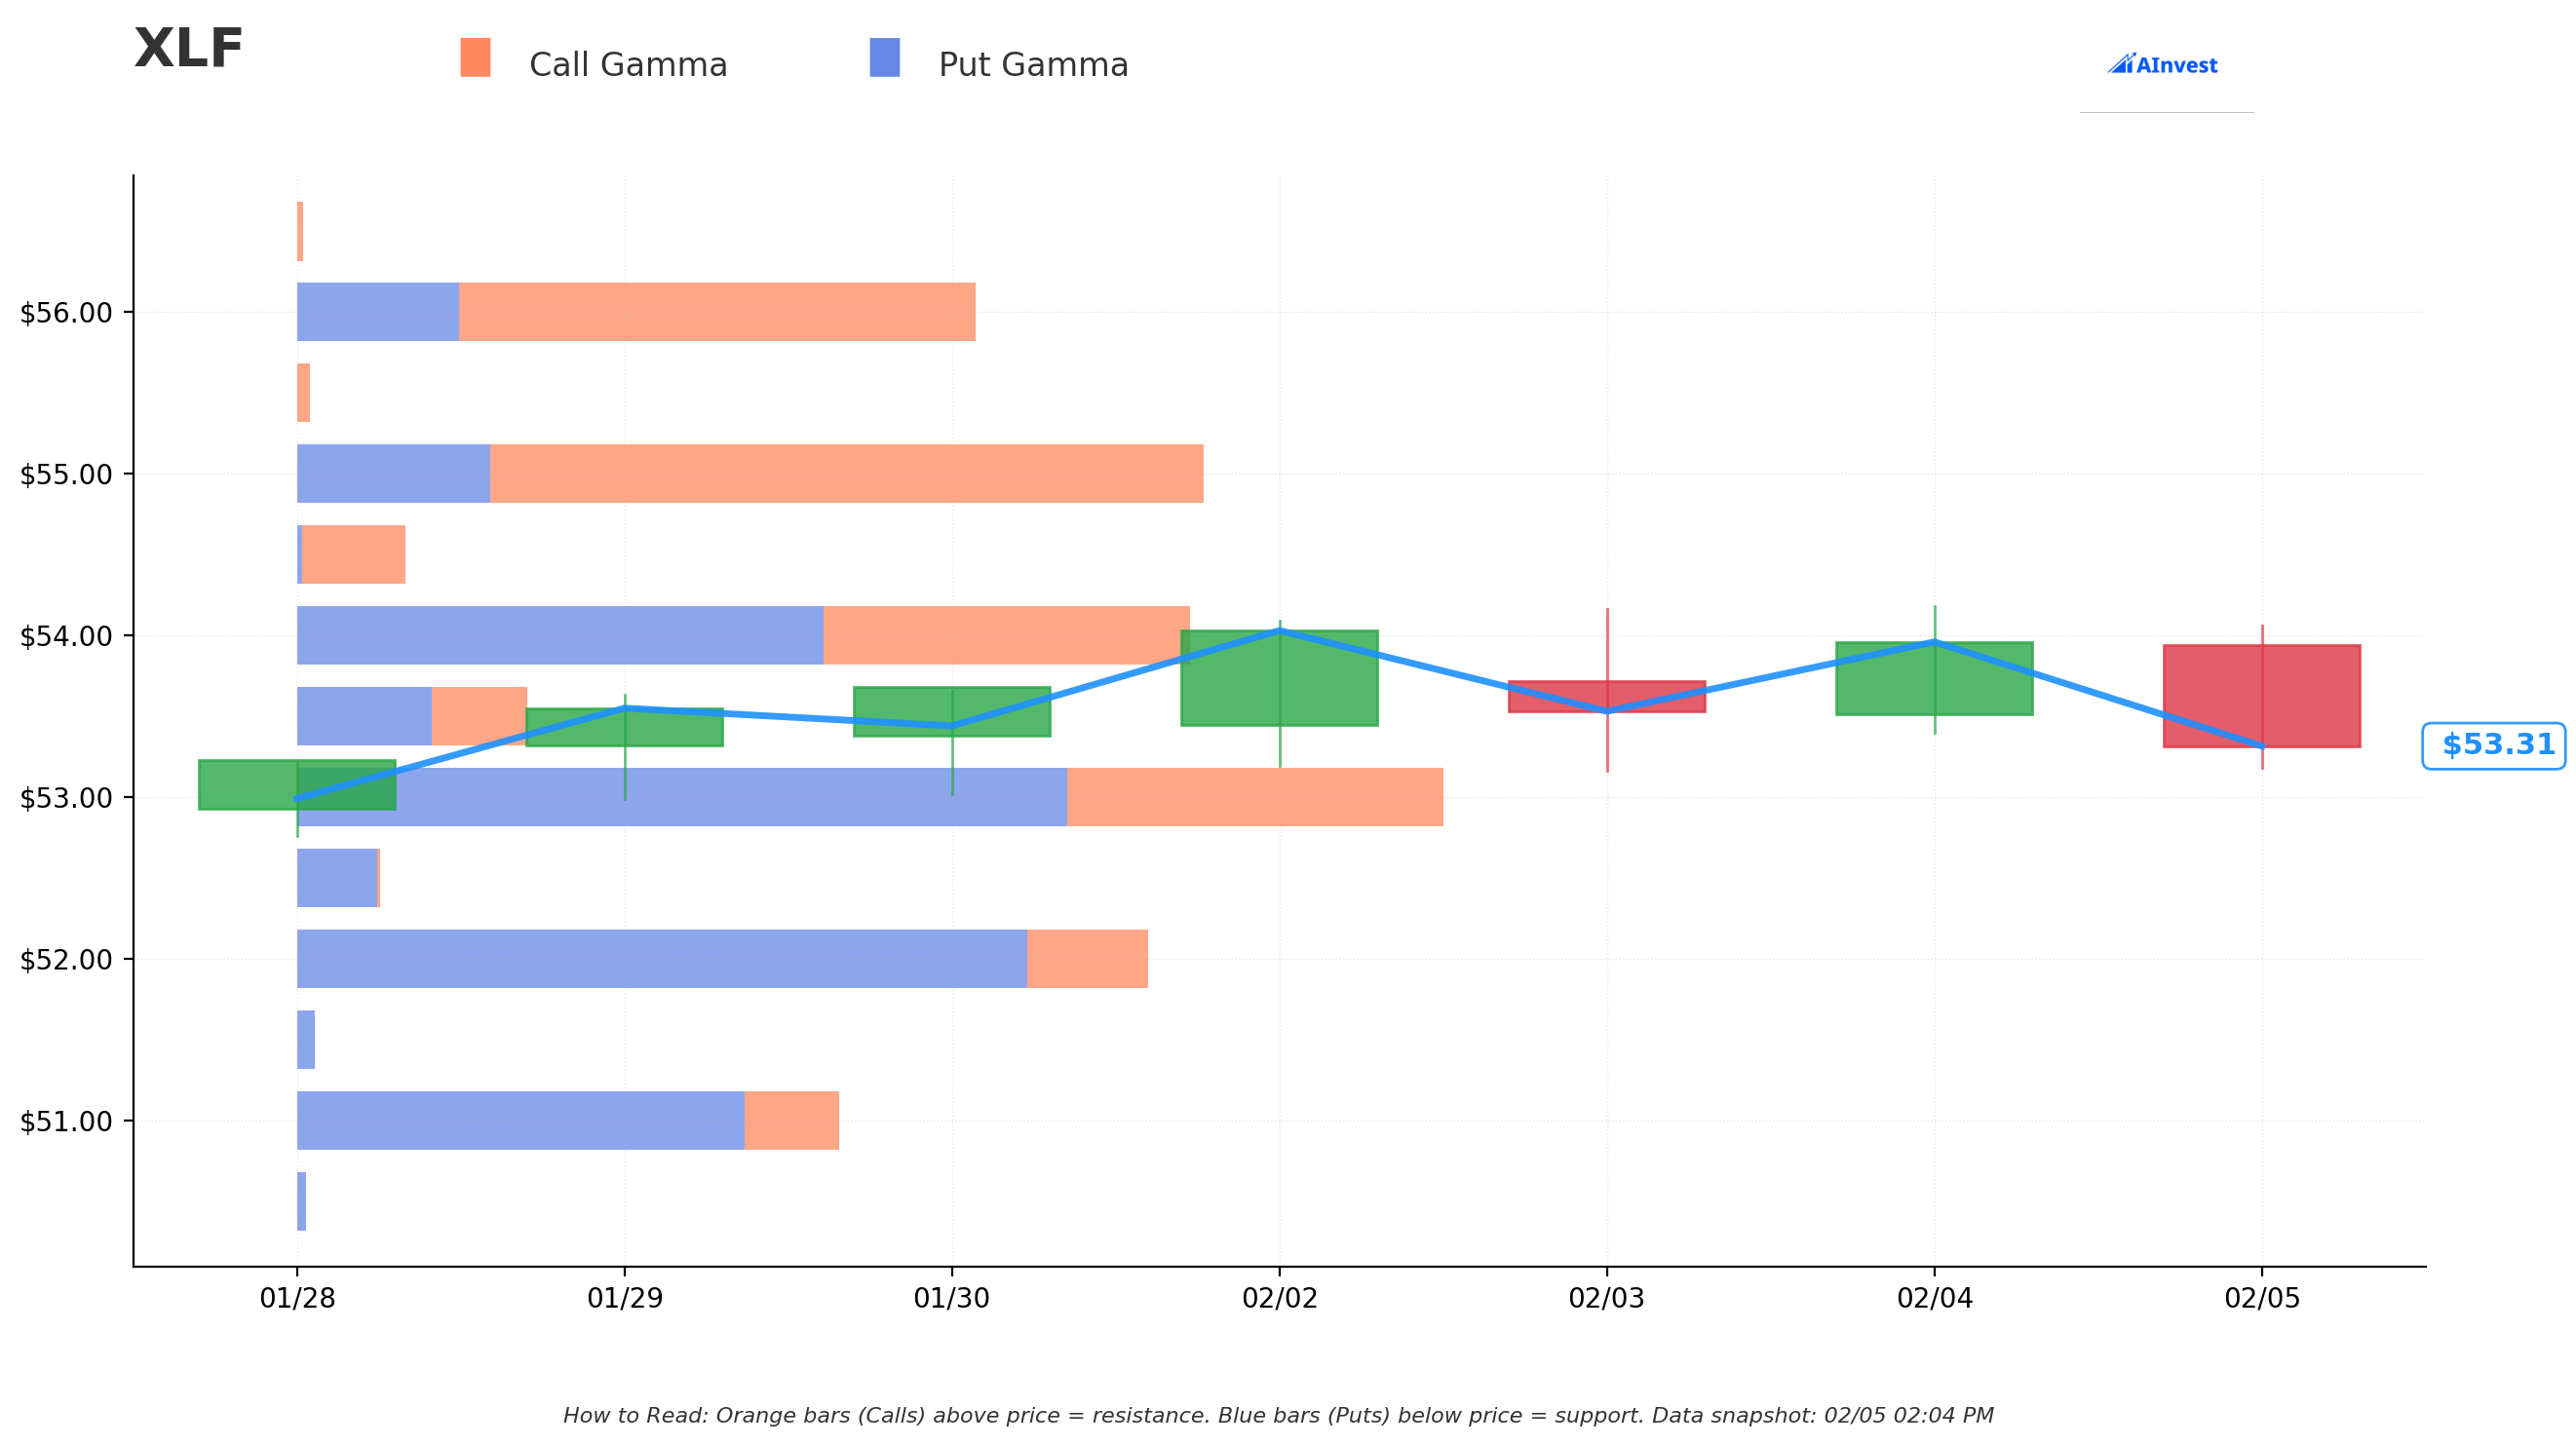
Current Price: $53.31
The gamma exposure map reveals where market makers are positioned and where price is likely to gravitate:
🔵 Support Levels (Put Gamma Below Price):
- $53 - Immediate support with massive gamma (0.6% below current) - THIS IS WHERE THE SHORT PUT WAS STRUCK!
- $52 - Secondary support with 119M put gamma (2.5% below) - THE LONG PUT STRIKE!
- $51 - Structural floor with 73M put gamma (4.4% below)
- $50 - Major support zone with 88M put gamma (6.2% below)
- $48 - Deep support (10% below) - disaster scenario level
🟠 Resistance Levels (Call Gamma Above Price):
- $54 - Immediate ceiling with 59M call gamma (1.3% above)
- $55 - Major resistance with 115M call gamma (3.1% above) - STRONGEST LEVEL!
- $56 - Extended target with 83M call gamma (5% above)
- $57 - Breakout territory with 54M call gamma (6.9% above)
What this means for traders: XLF is trading RIGHT in the thick of major gamma levels. The $53-$54 range shows balanced call/put gamma, creating a natural consolidation zone. Notice how both institutional trades targeted the $52-$53 support zone - they're playing the same gamma levels from opposite directions!
Net GEX Bias: Slightly Bearish (573M call gamma vs 743M put gamma) - dealers are positioned more defensively, which could amplify downside moves if support breaks.
Implied Move Analysis
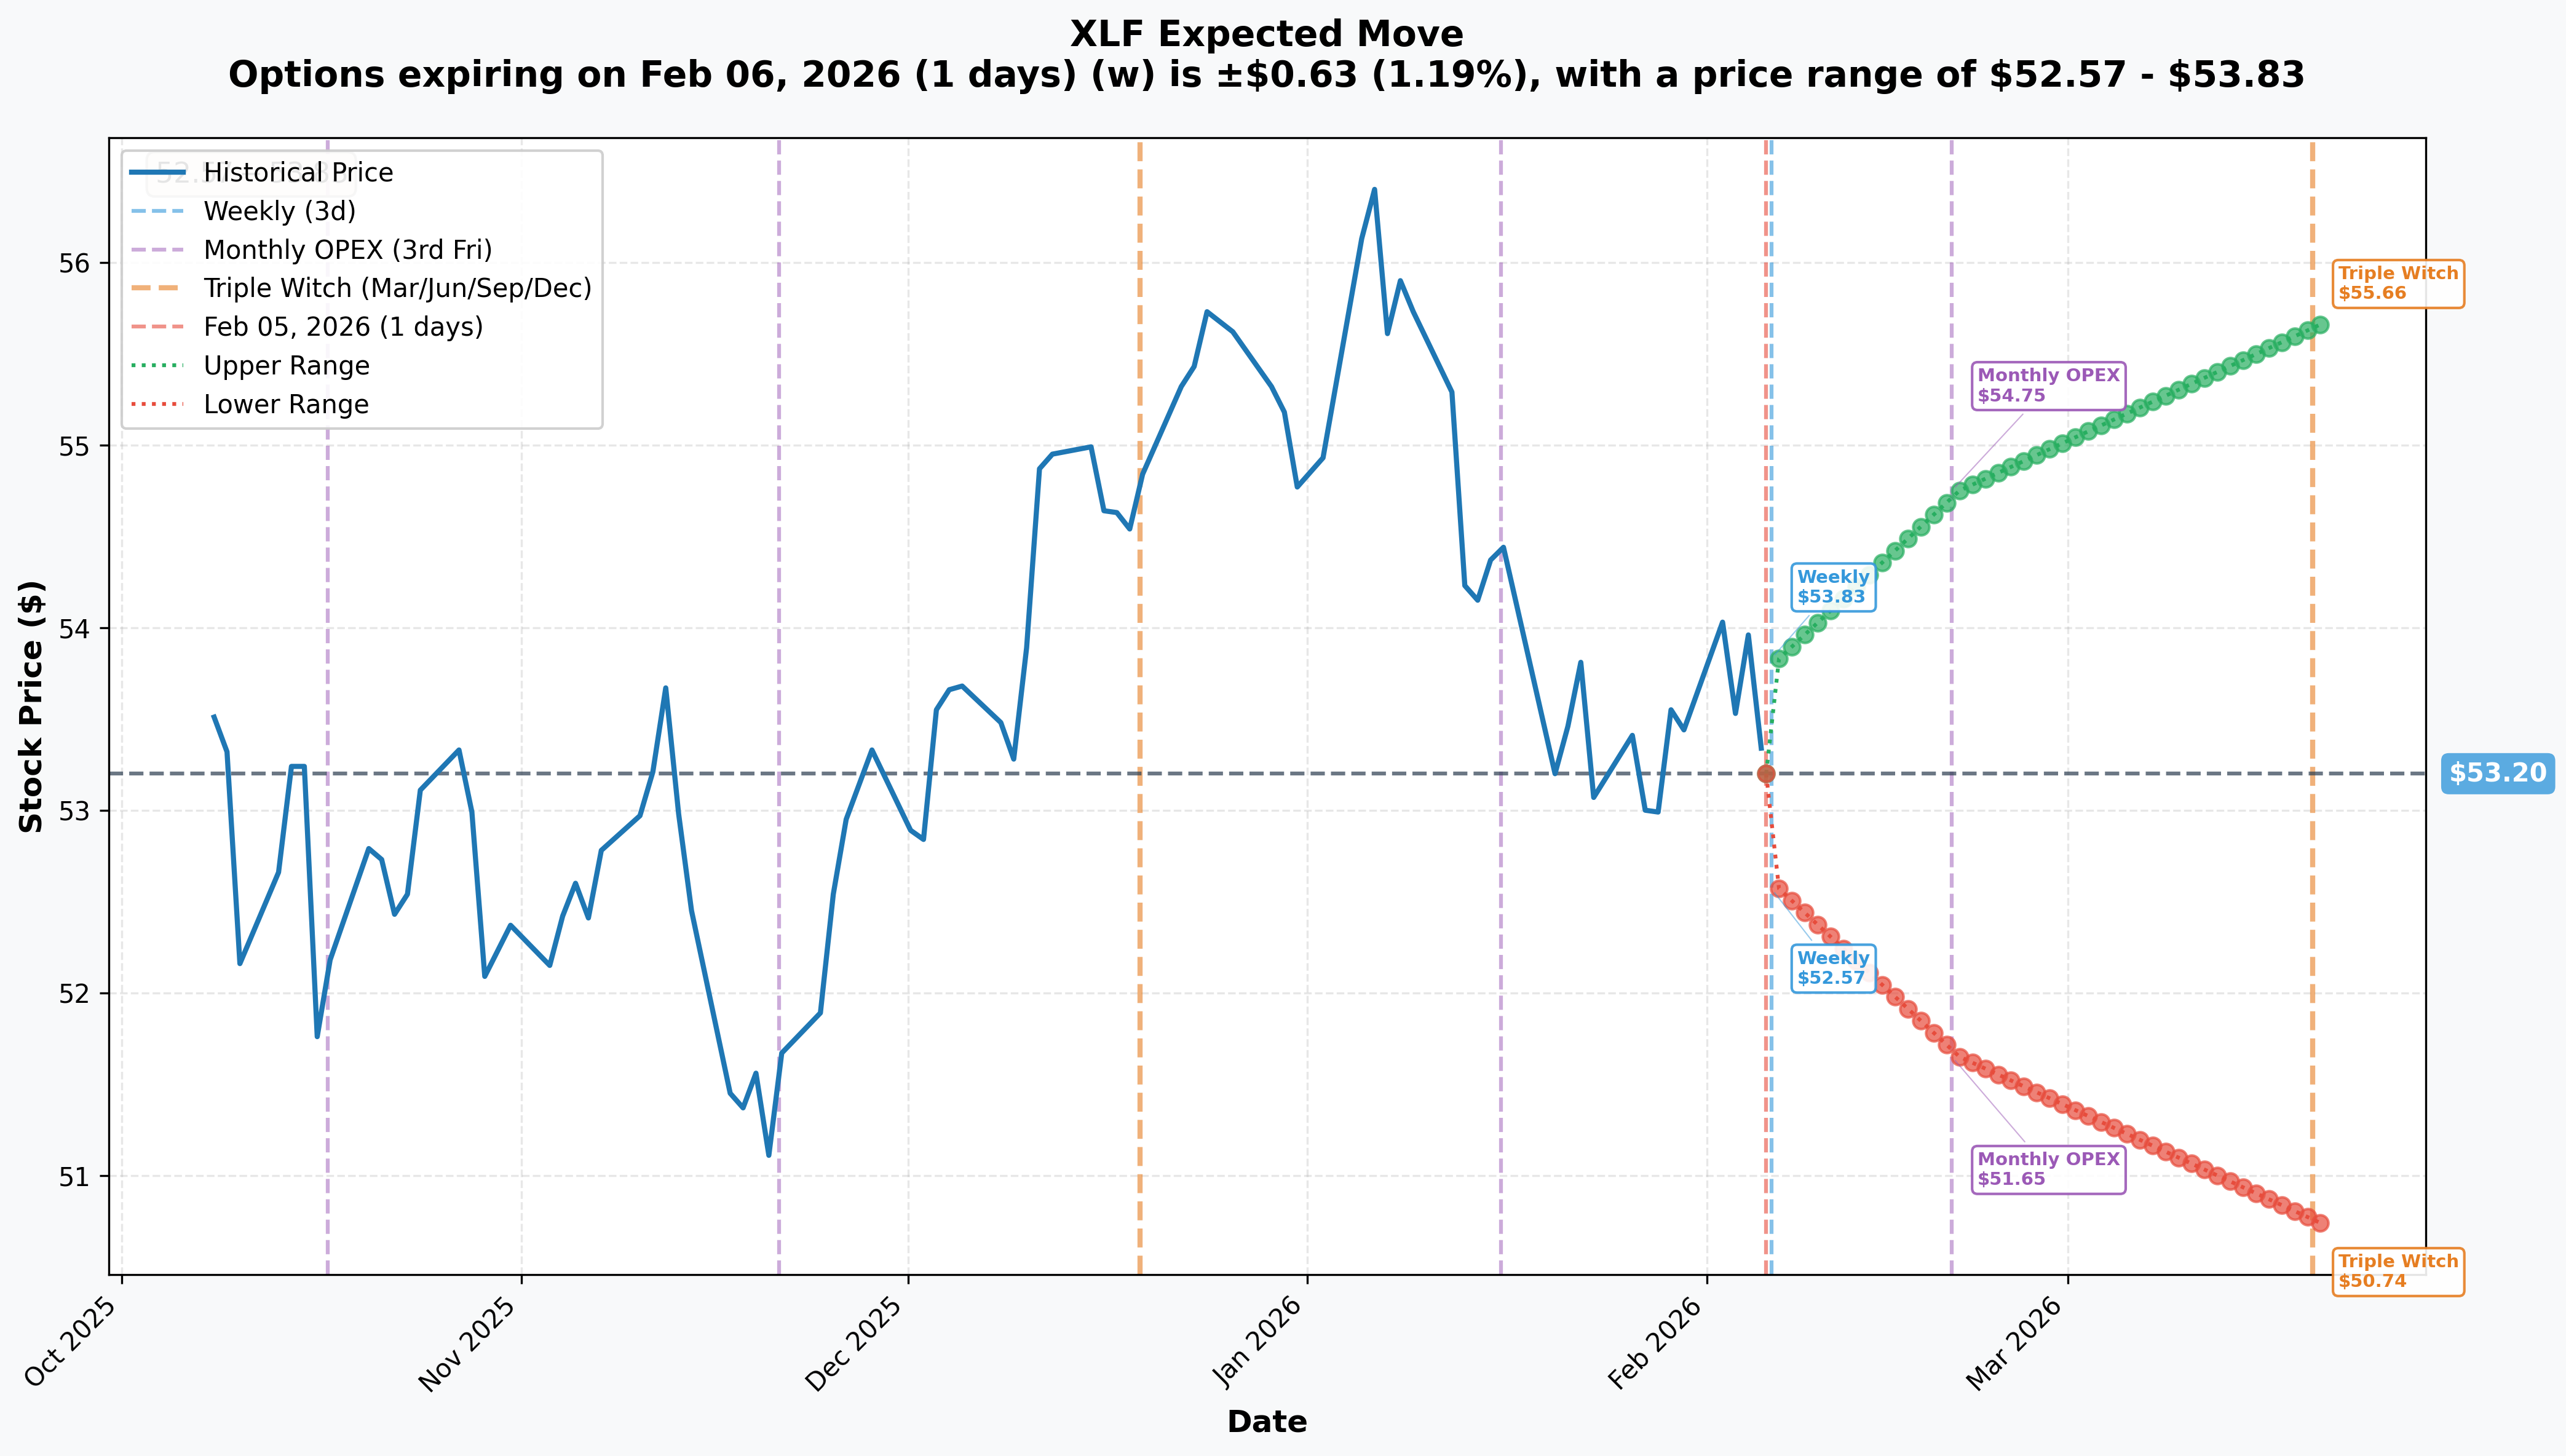
Options market pricing for upcoming expirations:
| Timeframe | Expiry Date | Days | Implied Move | Upper Range | Lower Range |
|---|---|---|---|---|---|
| Weekly | Feb 6, 2026 | 1 | ±1.19% ($0.63) | $53.83 | $52.57 |
| Monthly OPEX | Feb 20, 2026 | 15 | ±2.92% ($1.55) | $54.75 | $51.65 |
| Triple Witch | Mar 20, 2026 | 43 | ±4.62% ($2.46) | $55.66 | $50.74 |
Translation for regular folks: Options traders expect XLF to stay within a relatively tight range near-term - just ±1.2% through this week and ±3% through February OPEX. But that Triple Witch in March shows a wider ±4.6% expected move, capturing the March 17-18 FOMC meeting with economic projections. The market is pricing in more uncertainty as we get closer to Fed Chair transition.
Key insight: Both trades' expirations (May and June) are BEYOND the current implied move calculations, suggesting the traders are positioning for events the options market isn't fully pricing yet - namely the May 2026 Powell term expiration and potential policy shifts.
🎪 Catalysts
🔥 Recent Catalysts (Past 3 Months)
Q4 2025 Bank Earnings Blowout (January 2026)
The big banks CRUSHED IT this earnings season:
- 🏦 JPMorgan (JPM): $57B full-year net income, record payments revenue of $5.1B
- 🏦 Bank of America (BAC): $0.98 EPS beat, CEO Moynihan "bullish on 2026 economy"
- 🏦 Goldman Sachs (GS): $14.01 EPS crushing estimates, equities trading surged
- 🏦 Morgan Stanley (MS): Dealmaking revenue up 47%, $2.68 EPS beat
- 💳 Visa (V): $3.17 EPS, payments volume up 9%
- 💳 Mastercard (MA): $4.76 EPS (12% beat!), cross-border volume up 14%
Federal Reserve Policy (January 2026)
- ⏸️ Rate Hold: Fed held rates at 3.50-3.75% on January 28, pausing after three consecutive cuts in 2025
- 📝 Inflation Warning: Statement noted inflation remains "somewhat elevated"
- 🦅 Dissent: Governors Miran and Waller pushed for another 25bp cut
Regulatory Tailwinds
- ✅ Wells Fargo Unchained: Fed lifted the $1.95T asset cap after 7 years in June 2025
- 📋 Fair Banking Order: Trump issued executive order on debanking practices
- 🏛️ Basel III Softening: Regulators signaling capital-neutral approach vs Biden-era proposal
📅 Upcoming Catalysts (Next 6 Months)
The BIG ONE: Fed Chair Transition
- 🦅 Kevin Warsh Nominated: Trump nominated inflation hawk Warsh on January 30
- ⏰ Powell's Term Expires: May 2026
- 🚧 Confirmation Uncertainty: Sen. Tillis blocking until DOJ probe resolved
- 📈 Policy Implications: Warsh known as inflation hawk, served 2006-2011
FOMC Meeting Schedule
| Date | Notes |
|---|---|
| March 17-18, 2026 | Summary of Economic Projections included |
| April 28-29, 2026 | Standard meeting |
| June 16-17, 2026 | Summary of Economic Projections included |
Q1 2026 Bank Earnings
| Company | Expected Date |
|---|---|
| JPMorgan Chase (JPM) | April 14, 2026 |
| Wells Fargo (WFC) | April 14, 2026 |
| Bank of America (BAC) | Mid-April 2026 |
| Goldman Sachs (GS) | Mid-April 2026 |
Key Data Releases
- 📊 January CPI: February 11, 2026 (inflation watch continues)
- 📝 Basel III Endgame: Final rule expected 2026, implementation 2027
- 💰 Stablecoin Regulation: GENIUS Act requires banking agencies to adopt rules by July 18, 2026
🎲 Price Targets & Probabilities
Using gamma levels, implied move data, and the catalyst calendar, here are the scenarios through the June expiration:
📈 Bull Case (35% probability)
Target: $56-$58
How we get there:
- 💪 Q1 2026 earnings continue the momentum with NII expansion from steeper yield curve
- 🦅 Warsh confirmed smoothly, signals gradual rate normalization to 3.00-3.25%
- 🏛️ Basel III finalized as capital-neutral, banks announce buybacks
- 📈 M&A activity accelerates on regulatory clarity
- 💳 Consumer spending remains resilient, payment volumes grow 10%+
- 📊 Breakout above $55 gamma resistance triggers momentum to $56-58
The Short Put Wins Big: If this plays out, the $53 short puts expire worthless and the trader pockets the full $7.2M premium. Sweet deal!
🎯 Base Case (45% probability)
Target: $52-$55 range (CONSOLIDATION)
Most likely scenario:
- ✅ Bank earnings solid but not spectacular - guidance cautious on macro uncertainty
- ⚖️ Fed stays on hold through June, inflation remains "somewhat elevated"
- 🤔 Warsh confirmation delayed by Senate politics, creates uncertainty
- 📊 XLF oscillates between $52 support and $55 resistance (gamma walls)
- 💤 Volatility compresses as market digests Fed Chair transition
- 🎯 Both put trades end up close to break-even or modest gains/losses
This is the "everyone's kinda right" scenario: The short put seller collects most of their premium as theta decays. The long put buyer loses their $2.7M but sleeping better at night knowing they were hedged.
📉 Bear Case (20% probability)
Target: $48-$51
What could go wrong:
- 😰 Inflation data surprises hot, Fed signals higher-for-longer rates
- 🚨 Tariff tensions escalate, credit concerns rise
- 🏛️ Warsh confirmation fails, Fed leadership vacuum creates chaos
- 📉 Consumer confidence collapses further from pandemic-era lows
- 💔 Q1 bank earnings show NIM compression, credit deterioration
- 🔨 Break below $52 triggers cascade to $50, then $48
Put Trade P&L in Bear Case:
- Long $52 May put buyer: If XLF hits $48 by May, puts worth $4.00, profit = $2.63/share x 20,000 = $5.26M gain (95% ROI!)
- Short $53 June put seller: If XLF hits $48 by June, obligated to buy at $53, loss = $5.00/share x 40,000 = $20M loss (ouch!)
💡 Trading Ideas
🛡️ Conservative: Follow the Premium Collector
Play: Sell cash-secured puts at $51-52 strike (March or April expiration)
Structure: Sell $52 puts expiring April 17, 2026
Why this works:
- 🏦 Copying institutional strategy that just deployed $7.2M
- 📊 $52 strike is 3% below current price with strong gamma support
- 💰 Collect ~$0.80-1.00 premium per contract (1.5-2% yield in 2.5 months)
- 🛡️ If assigned, buying XLF at $51-51.20 effective cost - attractive entry
- 📈 Bank earnings momentum and regulatory tailwinds support financials
- ⏰ April expiration captures Q1 earnings catalyst for potential upside
Position sizing: Only sell puts you'd be happy to get assigned on. For a $50K portfolio, that's maybe 5-10 contracts max.
Risk level: Moderate (defined risk if assigned) | Skill level: Intermediate
⚖️ Balanced: Put Spread Hedge
Play: Buy put spread for downside protection through Fed Chair transition
Structure: Buy $52 puts / Sell $50 puts (May 15 expiration)
Why this works:
- 🎯 Targets the exact zone the institutional hedger is playing
- 📊 Defined risk spread ($2 wide = $200 max risk per spread)
- 🛡️ Protects against Fed transition volatility through May
- 💰 Costs ~$0.50-0.60 net debit per spread
- 📈 Max profit $1.40-1.50 if XLF below $50 at May expiration
- ⚠️ Break-even around $51.40-51.50
When to enter: On any rally toward $54-55 resistance to get better pricing.
Risk level: Moderate (defined risk, bearish directional) | Skill level: Intermediate
🚀 Aggressive: Iron Condor - Bet on Consolidation
Play: Sell iron condor capturing the $52-$55 expected trading range
Structure:
Why this could work:
- 📊 XLF has strong gamma support at $52 and resistance at $55
- 🎢 Implied move of ±4.6% through March keeps price in range
- 💰 Collect ~$0.80-1.00 premium on ~$2 risk per side
- 📈 Probability of profit ~60-65% if XLF stays between $52-$55
- ⏰ March expiration before major Fed Chair transition chaos in May
Why this could blow up:
- 😱 Early Warsh confirmation or rejection creates vol spike
- 📉 Tariff escalation or inflation shock breaks range
- 💔 Bank earnings pre-announcements move sector
Risk level: HIGH (limited but multi-directional risk) | Skill level: Advanced
⚠️ Risk Factors
Don't get caught by these potential landmines:
-
🦅 Fed Chair Transition Chaos: Powell's term expires May 2026 and Warsh's confirmation is uncertain. A messy transition, confirmation failure, or unexpected policy signals could hammer financials 10-15% in weeks. Both put trades expire DURING this transition window.
-
📈 Inflation Persistence: December 2025 CPI at 2.7% remains above the 2% target. If inflation sticks at 2.5-3% through 2026, the Fed can't cut rates as expected, compressing bank NIMs and sentiment. January CPI on February 11 is the next key data point.
-
🌍 Tariff-Driven Credit Risk: Trade tensions are creating credit concerns and consumer sentiment has collapsed to pandemic-era lows. If tariffs escalate, banks could face loan losses and payment volumes could decline - hitting XLF's top holdings hard.
-
📊 YTD Disconnect: Despite strong Q4 earnings, XLF actually underperformed early 2026 before recovering. This gap between fundamentals and price action suggests investors remain skeptical - smart money may be selling into strength.
-
🏛️ Regulatory Whiplash: While Basel III is softening and merger guidelines relaxed, the GENIUS Act stablecoin deadline (July 2026) could create compliance burden. Policy reversals under a new Fed Chair add uncertainty.
-
💰 Short Put Assignment Risk: The $7.2M short put seller is obligated to buy 4 million shares at $53 if XLF drops below that level. That's $212M in potential exposure - if XLF crashes to $48, they're looking at $20M+ in losses. Premium collection strategies can blow up spectacularly in tail events.
🎯 The Bottom Line
Real talk: We're seeing institutional traders taking OPPOSITE sides of the same trade - and both make sense given the current environment!
The Dueling Thesis:
The short put seller ($7.2M) is betting that:
- Strong bank earnings momentum continues
- Regulatory tailwinds persist
- XLF stays above $53 through June
- Fed Chair transition is orderly
The long put buyer ($2.7M) is betting that:
- Fed leadership uncertainty creates volatility
- Downside protection is worth the premium cost
- Better to be hedged and wrong than unhedged and sorry
What should YOU do?
If you own financials:
- ✅ The long put buyer's approach makes sense - consider adding some downside protection through May
- 📊 Watch the $52-53 support zone carefully - both institutions are focused here
- ⏰ Mark your calendar for April bank earnings and May Powell term expiration
If you're looking to add exposure:
- 🎯 The short put strategy at $51-52 offers attractive entry if assigned
- 📈 Wait for pullbacks to gamma support zones rather than chasing
- 💰 Dividend yield of 1.31% provides some cushion
If you're bearish:
- 🛡️ Put spreads offer defined-risk way to play downside
- ⏰ Time entries around FOMC meetings and CPI releases
- 📊 $52 is the key level to watch - break below and momentum shifts bearish
Mark your calendar - Key dates:
- 📅 February 11 - January CPI release
- 📅 March 17-18 - FOMC meeting with economic projections
- 📅 March 20 - Triple Witch OPEX (±4.6% implied move)
- 📅 April 14 - JPM and WFC Q1 earnings
- 📅 May 2026 - Powell term expires, Warsh potentially assumes Chair
- 📅 May 15 - Long put expiration
- 📅 June 16-17 - FOMC meeting with economic projections
- 📅 June 18 - Short put expiration
Final verdict: XLF sits at an interesting inflection point with strong fundamentals (bank earnings, regulatory tailwinds) but significant uncertainty ahead (Fed Chair transition, inflation, tariffs). The smart money is positioning for both outcomes - bullish premium collection AND defensive hedging. For most retail traders, the balanced approach makes sense: maintain core financial exposure but add some downside protection through the May transition period. The $52-53 support zone is your line in the sand.
The financial sector's 2026 story is still being written - make sure you're positioned to profit from it either way! 💪
Disclaimer: Options trading involves substantial risk of loss and is not suitable for all investors. This analysis is for educational purposes only and not financial advice. Past performance doesn't guarantee future results. The Z-scores of 10.19 and 12.96 indicate these are among the largest XLF put trades this year - extremely unusual activity that happens only a few times annually. Always do your own research and consider consulting a licensed financial advisor before trading. Fed policy changes and economic data can create sudden, sharp moves in financial sector ETFs.
About Financial Select Sector SPDR Fund (XLF): XLF tracks the Financial Select Sector Index, providing exposure to U.S. financial companies including banks, insurance companies, and diversified financial services firms, with $55.15B in assets under management and a 0.08% expense ratio.