😰 XLF $4.8M LEAP Put - Someone Just Bet Against Banks for the Next 2.7 YEARS!
📅 March 17, 2026 | 🔥 Unusual Activity Detected
🎯 The Quick Take
Someone just dropped $4.8 MILLION on a 2.7-year LEAP put on the Financial Select Sector SPDR ETF (XLF), betting that US financials are below $45 by December 2028. The open interest on this option was just 4 contracts before this trade - meaning this is essentially a brand-new position being opened right now. Translation: This is one of the longest-dated bearish bets we've seen on the financial sector, placed at 3:08 PM today with near-zero prior interest - this trader is starting something completely fresh.
📊 ETF Overview
Financial Select Sector SPDR Fund (XLF) is the dominant financial sector ETF tracking the S&P 500 Financial Sector:
- Current Price: $49.65
- Day Range: $49.21 - $49.51
- YTD Performance: ~-10% from January highs of $55-$56
- Forward P/E: 11.47x vs S&P 500 at 20.01x (a 43% discount)
- Projected Sector EPS Growth: 9.80%
- Concentration: Berkshire Hathaway and JPMorgan Chase = ~25% of total assets
- Key Holdings: BRK.B, JPM, BAC, WFC, GS, MS, C, AXP, SPGI
💰 The Option Flow Breakdown
The Tape (March 17, 2026 @ 15:08:33):
| Time | Symbol | Side | Buy/Sell | C/P | Expiration | Premium | Strike | Volume | OI | Size | Spot | Option Price | Option Symbol |
|---|---|---|---|---|---|---|---|---|---|---|---|---|---|
| 15:08:33 | XLF | MID | BUY | PUT | 2028-12-15 | $4.8M | $45 | 12,000 | 4 | 12,000 | $49.65 | $4.00 | XLF20281215P45 |
🤓 What This Actually Means
This is a BTO Long LEAP Put - an extraordinarily long-dated bearish position on the entire US financial sector:
- 💸 Premium paid: $4.8M ($4.00 × 12,000 contracts × 100 shares)
- 🗓️ 2.7-year duration: December 15, 2028 expiration - this is NOT a near-term trade, this is a multi-year strategic position
- 🎯 Strike at $45: Current price is $49.65, so the trader needs XLF to drop another ~9.3% from here and then hold below $45 through December 2028
- 🚨 OI of JUST 4: Before this print, only 4 contracts of this specific option existed. This person created a new market in this strike/expiry. That is rare and significant
- 📊 Execution at MID: Buying at mid-market (not at the ask) shows this trader had negotiating leverage - likely an institution getting a block fill through a broker desk
- 🐋 Single block of 12,000: This is not dripped in over time, this is one institutional decision, one moment, $4.8M committed
What's really happening here: With XLF already down ~10% from January highs and breaking critical $50.90 support in late February, this trader is not just hedging this week - they are positioning for a LONG-TERM deterioration in the financial sector. The $45 strike was the approximate support zone from mid-2025. Breaking below that level would represent a significant structural breakdown in banks.
The 2.7-year window captures: Q1-Q4 2026 bank earnings, the full Kevin Warsh Fed Chair era (May 2026 - 2028), two presidential election cycles, potential commercial real estate maturity waves, and whatever the global macro brings between now and late 2028. This person is thinking about the WHOLE picture, not just the next Fed meeting.
Unusual Score: 🔥 EXTREME - OI of 4 contracts before a 12,000-contract buy. This is literally creating new open interest from scratch. The volume-to-OI ratio of 3,000x is almost never seen. This happens maybe once or twice a year for any given strike/expiry combination.
📈 Technical Setup / Chart Check-Up
YTD Performance Chart
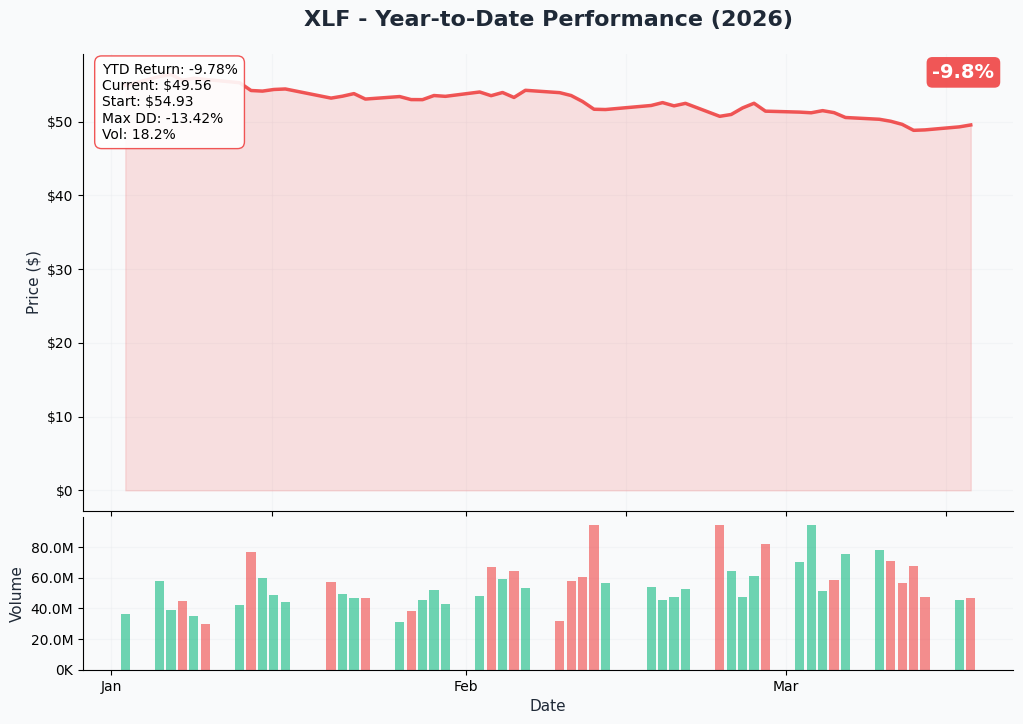
XLF is having a rough 2026. After starting the year at $55-$56 on deregulation optimism, the Iran war oil shock and break below critical $50.90 support in late February triggered a technical breakdown. The ETF is now sitting around $49.65, approximately 10% below its January highs, struggling to reclaim that critical $50.90 level.
Key observations:
- 📉 Broken support: $50.90 was the key technical level - it broke in February and has held as resistance since
- 🛡️ $49 defense: The ETF is attempting to stabilize around the $49-$50 zone
- 📊 Lower highs pattern: The attempt to recover has produced lower highs - a warning sign
- 🏦 Fundamental disconnect: With 11.47x forward P/E vs S&P's 20.01x, banks are "cheap" on paper - but technicals say sell
- ⚠️ Iran war hangover: The oil shock created credit quality concerns for bank loan portfolios that haven't fully resolved
Gamma-Based Support & Resistance Analysis
Current Price: $49.65 (GEX data at $49.59)
The gamma map for XLF reveals an overwhelmingly PUT-dominated structure - the options market is heavily positioned for downside protection:
🔵 Support Levels (Put Gamma Below Price):
- $49 - Immediate gamma support at 214.5 total GEX but with HEAVY put bias (-181.3 net) - this is the critical near-term floor
- $48 - Secondary support at 167.5 GEX with strong put bias (-155.7) - dealers will defend here
- $47 - Additional floor at 44.9 GEX with put bias (-40.9)
- $45 - Deep support at 47.3 GEX (EXACTLY where this LEAP put is struck! Not a coincidence)
🟠 Resistance Levels (Call Gamma Above Price):
- $50 - DOMINANT resistance at 441.2 total GEX (the HIGHEST SINGLE LEVEL - massive put wall here too at 340.4) - this is a ceiling AND a floor converged
- $51 - Secondary ceiling at 115.8 GEX
- $52 - Additional resistance at 132.2 GEX
- $53 - Further ceiling at 117.4 GEX
- $55 - Extended resistance at 55.7 GEX (near the old January highs)
What this means: The $50 level is the most gamma-loaded level in the entire XLF options market at 441.2 GEX. This creates a powerful magnetic force - the price is likely to gravitate toward $50 and then face MASSIVE selling pressure. Market makers holding enormous positions at $50 will systematically sell any rally that approaches that level. If XLF can't break $50, the bears have structural support for their thesis.
Note how the $45 put strike in this LEAP trade has 47.3 GEX. The buyer chose a level with existing options infrastructure - they know the market is already positioned around $45 as a reference point.
Net GEX Bias: Bearish (491 call GEX vs 1,199 put GEX) - This is SIGNIFICANT. XLF's options market is overwhelmingly put-dominated. Total put gamma is 2.4x total call gamma. This is not a bullish setup - options market participants are heavily positioned for downside.
Implied Move Analysis
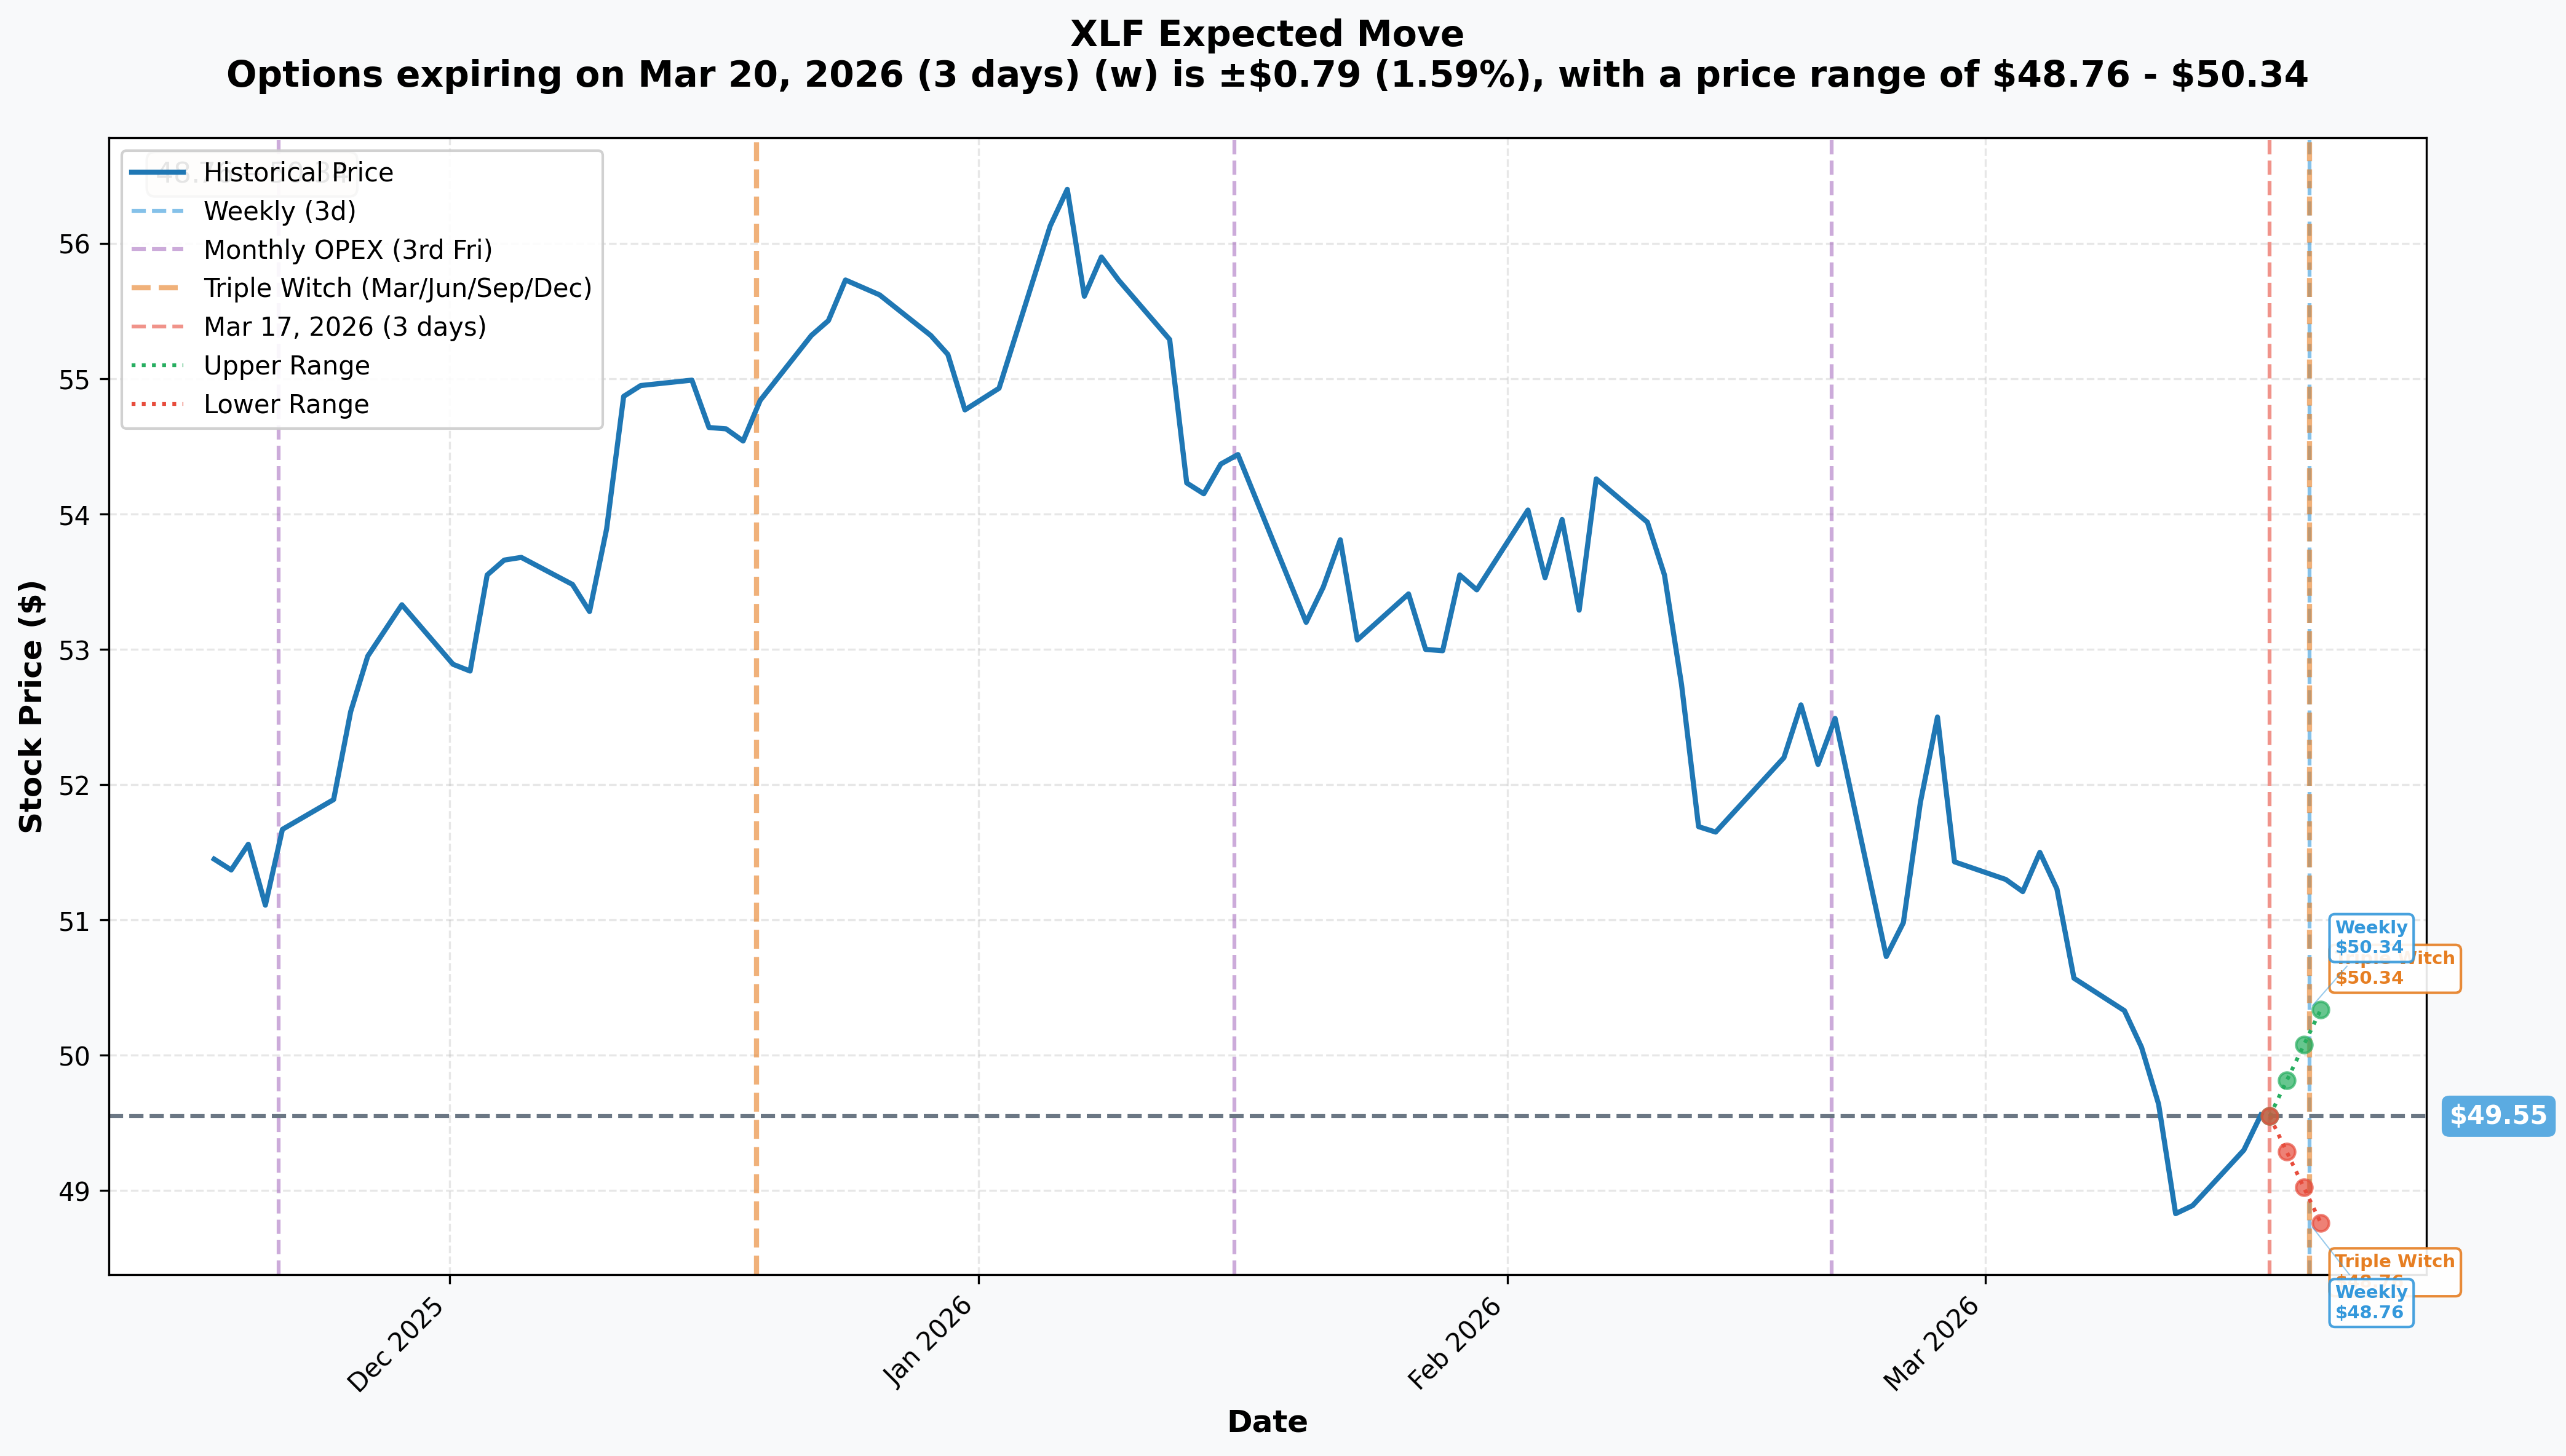
Options market pricing through the nearest expiration:
- 📅 Weekly / March OPEX / Triple Witch (March 20 - 3 days): ±$0.79 (±1.59%) → Range: $48.76 - $50.34
Translation for regular folks: The options market is pricing in a 1.59% move ($0.79) by this Friday March 20 - Triple Witch quarterly expiration. The range of $48.76 to $50.34 is remarkably tight and bracketed by key gamma levels.
Notice how the upper range ($50.34) is RIGHT at the $50 gamma monster resistance, and the lower range ($48.76) is just below the $49 gamma support. The options market is essentially saying XLF is trapped between $49 and $50.34 this week.
This is important for the LEAP put buyer: They're not expecting immediate gratification. They paid $4.00 for December 2028 puts precisely because they know the near-term story is rangebound. Their thesis plays out over quarters and years, not days. But the breakout from this $49-$50 range will define the near-term direction after FOMC tomorrow.
🎪 Catalysts
🔥 Immediate Catalysts (Next 48 Hours)
FOMC Rate Decision - March 18, 2026 (TOMORROW!) 📊
Probably the most important single event for XLF right now. The Fed is expected to hold rates at 3.50%-3.75% with 92%+ probability, but the TONE matters enormously for banks:
- 🔑 Dot Plot: Updated Summary of Economic Projections showing fewer projected cuts = yield curve FLATTER = bank NIM compression = bad for XLF
- 🛢️ Oil inflation acknowledgment: If Powell signals the Iran war oil shock could delay rate cuts, that flattens the yield curve. Banks make money on a STEEP yield curve (borrow short, lend long). Flat curve = margin squeeze
- 💬 The scenario XLF bulls need: Dovish surprise - Powell signals 2-3 cuts still coming in 2026 → yield curve steepens → bank margins improve
Triple Witch - March 20, 2026 (This Friday!) 🎪
Quarterly expiration for options, futures, and index futures simultaneously. The massive $50 gamma wall will be in full force. Watch whether XLF can clear $50 or gets beaten back.
🚀 Near-Term Catalysts (Next 60 Days)
Kevin Warsh Fed Chair Confirmation - March/April 2026 🏦
Warsh was nominated January 30, 2026 and faces Senate hearings now. His confirmation is:
- BULLISH for banks if: Warsh delivers lighter capital requirements (Basel III Endgame dilution), pro-M&A stance, and rate easing support - all direct positives for XLF holdings
- BEARISH if: Senator Tillis's vow to block all Fed nominees delays confirmation and creates policy uncertainty
- The "Warsh Shock" on aggressive balance sheet normalization was initially market-negative - further hawkish signals from him could extend XLF's decline
Q1 2026 Bank Earnings - April 2026 📊
First quarter earnings capturing the Iran war impact. Two-sided for financials:
- Positive: Trading desks LOVE volatility - Goldman's Q4 2025 equities trading surged 25% YoY. Q1 2026 with oil shock volatility could be another bonanza for capital markets
- Negative: Credit provisions for oil-exposed loans, commercial real estate concerns, and softer consumer spending could show up in provision increases
📊 Medium-Term Catalysts (Within the LEAP's 2.7-Year Lifespan)
Commercial Real Estate Maturity Wall - Ongoing 🏢
MetLife's massive commercial mortgage loan portfolio faces a maturity wall of defaults in office and retail properties. Zions Bank and Western Alliance disclosed CRE loan issues in late 2025. This is a multi-year slow-burn problem that plays directly into a 2.7-year LEAP put thesis.
OBBBA Deregulation - Ongoing Wild Card 🏛️
The OBBBA legislation (July 2025) rolled back Dodd-Frank constraints and potentially accelerated M&A approvals. This is broadly bullish for XLF - it's the strongest structural argument AGAINST this put trade.
Health Insurance Margin Compression 🏥
Health insurers expect another tough margin year in 2026. With major insurers inside XLF, repeated margin misses could weigh on XLF even as banks perform well.
Fed Rate Path 2026-2027 🏦
Goldman and Morgan Stanley project rates reaching 3.00%-3.25% by mid-2026. But if oil-driven inflation delays cuts, or Warsh's confirmation triggers a steeper path, the trajectory of rates determines bank earnings for the entire lifespan of this LEAP put.
⚠️ Past Catalysts (Already Happened)
- ✅ Q4 2025 Bank Earnings (Jan 2026): Broadly strong - JPM beat by 4.6%, GS earnings jumped 12%, BAC beat by 10.4%
- ✅ OBBBA Deregulation (July 2025): Structural positive passed - lighter capital requirements, expanded M&A
- ❗ Iran War (Feb 28+): Oil shock complicates rate cut path - direct headwind to XLF from flat curve risk
- ❗ Technical Breakdown: XLF broke below critical $50.90 support on February 24, 2026 - structural bear signal
🎲 Price Targets & Probabilities
Using gamma levels, implied move data, FOMC scenarios, and the 2.7-year timeframe:
📈 Bull Case (35% probability - Bad for the put)
Target: $54-$58
How we get there:
- 🕊️ Iran war resolves → oil normalizes → Fed can continue cutting rates → yield curve steepens → bank NIM expands
- 🏛️ Warsh confirmed smoothly, delivers lighter capital requirements and Basel III Endgame relief → bank capital freed for buybacks and dividends
- 📊 Q1 2026 bank earnings CRUSH on trading revenue from Iran war volatility → positive sentiment shock
- 💵 M&A and IPO pipeline accelerates under deregulatory regime → fee income surges for investment banks
- 📈 Break above $50 gamma resistance triggers technical chase to $51, $52, then recapture of the $54-$56 range
- 🎯 Valuation re-rating at 43% P/E discount to S&P makes financials the go-to sector rotation play
For this put trade: December 2028 $45 puts are FAR out of the money. Over 2.7 years in a bull case, this put gradually decays toward zero. The $4.8M becomes a loss.
🎯 Base Case (40% probability)
Target: $45-$52 (WIDE RANGE OVER 2.7 YEARS)
Most likely multi-year scenario:
- ✅ Banks continue generating strong earnings but multiple doesn't re-rate significantly
- 🏦 Fed gradually cuts rates but Iranian oil shock causes delays - 1-2 cuts in 2026, more in 2027
- 📊 CRE problems simmer - occasional loss reserve increases keep bank sentiment cautious
- 💱 XLF oscillates between the $48-$54 range as bullish (deregulation) and bearish (macro) catalysts alternate
- 🏥 Insurance sector continues to drag - health insurer margin compression an ongoing headwind
- 📉 XLF ends 2028 in the $48-$52 zone - puts expire mostly worthless but not a complete blowout
For this put trade: $45 puts likely expire with minimal value ($0.50-$1.50) if XLF muddling around $48-$52. This is the highest probability outcome. The $4.8M buys massive protection that's unlikely to be fully exercised.
📉 Bear Case (25% probability - This is what the $4.8M is betting on)
Target: $40-$45 (PUTS PAY OFF)
What could crater XLF over 2.7 years:
- 🏢 CRE maturity wall hits hard 2026-2027: Commercial real estate defaults accelerate, regional banks need large reserve builds, sentiment collapses → MetLife exposure and bank CRE books show losses
- 🛢️ Sustained oil-driven inflation forces Fed hawkishness: Flat or inverted yield curve for 12-18 months → bank NIM compressed significantly → multiple years of earnings disappointment
- 💔 Warsh surprises hawkishly: Despite signals, the new Fed Chair takes aggressive balance sheet normalization path → systemic tightening → credit conditions worsen for banks
- 📊 Consumer credit deterioration: Rising energy costs + softening labor market → credit card and auto loan defaults rise → banks build reserves → EPS misses compound
- 🌍 Geopolitical escalation extends: Iran war extends 12+ months → inflation elevated → recession risk → loan losses across the board
- 🎯 Break below $49 gamma support opens path toward $47, $45, then $40
For this put trade:
- XLF at $45 on December 15, 2028: Puts at-the-money, recover full $4.8M premium (breakeven)
- XLF at $41 on December 15, 2028: 12,000 × ($45-$41) × 100 = $4.8M PROFIT on $4.8M invested (100% ROI)
- XLF at $38 on December 15, 2028: 12,000 × ($45-$38) × 100 = $8.4M PROFIT (175% ROI)
Key levels:
- 🛡️ $50: The $441.2 GEX monster - break below = bearish structural signal
- 🛡️ $49: Immediate gamma support (214.5 GEX) - critical near-term floor
- 🛡️ $48: Secondary support (167.5 GEX) - defense line for the bulls
- 🛡️ $45: The put strike + existing gamma (47.3 GEX) - where the trade really pays off
💡 Trading Ideas
🛡️ Conservative: Hedge Your Financial Sector Exposure
Play: If you own bank stocks or XLF shares, add long-dated put protection
Structure: Buy 1-2 XLF December 2027 $47 puts per 100 shares of XLF you own as portfolio insurance
Why this works:
- 📊 XLF is trading at 11.47x forward P/E vs S&P 500's 20.01x - cheap, BUT CRE and rate risks are real
- 🛡️ Long-dated puts provide multi-year insurance against CRE blow-ups, sustained yield curve inversion, and credit quality deterioration
- 💰 If XLF rallies (bull case), you still participate - the put is just insurance, not a full reversal
- 🏦 The LEAP structure eliminates near-term theta burn and gives your thesis time to develop
Cost: ~$2.50-$3.50 for December 2027 $47 puts - that's 5-7% insurance on your XLF position for 21 months
Risk level: Low (defined hedge) | Skill level: Intermediate
⚖️ Balanced: Wait for FOMC, Then Trade the Sector Break
Play: After FOMC tomorrow, play the reaction in XLF with shorter-dated positions
If hawkish FOMC (flat/inverted yield curve threat):
- 📉 Buy XLF May 2026 $47 puts at ~$0.80-$1.20 after the breakdown starts
- 🎯 Target: $45-$46 range by April bank earnings if credit concerns mount
- 📊 Risk: $80-$120 per contract, target $150-$250 gain if thesis works
If dovish FOMC (yield curve steepens, banks rally):
- 📈 Buy XLF June 2026 $52 calls at ~$0.60-$1.00
- 🎯 Target: $53-$55 if XLF breaks above $50 on dovish catalyst
- 📊 Risk: $60-$100 per contract, target $200-$350 if $50 gamma wall breaks
Why this works:
- ⏰ FOMC is tomorrow - the rate signal will define the near-term yield curve trajectory
- 🎯 Trade WITH the confirmed direction rather than guessing
- 💸 Post-FOMC IV crush makes shorter-dated options cheaper for entry
Position sizing: 2-4% of portfolio maximum
Risk level: Moderate | Skill level: Intermediate
🚀 Aggressive: The Long-Dated Bear Thesis (Copy the Whale's Framework - Smaller!)
Play: Scale down the institutional LEAP put thesis to retail-sized positions
Structure: Buy 5 contracts of XLF December 2028 $45 puts at $4.00
Why this could work:
- 🐋 Someone just paid $4.8M for precisely this position with only 4 prior contracts in existence - they clearly have a HIGH-CONVICTION view
- 🏢 CRE maturity wall is a MULTI-YEAR problem - 2.7 years gives time for defaults to compound through the banking system
- 📊 XLF already broke $50.90 technical support in February - the chart is showing weakness at the time of this trade
- 🏦 If rate cuts are delayed by oil inflation through 2026-2027, bank margins get squeezed for years, not months
- ⏰ 2.7 years at $4.00 premium is time and risk diversification - you're not dependent on any single catalyst
The math (5 contracts):
- 💰 Cost: $2,000 (5 × $4.00 × 100) - this is your MAX LOSS
- 📉 XLF at $40 on December 15, 2028: 5 × ($45-$40) × 100 = $2,500 profit (25% ROI)
- 📉 XLF at $35 on December 15, 2028: 5 × ($45-$35) × 100 = $5,000 profit (150% ROI)
- 📈 XLF at $50+ on December 15, 2028: $0 value → lose full $2,000 (most likely scenario)
Breakeven: XLF below $41.00 ($45 - $4.00 premium) by December 2028 - requires a ~17% decline from here maintained over 2.7 years
CRITICAL WARNING: This is a LOW-PROBABILITY, HIGH-REWARD bet. Most LEAP puts expire worthless. Financials at 11.47x forward P/E are genuinely cheap. Deregulation tailwinds are real. The institutional buyer likely has a massive offsetting long position - you probably don't. This is the highest-risk strategy here.
Risk level: HIGH | Skill level: Advanced
⚠️ Risk Factors
The serious challenges facing this bear thesis:
-
💰 Financials are genuinely cheap: 11.47x forward P/E vs S&P 500 at 20.01x is a 43% discount with HIGHER projected EPS growth (9.80% vs 7.62%). For financials to hit the $45 put strike, something structural has to go fundamentally wrong - you can't get there on "cheap but not cheap enough" logic alone.
-
🏛️ OBBBA deregulation is a genuine multi-year tailwind: The 2025 regulatory rollback freed up bank capital, accelerated M&A approvals, and reduced compliance burden. Over 2.7 years, this is a meaningful earnings improvement catalyst that works AGAINST this put trade.
-
📈 Q4 2025 earnings were EXCELLENT: Across the board beats - JPM beat by 4.6%, Goldman's profit jumped 12%, BAC beat by 10.4%. The underlying businesses are STRONG. Bears need multiple quarters of disappointment to build a case.
-
🌍 Iran war could resolve faster than expected: A diplomatic resolution or ceasefire would immediately lower oil prices, restore the rate-cut path, steepen the yield curve, and remove the primary macro headwind for XLF. The put would immediately go further out of the money.
-
🏦 M&A and IPO supercycle: The capital markets pipeline is explosive - "veteran unicorn" IPOs and AI infrastructure deals generate massive fee income for investment banks. This is not going away in 2.7 years.
-
⏰ Massive time decay on a $4.00 premium: Even with 2.7 years remaining, theta works against long put holders every single day. With the underlying at $49.65 and the strike at $45, a 9.3% decline is needed just to be in-the-money at expiration. Time is the enemy here.
-
💡 The OI mystery: Why was OI just 4? Possibly because this strike/expiry was so far out that nobody had bothered. OR because smart money was carefully avoiding building a footprint. The low OI tells us this is a fresh idea, not a conviction being built over time.
-
🎲 Concentration in BRK.B and JPM: 25% of XLF in just two stocks. Berkshire Hathaway is one of the most conservative, well-capitalized companies in the world. A structural XLF decline requires these giants to fail too - a high bar.
🎯 The Bottom Line
Here's the deal: Someone just created a $4.8M position in an options strike that barely existed before this morning. They bought December 2028 puts at the $45 strike when open interest was just 4 contracts. This is as clean a "new conviction trade" as you'll ever see in the options market.
What this trade tells us:
- 📊 The trader has a 2.7-year bearish thesis on US financials - they're not reacting to today's news, they're building a STRATEGIC position
- 🏢 CRE maturity walls, yield curve dynamics, and potential credit cycle deterioration are the most likely drivers of this view
- 💸 Paying $4.00 for December 2028 $45 puts shows they've done the math - they expect XLF to underperform over multiple years, not just this quarter
- 🎯 The $45 level is meaningful - it's below key gamma support ($49) and represents a full breakdown in the financial sector, not just a correction
This is NOT a crash prediction - it's a multi-year hedge against financial sector underperformance.
If you own bank stocks or XLF:
- ✅ This is a signal to review your financial sector exposure and consider whether you have adequate downside protection
- 📊 Watch the $50 level tomorrow post-FOMC - hold above = bulls still in control; break below = the bear thesis has momentum
- ⏰ Q1 2026 bank earnings (April) will be the first real test of whether CRE concerns are materializing
- 🛡️ If you want protection, LEAP puts are more capital-efficient than short-term puts for multi-year risk management
If you're watching XLF:
- 👀 FOMC tomorrow at 2:30 PM ET - hawkish tone = bears win near-term; dovish tone = bulls get a bounce above $50
- 📅 April 2026 bank earnings are the next major data point - credit provision trends will tell the story
- 🎯 Key support: $49 gamma floor (214.5 GEX) then $48 (167.5 GEX) - watch these for breakdown signals
If you're bearish on financials:
- 🎯 This trade validates that sophisticated institutional money has a similar view
- 📉 Smaller LEAP put positions (5-10 contracts) offer the same structural insurance without $4.8M at risk
- ⚠️ Don't size this aggressively - base case is still rangebound or mild recovery (40%), bearish case is 25%
Mark your calendar:
- 📅 March 18, 2026 (TOMORROW) - FOMC rate decision - THE near-term catalyst for yield curve direction
- 📅 March 20, 2026 - Triple Witch expiration - near-term volatility event with $50 gamma wall in play
- 📅 March-April 2026 - Kevin Warsh Senate confirmation hearings underway
- 📅 April 2026 - Q1 2026 bank earnings - first read on CRE and credit quality
- 📅 May 2026 - Warsh assumes Fed Chair role (new policy era begins)
- 📅 2026-2027 ongoing - CRE maturity wall refinancing challenges
- 📅 December 15, 2028 - This $4.8M put trade expires
Final verdict: The LEAP put buyer is making a sophisticated, multi-year macro bet that financials face structural headwinds over the next 2.7 years. With CRE exposure, potential yield curve challenges, and the unknown Warsh policy era all hanging over the sector, the thesis is not crazy. But it's fighting against genuinely cheap valuations and strong deregulatory tailwinds. The most likely outcome is this put expires with reduced value - but if the macro turns against banks in a sustained way, the payoff could be significant.
Take this as a signal to review your financial sector allocation and ensure you're not overexposed heading into a period of genuine macro uncertainty. 💪
Disclaimer: Options trading involves substantial risk of loss and is not suitable for all investors. This analysis is for educational purposes only and does not constitute financial advice. Past performance does not guarantee future results. LEAP puts carry extreme time decay risk and require sustained directional moves to be profitable. The OI of 4 before this trade means there is very limited price discovery for this specific strike/expiry - bid-ask spreads may be wide and liquidity limited for retail traders. The institutional buyer may have complex portfolio hedging needs, offsetting positions, or information not available to retail traders. Always do your own research and consult a licensed financial advisor before trading.
About Financial Select Sector SPDR Fund (XLF): XLF is the flagship financial sector ETF tracking S&P 500 financial companies including banks, insurance, diversified financials, and real estate. Current price $49.65, forward P/E 11.47x vs S&P 500 at 20.01x, with top holdings including Berkshire Hathaway, JPMorgan Chase, Bank of America, Wells Fargo, Goldman Sachs, Morgan Stanley, and Citigroup.