🐋 AMZN $19M Deep ITM Call — Smart Money Loading Up Before Earnings!
📅 April 8, 2026 | 🔥 Unusual Activity Detected
🎯 The Quick Take
Someone just loaded up $19 MILLION on AMZN deep in-the-money calls at the $190 strike expiring May 15, 2026 — while the stock trades at $221.43! This isn't speculation, it's a stock replacement play — buying calls instead of shares with a fraction of the capital but near-identical exposure. With Q1 2026 earnings dropping April 23rd and the stock down 20% YTD due to tariff fears, this whale is making a massive bet that AMZN is oversold and ready to rip.
📊 Company Overview
Amazon.com (AMZN) is the world's largest e-commerce and cloud computing company:
- Market Cap: ~$2.3 Trillion (top 5 globally)
- Industry: Internet Retail & Cloud Services
- Current Price: $221.43 (down ~20% YTD from highs near $277)
- Primary Business: E-commerce marketplace, AWS cloud, advertising, Prime Video, logistics
- AWS Backlog: $244 billion (up 40% YoY) — this is where the real money is made
💰 The Option Flow Breakdown
📊 The Tape (April 8, 2026 @ 14:43:01)
| Time | Symbol | Side | Buy/Sell | Type | Expiration | Premium | Strike | Volume | OI | Size | Spot | Option Price |
|---|---|---|---|---|---|---|---|---|---|---|---|---|
| 14:43:01 | AMZN | MID | BUY | CALL $190 | 2026-05-15 | $19M | $190 | 5.7K | 23K | 5,500 | $221.43 | $34.75 |
🤓 What This Actually Means
This is a stock replacement strategy — the institutional playbook for getting stock-like exposure at reduced capital outlay:
- 💸 Monster premium: $19M = $34.75 per contract × 5,500 contracts
- 📈 Deep ITM positioning: $190 strike is 14.2% below spot at $221.43, meaning this call has very high delta (close to 1.0 — moves almost dollar-for-dollar with the stock)
- 🏦 Capital efficiency: Controlling 550,000 shares of AMZN worth ~$122M in notional value for $19M in premium
- ⏰ Strategic window: 37 days to expiration covers Q1 2026 earnings (April 23) with time to ride any post-earnings rally
- 📊 Open interest context: 5,700 contracts vs 23K OI — adding to an already significant position
What's really happening here:
Real talk: this isn't someone "gambling" on AMZN. Buying a $190 call when the stock is at $221 is basically buying the stock — just cheaper. The delta on this contract is likely 0.90-0.95, meaning for every $1 AMZN moves up, these calls gain nearly $1. The trader is effectively buying ~550,000 shares of AMZN for $19M instead of paying ~$122M for the actual shares. They get 6x leverage while still sleeping at night because they can only lose the $19M premium, not a $122M stock position.
Why now? AMZN has been destroyed — down 20% YTD — mostly on tariff fears. This whale apparently thinks the selloff is overdone, Q1 earnings will surprise to the upside, and AMZN is headed back toward $240-$260.
Unusual Score: 🔥 EXTREMELY UNUSUAL (Z-score 3.07) — this type of size in a single contract on a deep ITM call happens only a few times a year for AMZN. With only 4 similar trades in history, this is genuine institutional conviction money, not noise.
📈 Technical Setup / Chart Check-Up
YTD Performance Chart
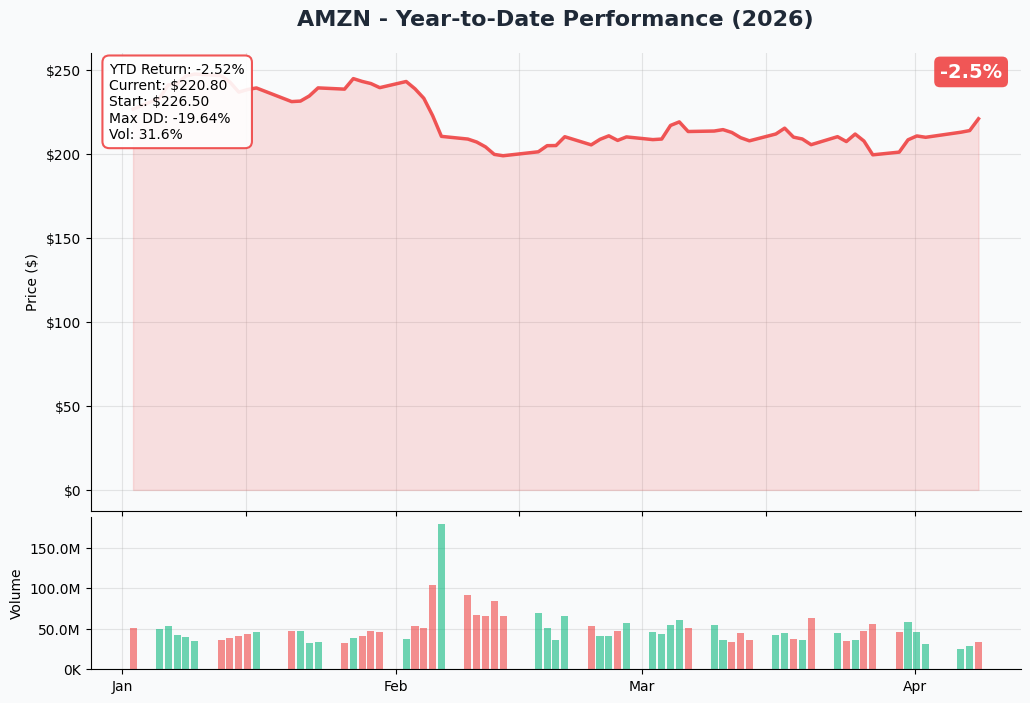
AMZN has had a rough 2026 — down roughly 20% from its 52-week high near $277, now trading around $221. The culprit? Trump's April 5, 2026 tariff announcement — a blanket 10% tariff on all global imports, with a crushing 145% duty specifically on Chinese goods. Amazon stock dropped nearly 7% in the two days following that announcement alone.
Key observations:
- 📉 YTD decline: Down ~20% from highs — entering technical oversold territory for a mega-cap
- 🔵 Major support zone: $215-$220 range has absorbed selling pressure multiple times
- 🎢 Volatility spike: Tariff news created a sharp V-shaped move down, classic panic selling
- 📊 Volume surge on dips: Institutional accumulation signatures visible on down days
- ⚠️ Trend: Still below the 50-day and 200-day moving averages — technically broken but bouncing
Gamma-Based Support & Resistance Analysis
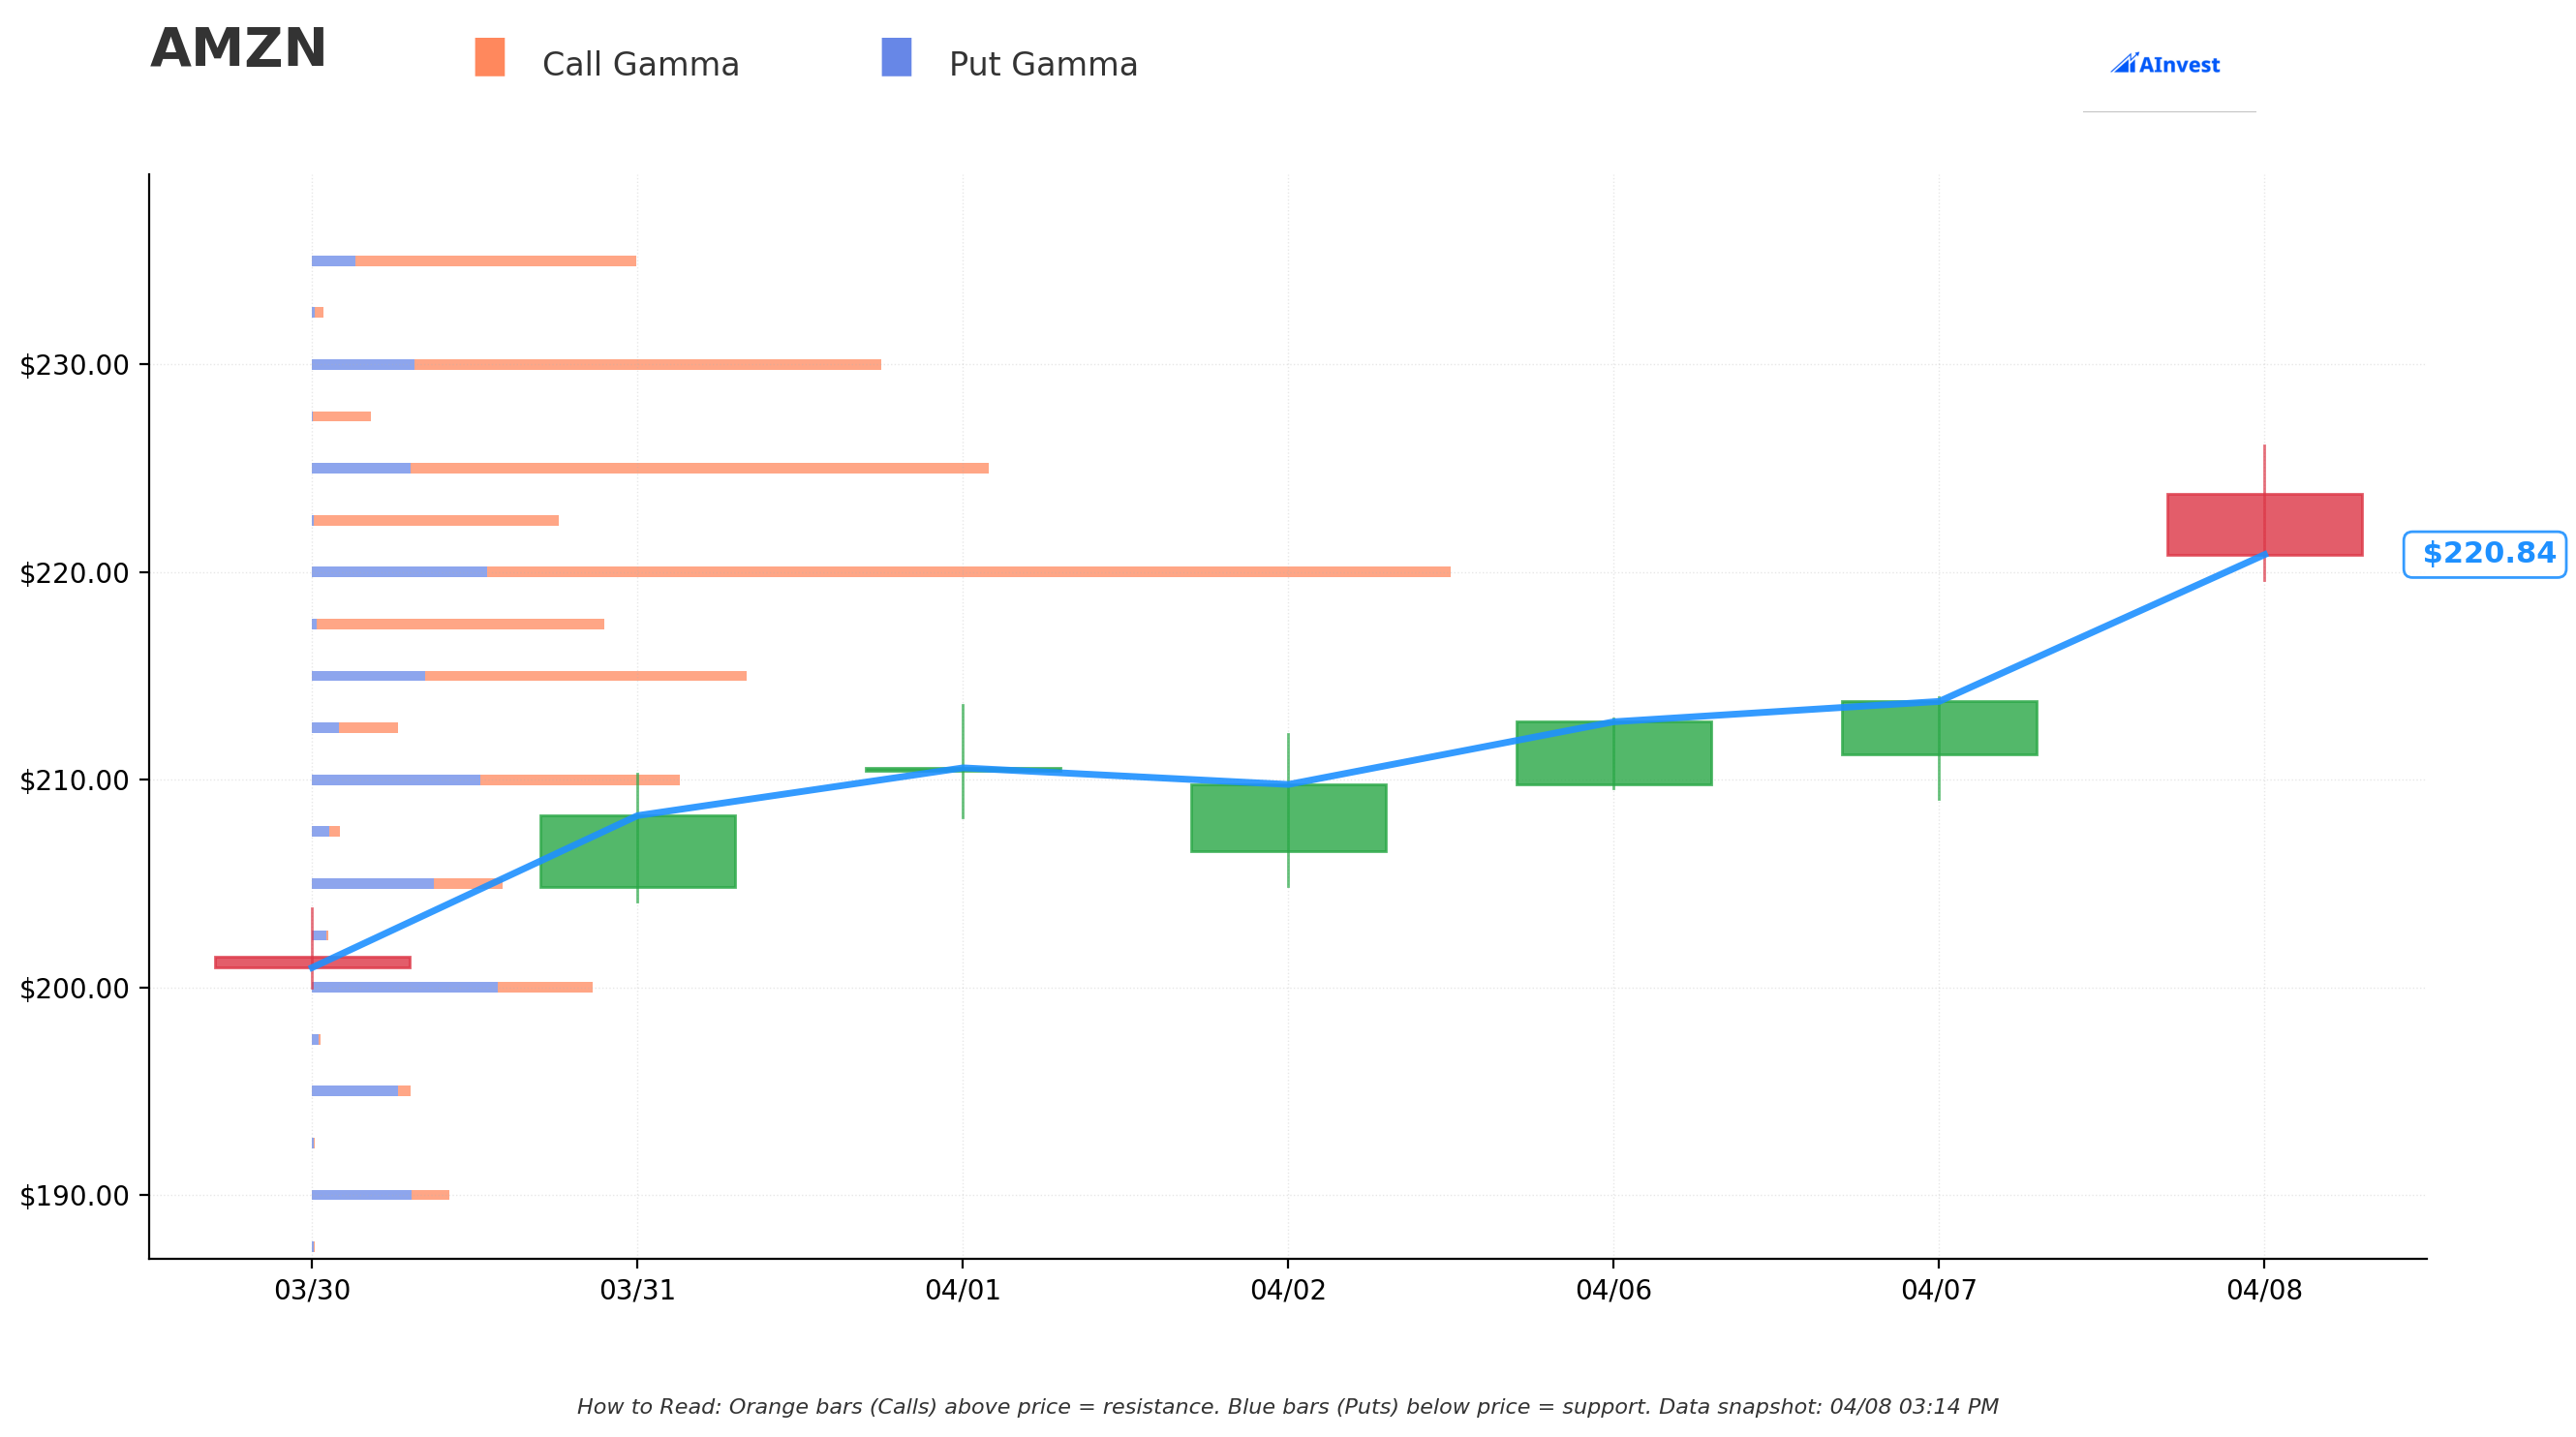
Current Price: $220.96
The gamma exposure map reveals exactly where market makers are positioned — and it tells a compelling story:
🔵 Support Levels (Put Gamma Below Price):
- $220 — Immediate support with 129.1B total gamma exposure (strongest nearby floor — dealers MUST buy here!)
- $217.50 — Secondary support at 37.7B gamma (mild cushion if $220 breaks)
- $215 — Structural floor at 52.6B gamma (solid secondary support zone)
- $210 — Deep support at 43.8B gamma (balanced call/put gamma here = gravitational pull)
- $200 — Major put floor at 33.5B gamma with negative net GEX — dealers short gamma below here = accelerated moves possible
🟠 Resistance Levels (Call Gamma Above Price):
- $222.50 — Immediate ceiling at 30.4B gamma (just 0.7% overhead — pinning pressure)
- $225 — Secondary resistance at 81.8B gamma (STRONG — dealers will sell into rallies here)
- $230 — Major resistance at 68.8B gamma (4% above current)
- $235 — Extended ceiling at 39.2B gamma (6.4% above current)
- $250 — Long-term upside target at 46.3B gamma (13% above current — breakout territory)
What this means for traders:
AMZN is pinned in a tight band right now. The $220 level is essentially the gravitational center — massive 129B gamma exposure acts like a magnet. Net GEX bias is bullish (642.5B call gamma vs 209.2B put gamma), meaning market makers are net long gamma and will dampen volatility by selling into rips and buying into dips. Translation: slow grinds up are favored, but hard breakouts need a catalyst — and Q1 earnings on April 23 is exactly that catalyst.
Notice the whale bought the $190 strike — well below ALL support levels. This position profits handsomely even if AMZN just stays flat or drifts modestly higher into May 15.
Implied Move Analysis
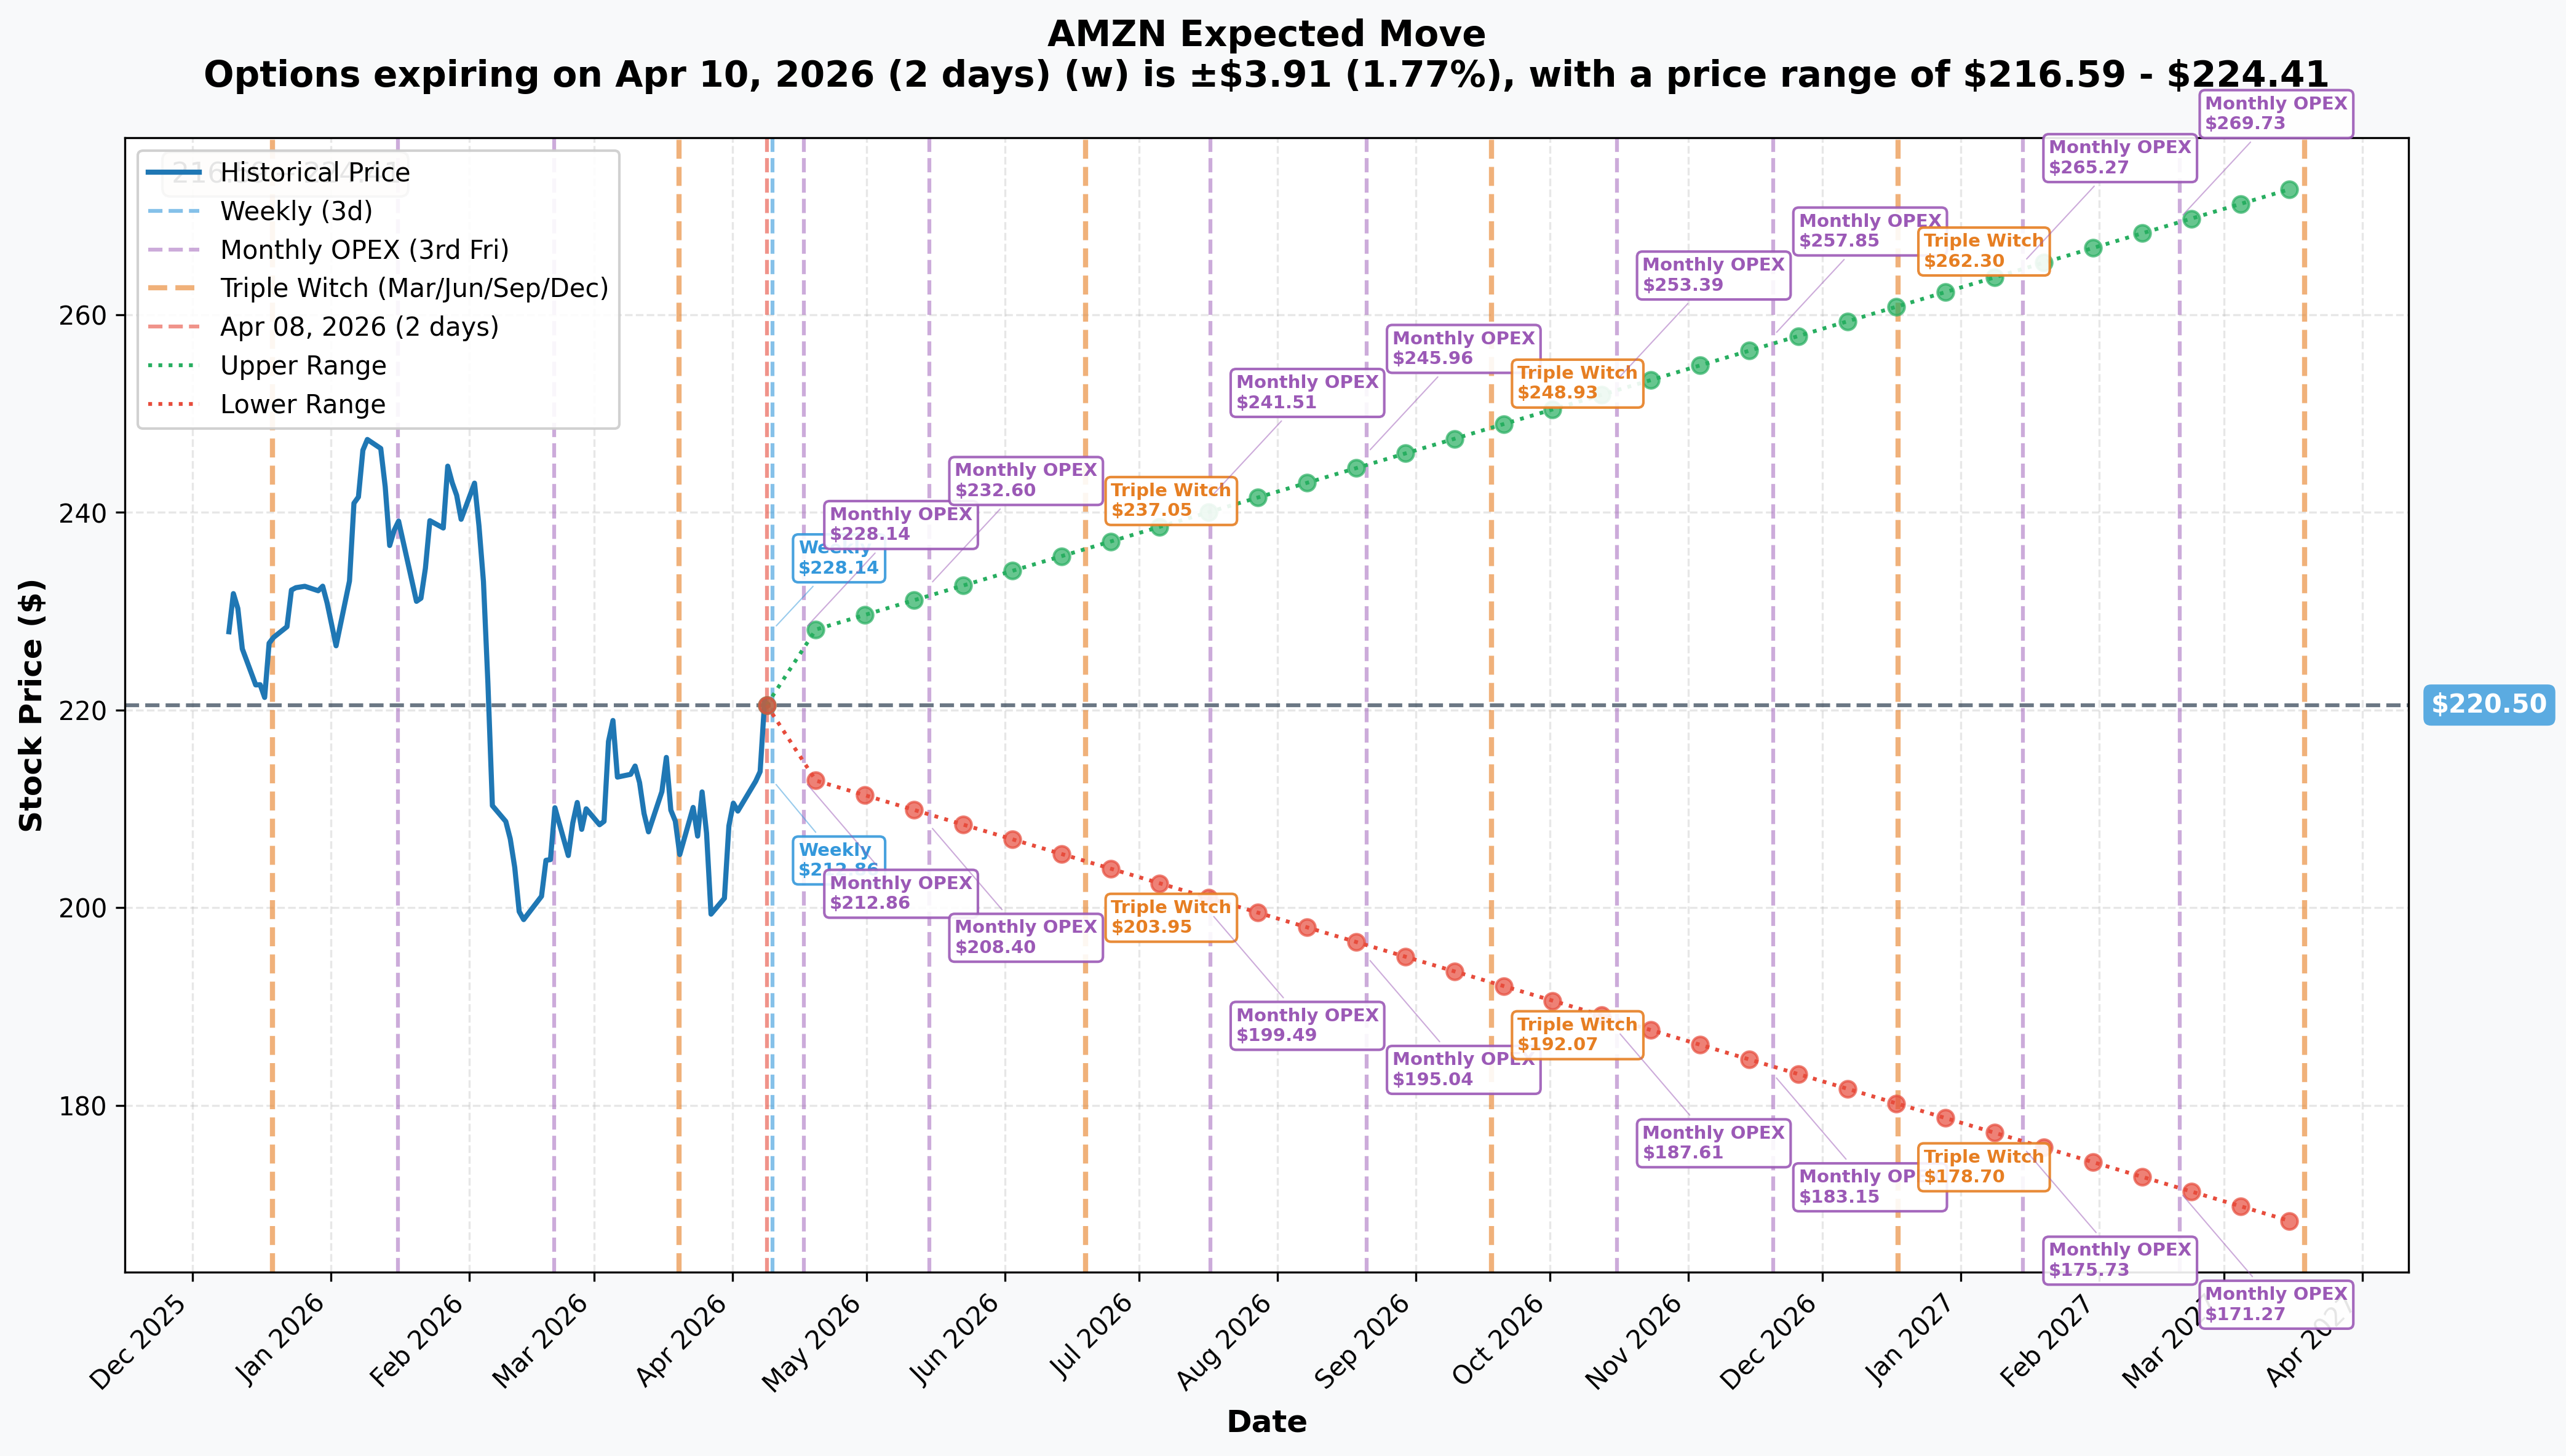
Options market pricing for upcoming expirations:
- 📅 Weekly (April 10 — 2 days): ±$3.91 (±1.77%) → Range: $216.59 - $224.41
- 📅 Monthly OPEX (April 17 — 9 days): ±$7.37 (±3.34%) → Range: $213.13 - $227.87
- 📅 May OPEX (May 15 — THIS TRADE!): Range: $208.40 - $232.60
- 📅 June Triple Witch (June 19): Range: $203.95 - $237.05
- 📅 LEAPS (March 2027 — 345 days): ±$52.74 (±23.92%) → Range: $167.76 - $273.24
Translation for regular folks:
The market is pricing in a ±$3.91 move by Friday (less than 2%), but by May 15 when this trade expires, the range blows out to $208.40 - $232.60. That's a 10.9% total swing potential — and earnings on April 23rd is the fuel that could push it firmly toward either extreme.
Key insight: This deep ITM call breaks even at $224.75 ($190 + $34.75). The stock only needs to climb $3.32 from current levels (1.5%) to be profitable at expiration. Given a +$24.60 move to the upside is priced in by May 15, the risk/reward here skews heavily in the buyer's favor.
🎪 Catalysts
🔥 Upcoming Catalysts
Q1 2026 Earnings — April 23, 2026 (15 DAYS AWAY!) 📊
This is THE moment. Amazon reports Q1 2026 earnings on April 23rd after market close. Wall Street is watching three things:
- 🌩️ AWS growth rate: Can it break above 30% YoY after hitting 24% in Q4 2025? With $244B in AWS backlog (up 40% YoY) and a massive $200B capex plan, the setup is powerful
- 💰 Operating income: Q1 guidance was $16.5B-$21.5B — a wide range that suggests management uncertainty around tariff impacts
- 🛒 E-commerce margins: How much are tariffs actually eating into first-party retail margins?
Why this matters for the trade: A Q1 earnings beat on AWS + any positive tariff resolution commentary could send AMZN surging 8-12%, easily pushing from $221 to $240-$250. The call buyer positioned perfectly — 37 days of runway means they survive the pre-earnings vol crush and benefit from the post-earnings move.
Amazon $200B AI Capex Cycle 🤖
Amazon is deploying $200 billion in capital expenditures, predominantly for AWS data centers and AI infrastructure. With a $138 billion, eight-year partnership with OpenAI anchoring the cloud pipeline, the revenue runway is massive. J.P. Morgan projects AWS backlog growth of $100B quarter-over-quarter in Q1 2026 — a number that would signal the cloud business is genuinely reaccelerating.
Analyst Consensus: Overwhelmingly Bullish 📈
Despite the YTD selloff, Wall Street analysts have NOT cut their targets:
- J.P. Morgan: Buy, $305 target
- Bank of America: Buy, $303 target
- Evercore ISI: Outperform, $335 target
- Consensus target: ~$280-$295 = 25-35% upside from current levels
That gap between where analysts think AMZN should trade ($280-$295) and where it actually trades ($221) is the opportunity this whale is betting on.
⚠️ Past / Ongoing Risk Catalysts
Tariff Headwinds: The $5-$10B Profit Risk 🚨
Goldman Sachs analyst Eric Sheridan estimates Amazon faces $5B-$10B in annualized operating profit impact from tariffs, specifically the 145% duty on Chinese imports. This hits two ways:
- 🛒 First-party retail: Amazon buys goods directly from Chinese suppliers — those costs are rising fast
- 📦 Third-party marketplace: Elimination of the de minimis exemption kills the cost advantage that Chinese sellers on Amazon had vs domestic goods
CEO Andy Jassy has already said tariffs have started to "creep" into consumer prices. That's the headwind.
The silver lining? Amazon is actually better positioned than most retailers because of its scale and pricing power — Amazon held the lowest prices of the holiday season for the 8th year in a row. In the same way Amazon gained market share during COVID, it could scoop up customers fleeing pricier competitors.
Raymond James Downgrade: A Lone Bear 🐻
Raymond James downgraded AMZN citing tariff headwinds and "limited" near-term AI monetization — this is the contra case. If AWS growth disappoints and management guides cautiously for Q2, the stock could test $200-$210 support.
🎲 Price Targets & Probabilities
Using gamma levels, implied move data, earnings setup, and the tariff macro backdrop:
📈 Bull Case (40% probability)
Target: $240-$260
How we get there:
- 💪 Q1 earnings beat — AWS growth breaks 28%+ YoY, operating income hits the high end of $21.5B guidance
- 🌩️ AWS backlog commentary points to 30%+ growth acceleration in Q2 2026
- 🤝 Any positive signal on tariff negotiations (90-day pause on reciprocal tariffs already in effect)
- 📈 Technical breakout through $225 resistance triggers momentum buying
- 🎯 Stock moves toward the $232.60 May 15 implied move upper bound, pushing into next gamma resistance at $230-$235
Call buyer's dream scenario: AMZN surges to $240 post-earnings. The $190 call would be worth ~$50 vs the $34.75 cost — a $84M gain on the $19M position (4.4x return on premium).
🎯 Base Case (45% probability)
Target: $218-$232 range (chop around current levels)
Most likely scenario:
- ✅ Solid but not spectacular earnings — AWS growth 25-27%, operating income in-line
- ⚖️ Management guides Q2 conservatively given tariff uncertainty
- 🔄 Stock oscillates between $220 gamma support and $225-$230 resistance
- 💤 Post-earnings volatility crush, stock settles back toward current levels
Call buyer in this scenario: The $190 strike is so deep ITM that even in a flat tape, time decay barely hurts. A 0.92-delta call loses very little to theta relative to its delta exposure. The position remains highly profitable unless AMZN drops sharply.
📉 Bear Case (15% probability)
Target: $200-$210 (test the $200 put support floor)
What could go wrong:
- ❌ AWS growth disappoints — comes in below 22% YoY, showing capacity constraints or competition
- 🚨 Tariff impact is worse than feared — management slashes Q2 guidance materially
- 📉 Broader market selloff as reciprocal tariffs resume after the 90-day pause
- ⚠️ $200 put gamma floor gets tested — the net GEX flips negative below $200, meaning dealer hedging could accelerate a move lower
- 💔 The $190 call would still retain intrinsic value (AMZN at $205 = $15 intrinsic), limiting the loss, but the position would be underwater vs $34.75 cost
💡 Trading Ideas
🛡️ Conservative — "Collect While You Wait"
Sell the May 16 $215/$210 put spread
- Sell the $215 put, buy the $210 put — collect ~$1.50-$2.00 credit
- Why this works: You're betting AMZN holds the massive $215 gamma support. Max profit if stock stays above $215 through May 15. Risk is capped at $3-$3.50 per share
- Breakeven: ~$213-$213.50
- Probability of profit: ~70% based on gamma support and current positioning
- Fits: Traders who think AMZN is stable but don't want to chase the upside
⚖️ Balanced — "Earnings Straddle Play"
Buy the April 24 (1-day post-earnings) $220 straddle
- Pay ~$7-$8 total for both the call and put at $220 strike
- Why this works: Q1 earnings on April 23 will almost certainly move the stock significantly in one direction. The implied move of ±$7.37 by April 17 suggests even MORE volatility is priced in for the earnings week
- Breakeven: Move more than ~$7 in either direction from $220 (so above $227 or below $213)
- Probability of profit: ~45% — you need the move to EXCEED what the market has already priced in
- Fits: Traders who think the earnings reaction will be violent but aren't sure which way
🚀 Aggressive — "Follow the Whale"
Buy the May 15 $220 call (closer to the money for more leverage)
- Cost: ~$8-$10 per contract
- Why this works: Same directional bet as the whale but with more upside leverage. If AMZN moves to $240 by May 15, a $220 call gains 200-300% vs roughly 44% gain on the deep ITM $190 call
- Breakeven: $228-$230 at expiration
- Max loss: Premium paid (100%)
- Probability of profit: ~40% based on implied move data
- Fits: YOLO traders who want to ride the coattails of a $19M institutional bet — but understand the all-or-nothing nature
- ⚠️ Important: This costs much less than $34.75, so position sizing matters — don't bet the farm
⚠️ Risk Factors
🚨 Tariff escalation: The current 145% China tariff and elimination of de minimis is already painful. If the 90-day pause on reciprocal tariffs ends without a deal, Amazon's guidance for Q2-Q3 2026 could get very ugly.
📉 AWS growth stall: If cloud growth disappoints and Raymond James' thesis proves correct, the stock has a clear path to $200-$210. At those levels, the $190 calls would still have intrinsic value but the trade would show a significant loss.
💸 Premium at risk: Even though this is a deep ITM call, the buyer paid $34.75 — AMZN would need to trade below $190 at expiration to suffer a total loss. That's a 14% decline from today — painful but not impossible in a macro meltdown.
🎢 Earnings volatility crush: Going into April 23 earnings, IV on this option will be elevated. Post-earnings, IV drops sharply — even if the stock moves in the right direction, profits may be smaller than expected if the move isn't BIG enough to offset the vol crush.
⏰ Time is limited: 37 days to May 15. If AMZN stays flat or grinds lower for 3 weeks then pops after earnings, there may not be enough time to fully realize the thesis.
🎯 The Bottom Line
Real talk: this is one of the most intelligently constructed options trades we've seen on AMZN this year.
The whale isn't gambling — they're using a $190 deep ITM call as a capital-efficient stock replacement to get long 550,000 shares of AMZN for $19M instead of $122M. The timing is surgical: Q1 earnings on April 23rd gives them a binary catalyst within the 37-day window, and the stock is sitting on massive gamma support at $220 after a brutal 20% YTD selloff driven largely by tariff panic.
If you own AMZN stock: This whale's conviction confirms the thesis that the selloff is overdone. Hold through earnings with a stop at $207 (below the $210 gamma floor).
If you're watching from the sidelines: Wait for the post-earnings reaction on April 23rd. If AMZN beats and AWS shows re-acceleration, the $225-$230 resistance levels are the next targets. A confirmed breakout above $225 with volume would be the entry signal.
If you're bearish: The risk/reward doesn't favor the bear case right now. Net GEX is bullish, analysts are overwhelmingly buy-rated with $280-$305 targets, and a $19M smart money bet just went into the deep ITM calls. Respect the whale.
Mark your calendar for April 23rd. Q1 earnings will resolve the tariff uncertainty one way or another. If AWS hits 28%+ growth and management doesn't spook the market on Q2 guidance, AMZN could be trading at $235-$240 before May 15 expiration — and this $19M bet could be worth $25M+ before the day is out.
⚠️ Disclaimer: This analysis is for informational and educational purposes only. Options trading involves substantial risk of loss and is not appropriate for all investors. The unusual options activity described does not constitute a buy, sell, or hold recommendation. Always do your own due diligence and consult a financial advisor before making investment decisions. Past performance of similar setups does not guarantee future results.