🚀 AMZN $14M Bullish Long-Call Roll — Whale Locks In Deep-ITM May $210 Profit and Rolls Up to July $275 OTM After Q1 Blowout
📅 May 6, 2026 | 🔥 Unusual Activity Detected | 🎯 Strategy: Long Call Roll (STC + BTO, same right, up & out)
🎯 The Quick Take
A whale just rolled a major long Amazon call position up and out in a single coordinated execution — selling 9,400 May 15 $210 calls to close ($60M proceeds) and buying 9,500 July 17 $275 calls to open ($14M debit) — both legs printing at 11:10:27 AM with AMZN trading at $274.31. The Vol/OI of 0.522 on the May $210 leg (9,400 volume against 18,000 prior OI) is the tell: this is volume going into existing open interest, not new short-call supply hitting the tape — the seller is closing out an established long position, locking in the deep intrinsic value, and simultaneously rolling that exposure up to July $275.
This is a directional bullish trade, not a premium-collection trade. The $46M apparent net credit is mostly recycled profit from the May $210 calls the whale already owned (worth $64+ intrinsic against whatever they originally paid, likely a fraction of that). The forward-looking position — and the only piece of fresh capital actually committed — is the $14M new long July $275 call stack.
Translation: Someone with a sizable existing long-AMZN-call position took profits on the May $210s, and spent $14M of those proceeds opening a new bullish bet at a higher strike with 72 more days of runway. The $46M difference goes back to their balance sheet as realized gains. The trade reads as conviction the AWS / AI hyperscaler thesis sustains a grind into the July 30 Q2 print — strong enough to retire the deep-ITM May position and re-enter higher up the strike chain, not strong enough to chase a $300+ tail.
The trade says: I made my money on the May $210 calls — those are done. I want to keep bullish exposure into Q2 earnings, but at a higher strike where my breakeven is more aligned with where I think AMZN can run from here.
📊 Company Overview
Amazon.com, Inc. (NASDAQ: AMZN) is the world's largest online retailer and the dominant cloud infrastructure provider through Amazon Web Services. Founded in 1994 and now led by CEO Andy Jassy, Amazon operates across four primary segments: North America retail, International retail, AWS cloud, and Advertising. The company is increasingly defined by its AI infrastructure ambitions — custom Trainium silicon, a deepened $25B Anthropic partnership, and a roughly $200 billion 2026 capex program.
- Current Price: ~$274.31 (at time of trade, May 6, 2026); $273.55 prior close per WallStreetZen
- Market Cap: ~$2.94 trillion — 5th largest globally per companiesmarketcap.com
- Post-Earnings Reaction: Stock at all-time highs following the April 29 Q1 2026 beat, per 24/7 Wall St.
- FY2026 Q1 Revenue: $181.5B (+17% YoY)
- AWS Q1 Revenue: $37.59B (+28% YoY) — fastest growth in 15 quarters
- Q1 EPS: $2.78 vs. $1.64 consensus — a 69% beat per CNBC
- Next Catalyst: Q2 2026 Earnings, July 30, 2026 (after market close) — company guidance $194–199B revenue
💰 The Option Flow Breakdown
📊 What Just Happened — The Tape (May 6, 2026, 11:10:27 AM)
| Time | Symbol | Buy/Sell | Type | Expiration | Strike | Volume | OI | Vol/OI | Premium | Order Type | Strategy |
|---|---|---|---|---|---|---|---|---|---|---|---|
| 11:10:27 | AMZN | SELL | CALL $210 — May 15 | 2026-05-15 | $210 | 9,400 | 18,000 | 0.522 | $60M | STC | Long Call Roll — Close |
| 11:10:27 | AMZN | BUY | CALL $275 — July 17 | 2026-07-17 | $275 | 9,500 | N/A | 1.203 | $14M | BTO | Long Call Roll — Open |
Gross premium: $74M ($60M proceeds on the close + $14M paid on the open). Net debit on the new bullish position: $14M (the only fresh capital committed). The remaining ~$46M is realized profit from the existing long position being closed — that money goes back to the whale's balance sheet, NOT into a fresh credit-spread structure. Both legs printed simultaneously at 11:10:27 AM — a paired roll. AMZN spot at $274.31 at time of print.
Per-contract economics:
- STC May 15 $210C: $60,000,000 / 9,400 contracts = $63.83/contract (~$64.50 quoted — almost entirely intrinsic value at a $64.31 in-the-money strike). The whale closes an existing long position into ~half of the prior 18,000 OI.
- BTO July 17 $275C: $14,000,000 / 9,500 contracts = $14.74/contract ($15.18 quoted — slightly out of the money, $0.69 OTM with spot at $274.31). Vol/OI of 1.203 = clean fresh open.
🤓 Decoding the Structure: Long Call Roll (Up & Out)
Two legs, different strikes, different expirations, same right (both calls), same timestamp — and most importantly, the SELL leg's volume is materially below the existing open interest, while the BUY leg's volume exceeds prior OI. That is the textbook signature of a roll: closing existing exposure on one strike and opening fresh exposure at another.
Leg 1 — STC May 15 $210 Calls ($60M proceeds):
- 9,400 contracts sold to close against 18,000 existing OI — Vol/OI = 0.522
- The whale almost certainly built this position weeks or months ago when AMZN was lower; with spot now at $274.31 and the $210 strike $64.31 ITM, the calls are dominantly intrinsic value
- The $60M proceeds break out to: (intrinsic value already earned on the long position) + (small remaining time value) — most of this is realized profit on a position they already owned, not new income
- Closing this leg accomplishes two things: (a) crystallizes the in-the-money gains so they can't be eroded by a pullback before May 15, and (b) frees the capital to redeploy at a higher strike with longer duration
- Deep ITM, 9 DTE, delta ~0.95+: the gamma/theta profile of these calls is essentially "stock equivalent." Closing here means the whale didn't want to take physical assignment and didn't want to risk the last 9 days of decay or downside
Leg 2 — BTO July 17 $275 Calls ($14M debit, fresh long):
- 9,500 contracts bought to open; Vol/OI of 1.203 — clean new opening
- The $275 strike sits $0.69 above spot ($274.31) — nearly at-the-money; near-ATM strike selection means real delta exposure (~0.47-0.52) and meaningful vega
- 72 DTE through July 17 expiry, which lands 13 days before Q2 2026 earnings (July 30) — close enough to benefit from pre-earnings IV expansion and any rally into the print, but not positioned to capture the binary earnings event itself (a deliberate choice to avoid post-earnings IV crush)
- $15.18/contract implies a standalone breakeven of $290.18 at July 17 expiry — a 5.8% move from spot
Roll geometry summary:
- Up: $210 → $275 (+31% strike, lifting breakeven to $290 from a point below spot)
- Out: May 15 → July 17 (+63 days of additional time value)
- Net cash flow to the whale: +$46M — but this is recycled profit, not new credit collected
The whale walked away with $46M of realized gains plus a fresh $14M long-call position. Compare that to a true credit spread (where the trader collects net premium on a NEW position at risk), and the difference becomes obvious: only the $14M July $275 call is actual capital at risk going forward. The May $210 closure is simply harvesting an existing asset.
💵 Roll Economics — What the Forward-Looking P&L Actually Looks Like
The trade as it sits forward — only the long July 17 $275C remains as live exposure:
| Component | Contracts | Price/Contract | Total |
|---|---|---|---|
| Long July 17 $275C (BTO) | 9,500 | ~$15.18 | −$14.0M (debit, at risk) |
| May 15 $210C (STC, closed) | 9,400 | ~$64.50 | +$60.0M (proceeds, realized) |
| Net cash to whale | +$46M (recycled gain) | ||
| Capital at risk going forward | $14M (the new July long) |
Forward-looking breakeven (July $275 long, standalone):
- Strike + premium paid: $275 + $15.18 = $290.18 per share at July 17 expiry
- Required move from $274.31: approximately +5.8%
- Given the Q2 guidance midpoint of $196.5B (+16–19% YoY), consensus analyst PT of $312.11, and AWS running at its fastest growth rate in 15 quarters, a move to $290 over 72 days is well within the analyst price-target distribution
Maximum loss going forward: $14M (the entire long premium) if AMZN stays at or below $275 through July 17 expiration.
Maximum gain going forward: Theoretically uncapped — these are long calls, not a spread. If AMZN rallies into Q2 earnings (July 30) with IV expansion, the $275 calls could be worth $20-25 BEFORE expiry, generating 32-65% returns on the $14M committed. Held to expiration, the position becomes profitable above $290 and gains $1 per contract for every $1 above that.
📈 Technical Setup / Chart Check-Up
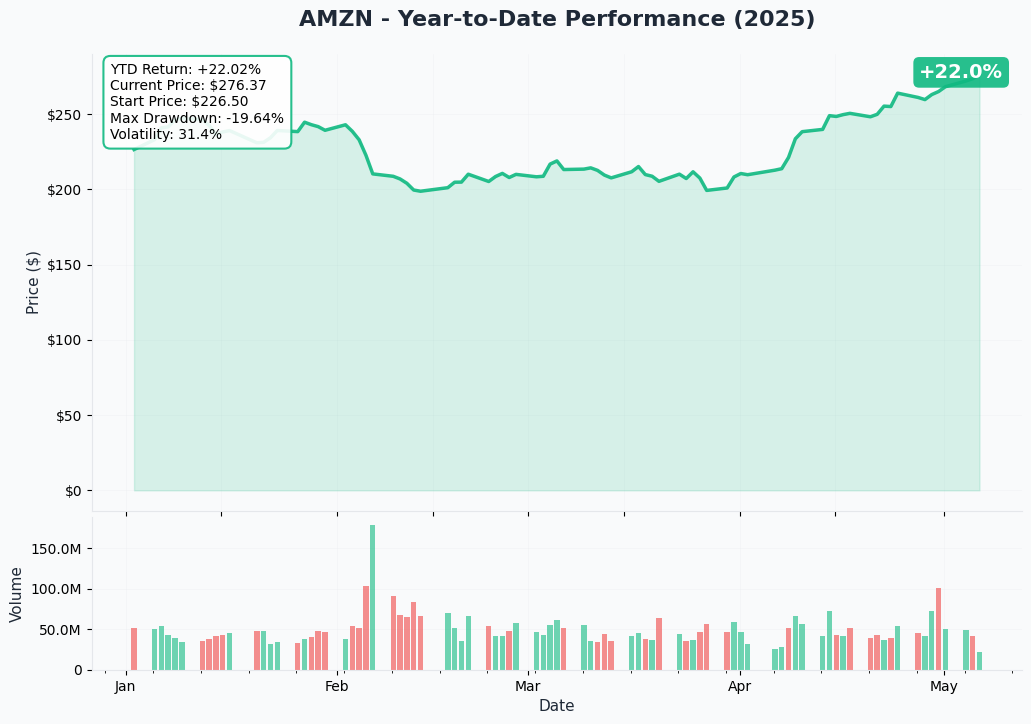
YTD Performance Chart
📈 Gamma-Based Support & Resistance
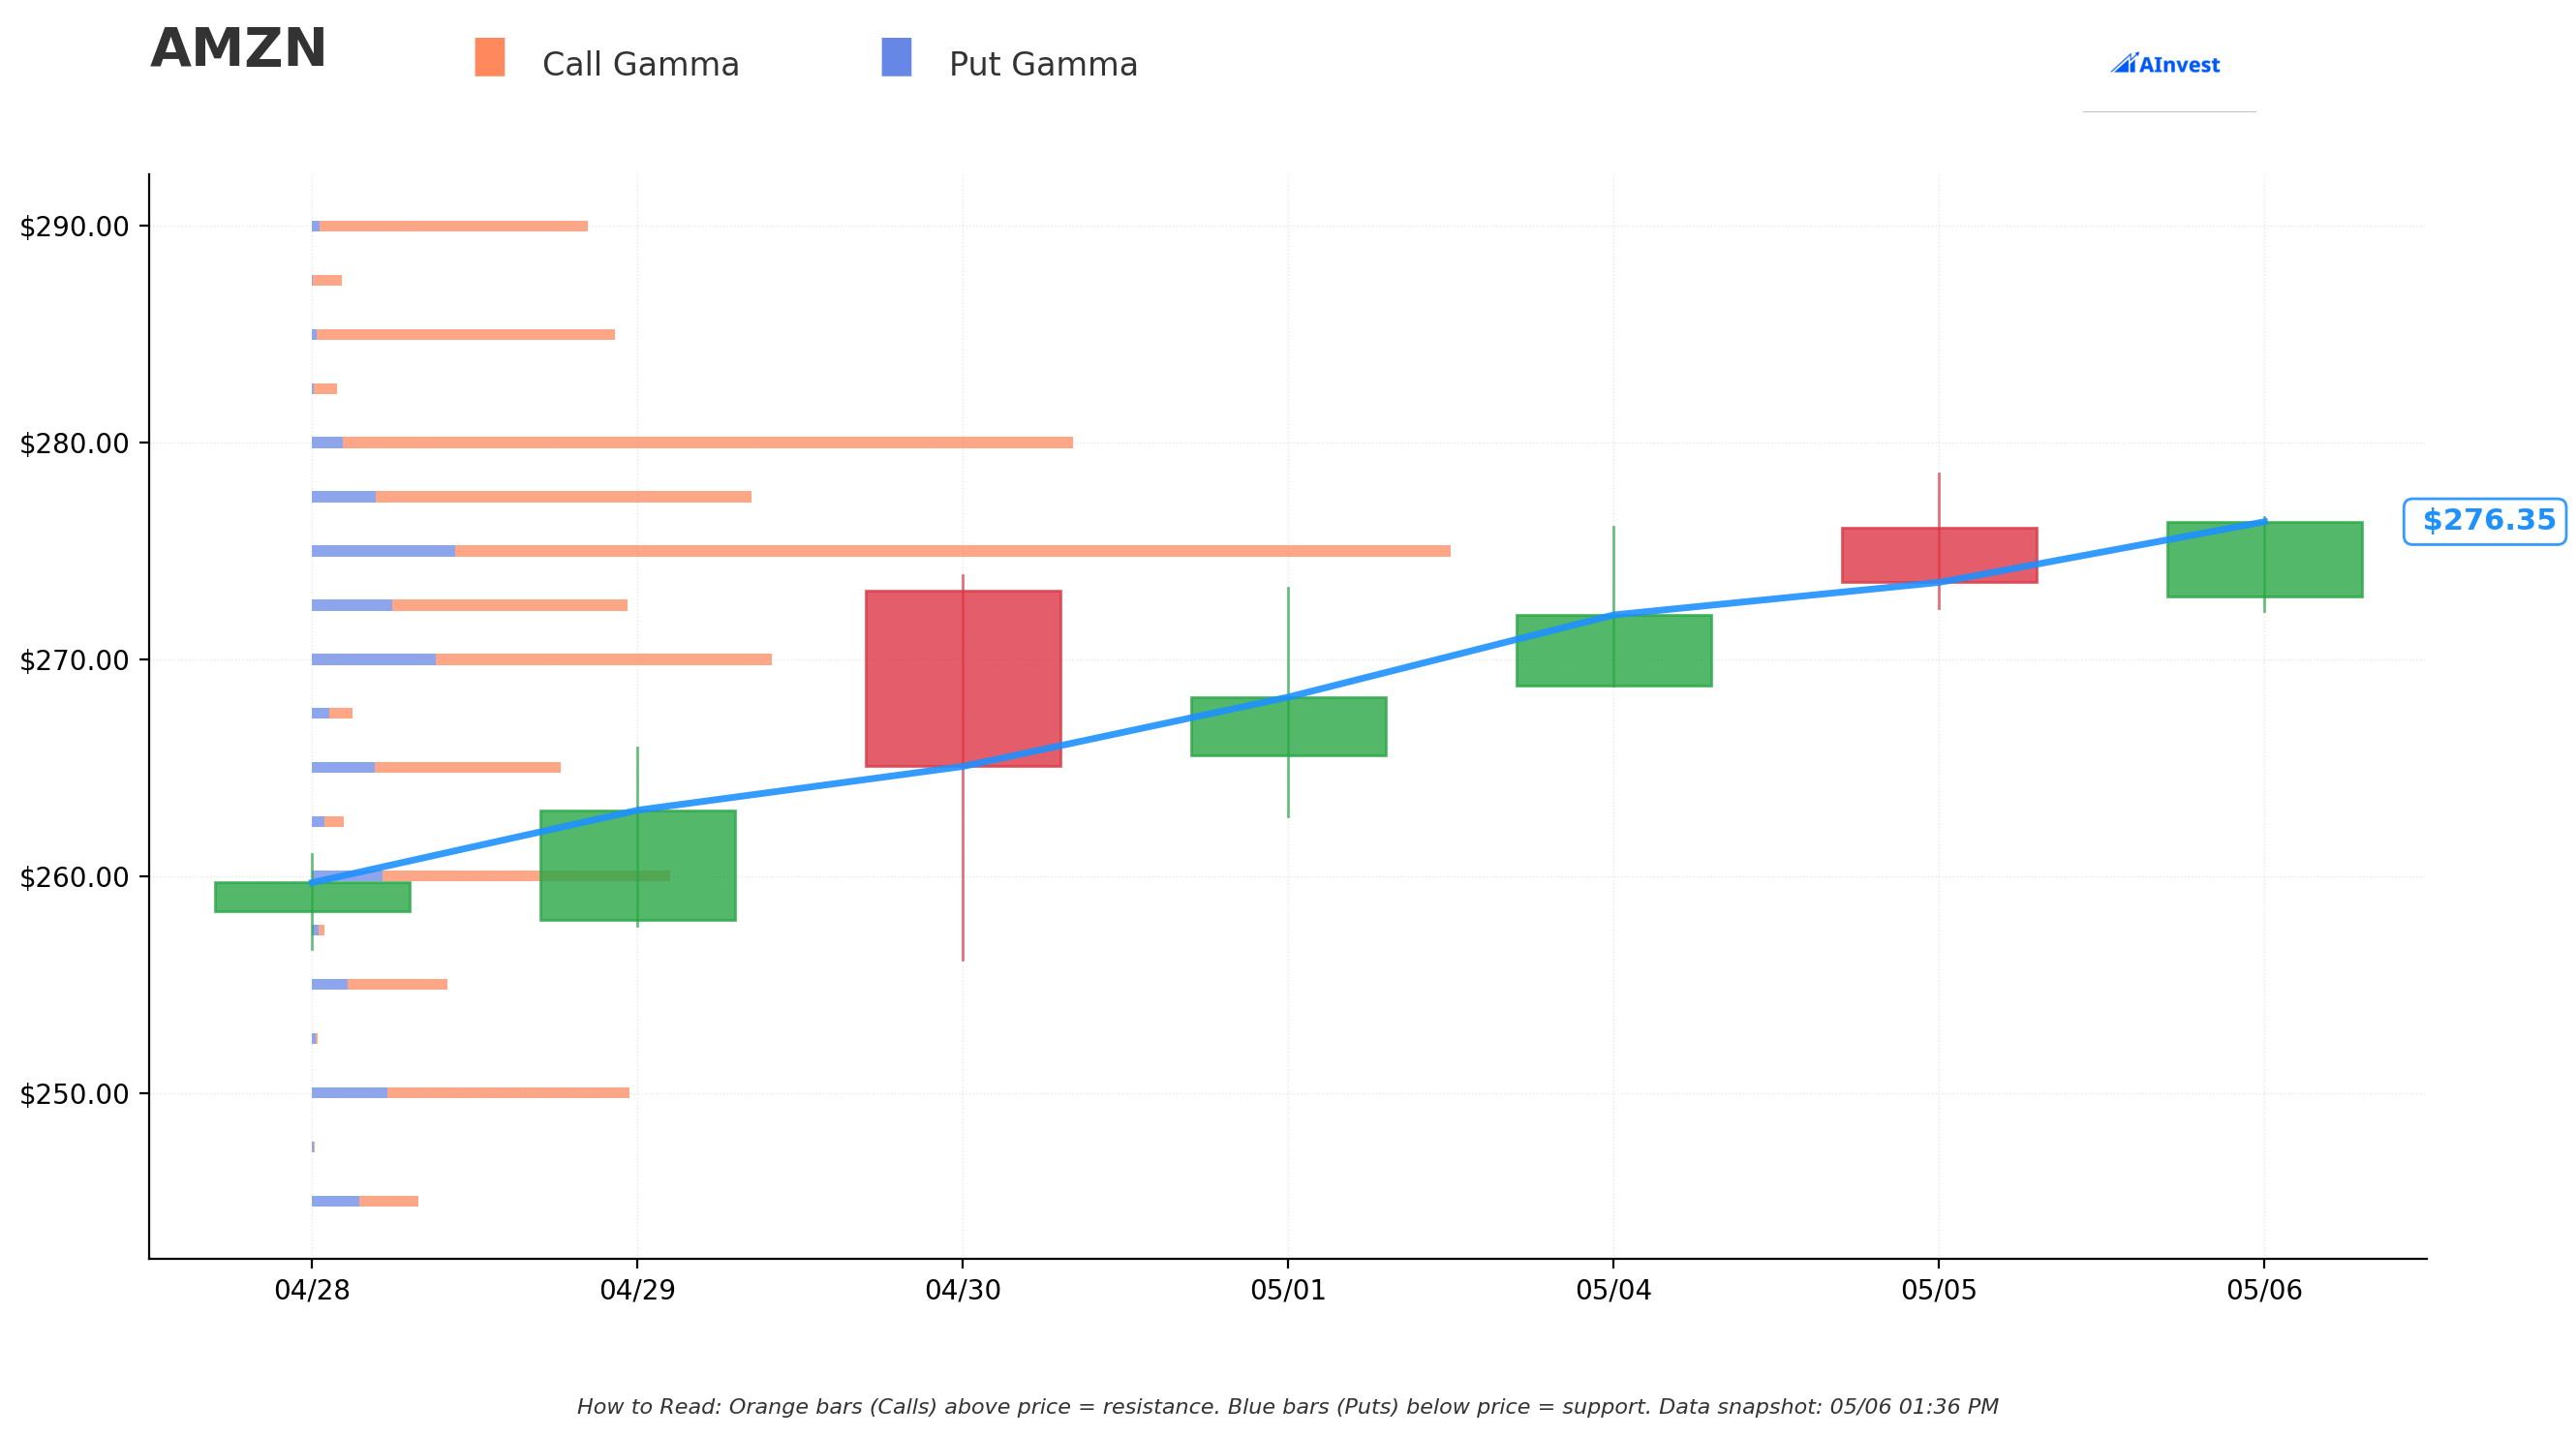
Current Price: $276.38
🔵 Support levels (GEX-based dealer zones):
- $275.00 — net GEX +110.98M, 0.50% below spot ($276.38)
- $272.50 — net GEX +18.66M, 1.40% below spot ($276.38)
- $270.00 — net GEX +28.09M, 2.31% below spot ($276.38)
- $260.00 — net GEX +27.64M, 5.93% below spot ($276.38)
- $250.00 — net GEX +21.45M, 9.54% below spot ($276.38)
🟠 Resistance levels (GEX-based dealer zones):
- $277.50 — net GEX +41.92M, 0.41% above spot ($276.38)
- $280.00 — net GEX +91.64M, 1.31% above spot ($276.38)
- $285.00 — net GEX +38.61M, 3.12% above spot ($276.38)
- $290.00 — net GEX +34.26M, 4.93% above spot ($276.38)
- $300.00 — net GEX +50.84M, 8.55% above spot ($276.38)
With spot at $276.38, the closest GEX wall above is $277.50 (0.41% away) and the closest gamma floor below is $275.00 (0.50% away). Dealers are positioned to dampen volatility around these levels in normal flow.
🎯 Implied Move Analysis
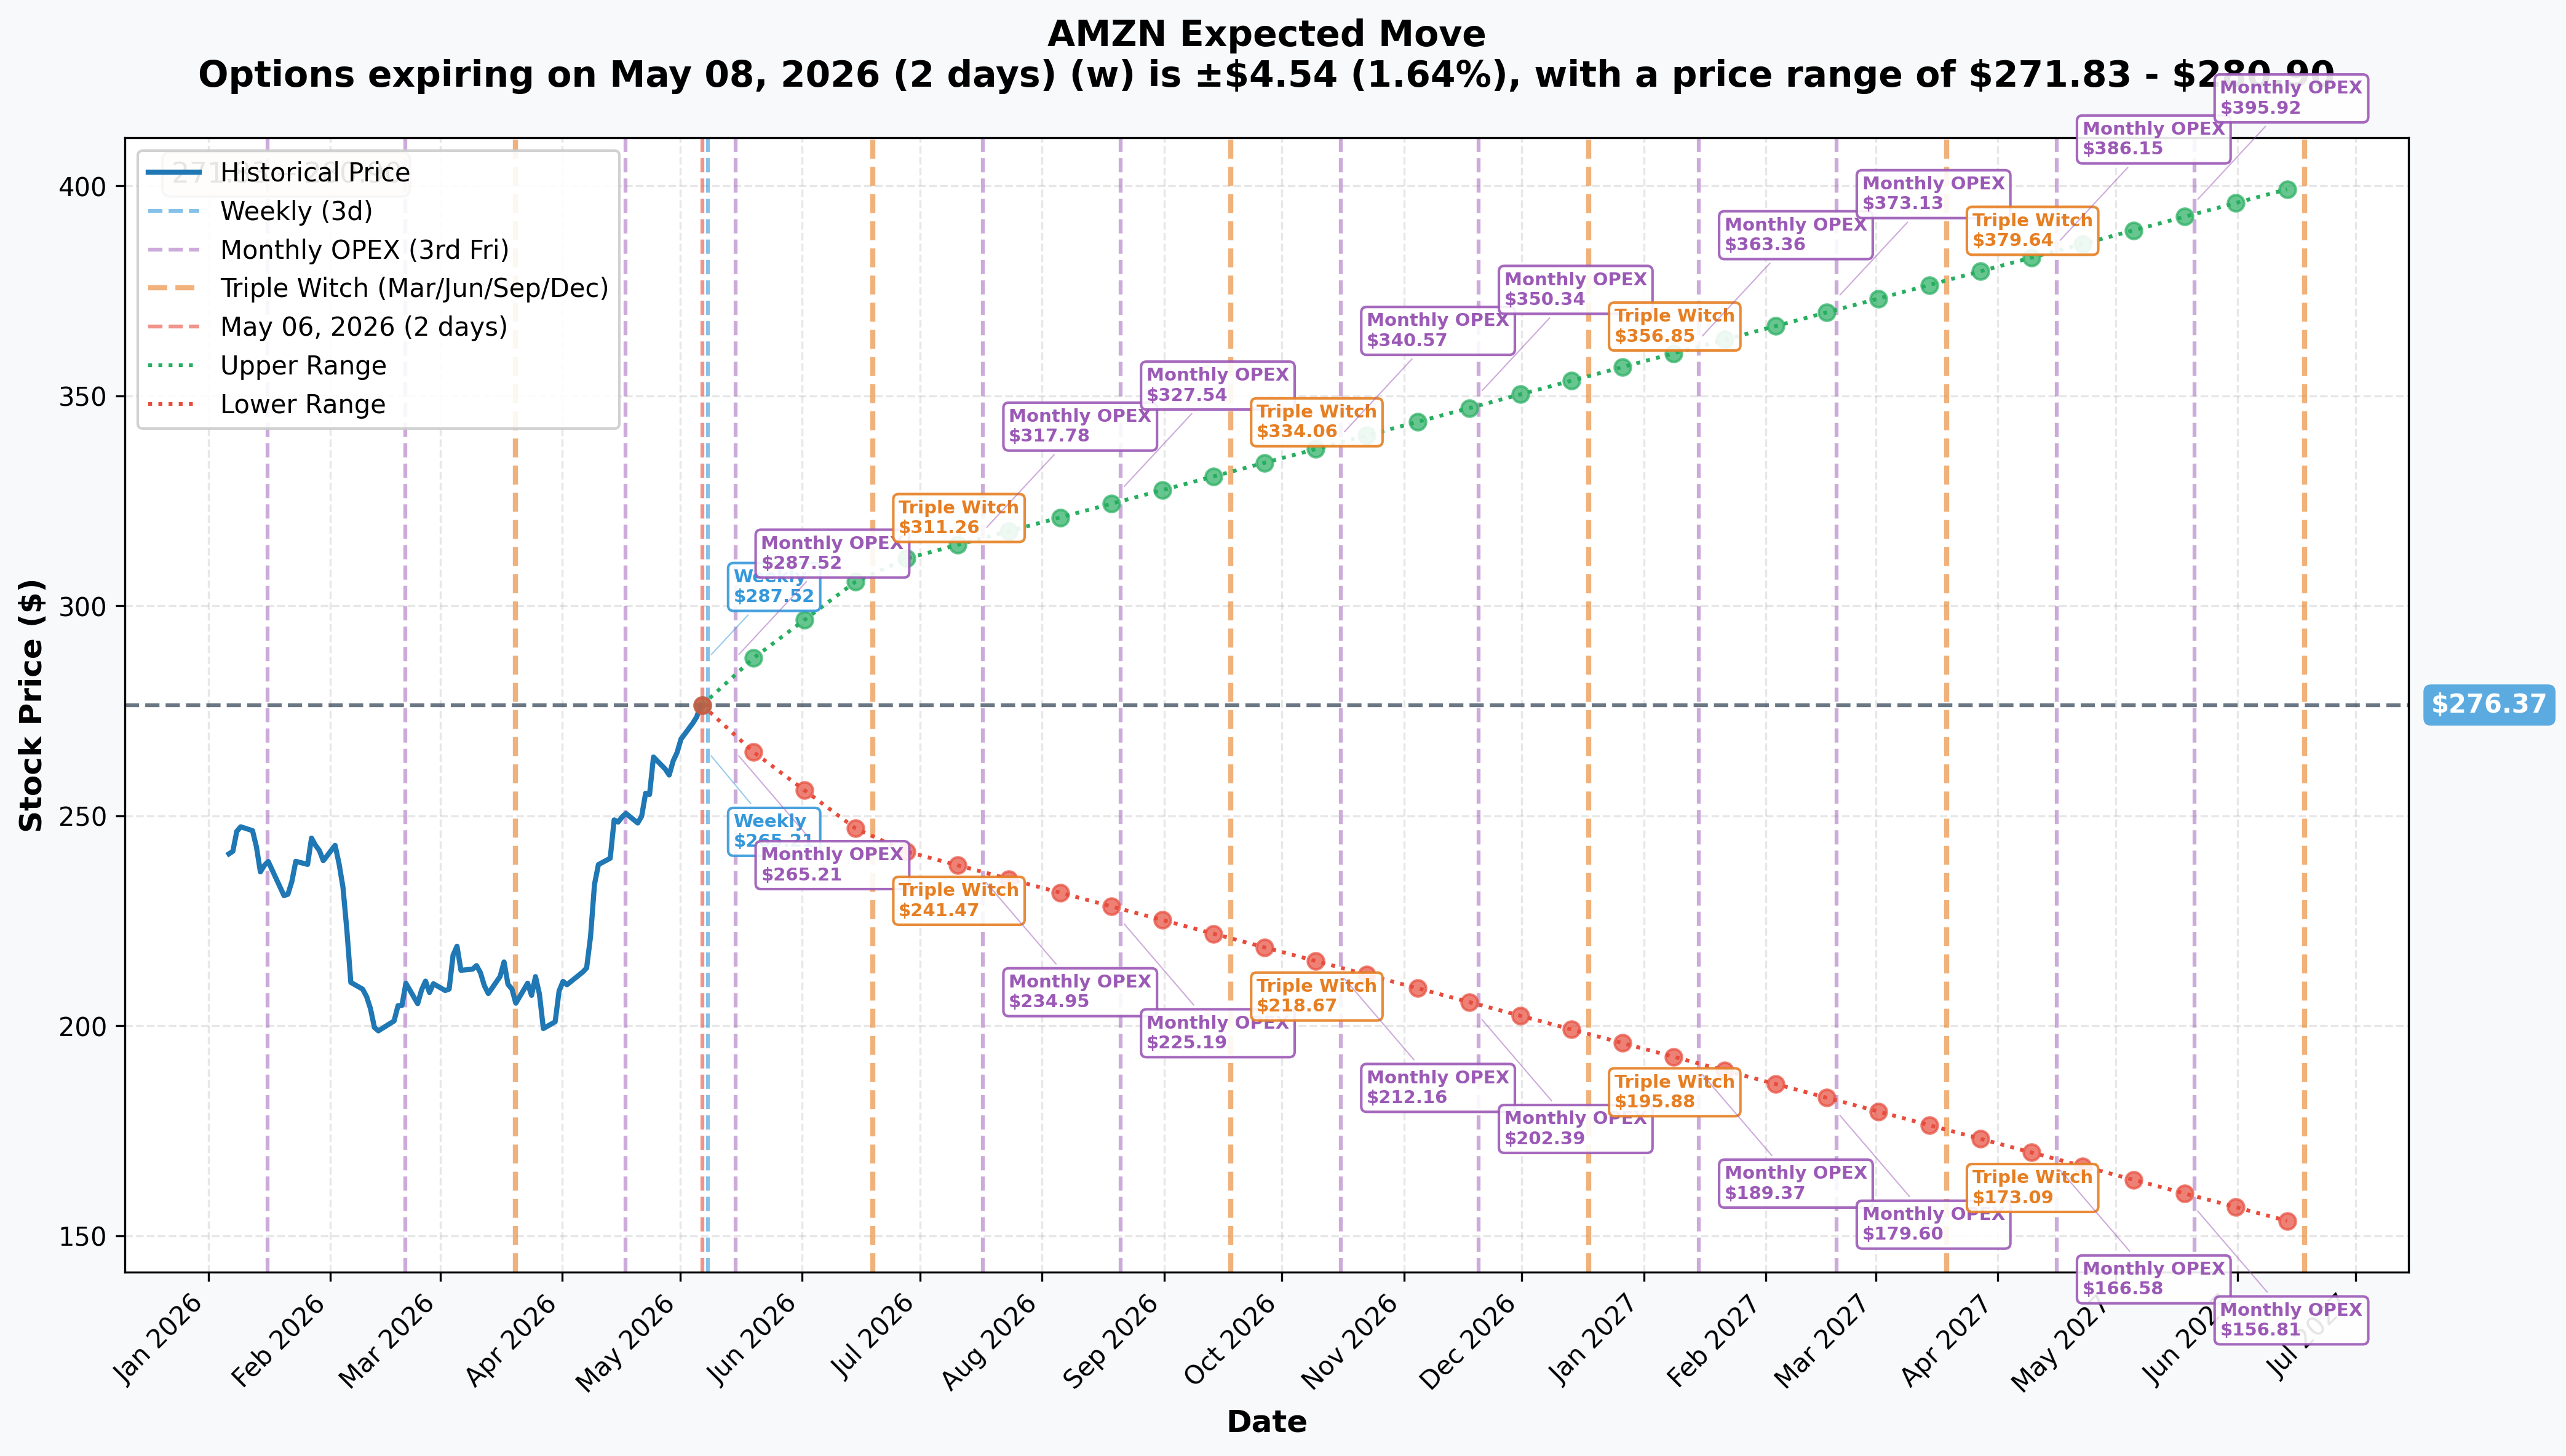
Options market pricing from ~$276.37:
| Expiry | Type | Days | Implied Move | Range |
|---|---|---|---|---|
| 2026-05-08 | Weekly | 2 | ±1.64% / ±$4.54 | $271.83 – $280.90 |
| 2026-05-15 | Monthly OPEX | 9 | ±3.02% / ±$8.35 | $268.01 – $284.72 |
| 2026-06-19 | Quarterly (Triple Witch) | 44 | ±11.90% / ±$32.89 | $243.47 – $309.26 |
| 2027-06-18 | Yearly LEAPS | 408 | ±44.89% / ±$124.07 | $152.30 – $400.43 |
These ranges represent one-standard-deviation moves implied by ATM straddle prices. Roughly 68% of historical outcomes fall inside the band — meaning ~1 in 3 expirations break out of the range. Use these as guideposts, not guarantees.
AMZN's YTD chart tells the story of a stock that absorbed the April macro selloff and recovered sharply into all-time-high territory following the blowout Q1 2026 earnings on April 29. Key observations from the YTD setup:
- The post-earnings reaction moved AMZN to all-time highs. Per 24/7 Wall St., analysts see 20%+ upside even from the post-earnings ATH level — an unusually strong consensus after the stock has already made new highs.
- The $210 short call strike is not arbitrary. At $274.31 spot, the $210 strike represents a level AMZN last traded below during the early April macro selloff. Selling calls at $210 is equivalent to saying "AMZN would need to fall roughly 23% from here before this short call causes problems at expiry" — an enormous embedded buffer. This is consistent with a covered-call or synthetic hedge on a long stock position.
- The $275 long call strike is almost exactly current spot. The buyer of the July 17 $275 calls is not speculating on a distant rally — they are acquiring near-ATM optionality on a stock that is already at all-time highs with a robust fundamental catalyst structure through July.
- Post-Q1 volume profile: Elevated volume following the April 29 print reflects broad institutional accumulation around the AWS reacceleration thesis, per Yahoo Finance. The stock is at highs on high volume — distribution has not emerged.
📰 Catalysts
✅ Recent Events (Already Happened)
Q1 2026 Earnings — April 29, 2026 (Monster Beat)
Amazon's Q1 2026 print was a clean blowout across every segment:
- Total Revenue: $181.5B (+17% YoY) vs. $177.3B consensus — a $4.2B beat
- EPS: $2.78 vs. $1.64 consensus — a 69% beat per CNBC and the earnings call transcript
- AWS: +28% YoY to $37.59B with a 37.7% operating margin — the fastest growth in 15 quarters; AWS AI revenue now at a $15B+ run rate per Converge Digest
- Advertising: +24% YoY to $17.24B — beating the 21.2% consensus per CNBC
- North America: +12% YoY to $104.1B; International: +19% YoY to $39.8B per About Amazon
- Capex: $44.2B in Q1 alone vs. $25B in Q1 2025 — pacing toward the ~$200B 2026 program per Sherwood News
This is the fundamental anchor for everything the diagonal spread is positioned around: a business firing on all cylinders, running the fastest AWS growth rate in nearly four years, and guiding Q2 revenue of $194–199B above the prior $188.9B consensus.
Anthropic Expansion — April 20, 2026 ($25B Investment)
Amazon committed up to $25B in additional investment in Anthropic ($5B immediately + $20B tied to milestones), on top of the $8B already invested. In return, Anthropic committed $100B+ in AWS spend over 10 years and up to 5 GW of Trainium compute per GeekWire. This deal locks in approximately $10B/year in long-duration AWS revenue from a single marquee AI customer — structurally additive to the AWS growth rate narrative that is the core bull thesis.
This followed Amazon's earlier $50B OpenAI cloud deal signed two months prior per GeekWire — between the two, AWS has locked in approximately $150B+ in committed AI workload revenue from two of the three largest frontier AI labs.
Trainium 3 and Custom Silicon at $20B Run Rate
Amazon's chip business (Graviton, Trainium, Nitro) is now one of the top 3 datacenter chip businesses globally at a $20B+ run rate growing triple digits, with $225B+ in Trainium revenue commitments outstanding per The Register. Trainium 3 — 30–40% more price-performant than Trainium 2 — began shipping in early 2026 and is nearly fully subscribed. This segment is a genuine multi-year revenue driver that was not meaningfully in consensus estimates 12 months ago.
$200B 2026 Capex Commitment
CEO Andy Jassy reaffirmed the ~$200B capex target for 2026 (up from $131.8B in 2025), the majority directed toward AWS data centers, power infrastructure, chips, and networking per Bloomberg. This capex level is a double-edged sword: it signals deep conviction in demand visibility, but it has already compressed 2025 free cash flow to $7.7B from $32.9B in 2024 per Converge Digest.
🔮 Upcoming Catalysts — Why the Whale Wants July
Q2 2026 Earnings — July 30, 2026 (After Market Close) ← STRUCTURAL CATALYST
The July 17 long call expires 13 days before Q2 earnings — close enough to capture the pre-earnings IV expansion and any rally into the print, without being exposed to the post-earnings binary itself. Key metrics to watch when Q2 reports on July 30:
- Company guidance: Net sales $194–199B (+16–19% YoY), operating income $20–24B per About Amazon Q1 release
- Consensus: Revenue ~$188.9B (already well below guidance midpoint), EPS $1.81 per Sherwood News
- Key sub-metrics: AWS growth rate (sustaining 28%+), AI revenue run-rate trajectory, capex pacing vs. FCF recovery, Trainium 3 commercialization, Amazon Leo launch cost ramp
Amazon Prime Day — June 2026
Confirmed for June in the US and 21 other markets (July in Australia, Brazil, Japan, India), per About Amazon and NBC News. The earlier-than-typical June timing — traditionally July — aligns with back-to-school retail cycles and should provide a North America segment uplift that flows through Q2 revenue and operating income. The July 17 long call is positioned directly over the post-Prime-Day analyst commentary window.
Amazon Leo Commercial Service Launch — Mid-2026
CEO Jassy confirmed in his shareholder letter that consumer Amazon Leo service launches mid-2026 across five markets, with 302 production satellites already in orbit. Mission LA-05 deployed 29 additional satellites on April 4, 2026 per Cape Canaveral Today. The initial commercial launch is a sentiment catalyst — a new service category that validates the multi-year capex investment thesis.
FCC Deadline Decision — July 2026
Amazon filed in January 2026 for an extension of the FCC's 1,600-satellite milestone deadline (currently July 2026) to 2028; only ~700 satellites are projected to be operational by the original deadline per Wikipedia/Amazon Leo. The FCC ruling probability is the key regulatory variable for the Leo program. A granted extension removes a binary overhang; a denial could create headline risk on the Leo narrative without affecting core business fundamentals.
Analyst Consensus and Price Target Distribution
- Stifel (May 1, 2026): Buy, $319 PT (~16.3% upside) per Benzinga
- Wells Fargo: $307 PT per Benzinga
- Consensus PT: $312.11 based on 36 analysts (range $175–$370), with 41 analysts at Buy/Strong Buy per MarketBeat and Public.com
- The $312 consensus represents approximately 13.8% upside from the $274.31 execution price — well above the $290.18 breakeven on the July 17 $275 calls
AWS re:Invent 2026 — Late November/Early December
Not within the July 17 expiry window, but the annual AWS cloud conference typically delivers major Trainium, Bedrock, and customer-deal announcements. Speculation on re:Invent announcements historically starts filtering into AWS sector discussions by Q3 — providing a forward narrative tailwind to the July long call window.
🎲 Scenario Analysis Through May 15 and July 17
The diagonal structure has two sequential phases, each with distinct outcome pathways.
Phase 1: May 15 OPEX — What Happens to the Short $210 Call
With AMZN at $274.31 and the $210 strike $64.31 in-the-money, there are only two meaningful outcomes for the May 15 short call:
Outcome A — AMZN stays above $210 at May 15 OPEX (overwhelmingly likely):
The short $210 call expires deep ITM. The position is either:
- Assigned: Trader delivers shares at $210, well below market. Only logical if they own the shares (covered call). The "loss" on assignment is offset by the $64.50/contract premium already collected — the effective sale price was $210 + $64.50 = $274.50, approximately current market price. This is a synthetic exit of the long stock position at today's price — a rational decision to monetize a large equity position while keeping the July $275 call as a participation vehicle.
- Bought to close: Trader pays near-intrinsic value to close the short call, netting the time-value decay (~$0.50/contract on 9 DTE deep-ITM calls). The $60M credit becomes ~$60M minus the closing cost — effectively neutral with a slight credit remaining. The $46M net credit (after the July debit) is locked in.
Outcome B — AMZN falls below $210 at May 15 (very unlikely: requires ~23% crash in 9 days):
The short $210 call expires worthless. The full $60M credit is retained. The July $275 call becomes an OTM position with no current value. This outcome would require an extraordinary, company-specific disaster — not a scenario the options market or any fundamental analyst is pricing as material.
Phase 2: Through July 17 — What the Long $275 Call Does
With the near leg resolved, the diagonal reduces to a long position in 9,500 July 17 $275 calls.
📉 Bear Case (20% probability) — "AMZN Pulls Back; Rally Stalls Below $275"
Target: AMZN below $275 at July 17 expiry
For the July $275 calls, any close below $275 at July 17 expiry means the $14M debit is lost. However, the trader has already collected $46M net credit upfront — so the overall diagonal is still profitable by $32M even if the long leg expires worthless entirely.
What drives this:
- Capex concern resurfaces: If Q2 operating income guidance comes in below $20B or FCF trajectory commentary disappoints, multiple compression could push AMZN back below prior support levels
- Azure competition accelerates: If Microsoft Azure reports 35–40% cloud growth at its next print, the market begins pricing AWS deceleration risk into AMZN's multiple, capping the rally
- Amazon Leo cost drag: The ~$1B YoY incremental Leo cost cited in Q2 guidance per Sherwood News could be a narrative negative if commercial revenue underwhelms at launch
- FCC rejection of Leo deadline extension: A surprise regulatory negative on the Leo program could weigh on sentiment without affecting core fundamentals — a short-term headline risk
What happens to the diagonal: Maximum loss on the long July $275 leg is the $14M debit. But the $46M net credit from the diagonal initiation means the trader is still net +$32M even in this scenario. The diagonal was structured as a net-credit position precisely to survive this outcome.
Probability: 20%. Amazon is at all-time highs with the strongest AWS quarter in 15 periods, Q2 guidance above consensus, and a consensus $312 price target. A pullback to below $275 by July 17 requires either macro deterioration or a fundamental miss that contradicts the Q1 setup.
🎯 Base Case (55% probability) — "AWS Momentum Sustains; AMZN Grinds to $280–295"
Target: AMZN at $280–295 at July 17 expiry
This is the most likely outcome given the fundamental setup and the trajectory of the Q2 guidance narrative.
The most likely path:
- May 15 OPEX: May $210 short call resolves (assignment or buyback near intrinsic); the $46M net credit is effectively crystallized
- June: Prime Day drives North America segment strength; analyst commentary upgrades flow on the back of better-than-expected retail metrics; AWS sentiment remains elevated on the Anthropic/OpenAI committed-revenue narrative
- Late June/early July: Pre-earnings IV expansion begins on the July 30 Q2 print; the July 17 $275 calls benefit from both price appreciation and rising implied volatility as the earnings date approaches
- AMZN grinds to $280–295: the $275 calls accumulate $5–20 of intrinsic value plus remaining time value; the trader can exit the July leg for a meaningful gain
P&L on the July $275 calls at expiry (standalone, after $46M net credit already booked):
| AMZN at July 17 | Long July $275C Value | Net P&L on Long Leg |
|---|---|---|
| $275.00 | $0.00 | -$14M (full debit lost) |
| $280.00 | ~$5.00/share = $4.75M | -$9.25M (partial recovery) |
| $285.00 | ~$10.00/share = $9.5M | -$4.5M |
| $290.18 | ~$15.18/share = $14.42M | Breakeven on long leg |
| $295.00 | ~$20.00/share = $19.0M | +$5.0M profit on long leg |
| $300.00 | ~$25.00/share = $23.75M | +$9.75M profit on long leg |
| $312.11 (consensus PT) | ~$37.11/share = $35.2M | +$21.2M profit on long leg |
Overall diagonal P&L in base case (adding $46M net credit):
At $285 AMZN at July 17, the overall diagonal nets approximately +$41.5M ($46M credit minus $4.5M partial loss on long leg). At $295, the overall diagonal nets approximately +$51M. At the consensus PT of $312, the diagonal nets approximately +$67.2M.
Probability: 55%. The Q2 guidance midpoint of $196.5B is already above prior consensus, AWS is running at its fastest pace in four years, and the catalyst density (Prime Day, Leo launch, Anthropic ramp, analyst upgrades) provides multiple potential re-rating events over the 72-day window.
📈 Bull Case (25% probability) — "AWS Re-Acceleration + Anthropic Flywheel; AMZN Moves to $300+"
Target: AMZN at $300–320+ at July 17 expiry
If the June/July period includes positive surprise on AWS re-acceleration commentary, early Leo commercial traction, or a Trainium milestone announcement, the $275 calls become highly profitable.
What drives this:
- AWS sustains 28%+ growth: Any commentary from AWS partners or conference appearances confirming that cloud demand is accelerating rather than plateauing would reprice AMZN toward the $320 upper end of analyst targets
- Anthropic $20B milestone tranche pulled forward: The first commercial milestone payment on the $20B Anthropic tranche, triggered earlier than expected, would be a material cash-flow-positive signal and validate the $100B/10-year committed revenue narrative per CIO Dive
- Trainium 3 fully subscribed commentary: $225B+ in Trainium revenue commitments becoming "oversubscribed" for the first time — validating Amazon's custom silicon business at the level where analysts begin applying a standalone multiple to it
- Amazon Leo successful commercial launch in 5 markets: Initial subscribers, pricing data, and coverage area establish the service as a genuine Starlink competitor — a new TAM that is not currently in any sell-side model
- Q1 earnings follow-on analyst upgrades pushing consensus toward $330–350: Several analysts were already at $319–370; a strong Prime Day print in July could catalyze the higher-target camp to upgrade from Buy to Strong Buy with revised PTs
P&L on the July $275 calls in the bull case (standalone):
| AMZN at July 17 | Long July $275C Value | Net P&L on Long Leg |
|---|---|---|
| $300.00 | ~$25.00/share = $23.75M | +$9.75M profit |
| $310.00 | ~$35.00/share = $33.25M | +$19.25M profit |
| $320.00 | ~$45.00/share = $42.75M | +$28.75M profit |
| $330.00 | ~$55.00/share = $52.25M | +$38.25M profit |
Overall diagonal P&L in the bull case ($46M net credit added):
At $310 AMZN at July 17 expiry, the overall diagonal nets approximately +$65.25M on a $14M debit outlay — the $46M credit makes the net credit trade "free" on the upside. Every dollar above $275 at July 17 is incremental profit on top of the already-booked $46M.
Probability: 25%. Requires either a macro re-rating of large-cap tech or specific AMZN catalysts (Leo traction, AWS acceleration signal, Trainium milestone) to materialize in the June–July window — plausible but requires multiple things to go right simultaneously.
💡 Three Trading Ideas
Idea 1 — Conservative: Replicate the July $275 Long Call Structure at Retail Scale
The "Align with the Back Leg" Play
The most straightforward way to express the same near-ATM bullish thesis without the complexity of the full diagonal: buy July 17 $275 calls outright, aligned with the whale's back leg, at a retail-appropriate position size.
Structure: Buy 1–5 AMZN July 17 $275 calls as a standalone directional position
Rationale:
- The whale paid $15.18/contract for these calls with AMZN at $274.31 — an near-ATM call with 72 DTE and a $275 strike just $0.69 OTM
- The near-ATM positioning means this is not a speculative lottery ticket but a relatively high-probability directional bet: with delta estimated at approximately 0.47–0.52, the call profits roughly $0.47–0.52 for every $1 AMZN moves up
- The 72-day expiry covers the entire June Prime Day window, the Amazon Leo commercial launch, and the pre-Q2 earnings IV expansion period — three distinct catalysts that could each individually move AMZN toward the $290 breakeven
- The consensus analyst PT of $312 is $21.82 above the $290.18 breakeven; at $312 AMZN at expiry, the July $275 calls would be worth ~$37/contract — more than a 2.4x return on the estimated $15.18 entry cost
- The whale's $14M allocation to these calls signals institutional confidence in this specific strike/expiry combination post-Q1 blowout
Entry considerations:
- Enter on any near-term weakness below $275 (ideally $270–273) where IV is not elevated; a dip to $270 would move the $275 call to $0.69 OTM vs. $0.69 OTM at $274.31 spot — same profile but potentially lower IV and therefore lower premium
- Avoid buying on a strong gap-up day where near-ATM IV has spiked on the day's move; wait for IV to settle
- A reasonable target for partial profit-taking: if AMZN moves to $285–290 in the next 3–4 weeks, consider selling half the position to lock in gains while letting the remainder run into the July 30 earnings buildup
Risk parameters:
- Maximum loss: Premium paid per contract (~$1,518 estimated at $15.18/contract — verify current market pricing)
- Maximum profit: Uncapped above $275 at July 17 expiry, minus premium paid
- Breakeven at expiry: approximately $290.18 per share
- Position sizing: 1–5 contracts per $5–10K of speculative capital; this is a defined-risk directional bet
Risk level: Moderate-High (options premium fully at risk if AMZN fails to move above $290.18 by July 17) | Who this is for: Directional bulls on AMZN post-earnings who want to participate in any sustained rally toward or above the consensus PT with fully defined maximum loss
Idea 2 — Balanced: Bull Call Spread $275/$300 for July 17 — Defined-Risk Earnings Buildup Play
The "Finance the Long with a Partial Upside Cap" Play
Instead of owning the July $275 call outright, reduce the net debit substantially by selling a $300 call against it. The $300 level captures the consensus PT zone while providing meaningful premium offset.
Structure:
- Buy AMZN July 17 $275 call (long leg — at-the-money directional exposure)
- Sell AMZN July 17 $300 call (short leg — caps upside at $300 but reduces cost significantly)
Rationale:
- The $275/$300 bull call spread is a $25-wide spread that profits maximally if AMZN closes at or above $300 at July 17 expiry — within the analyst consensus PT range of $307–$319 at multiple major firms
- The $300 short call provides meaningful premium offset: with 72 DTE and AMZN at $274.31, the $300 strike (9.4% OTM) carries significant time value. The net debit on the spread is estimated at approximately $7.50–$9.00 (vs. $15.18 for the outright July $275 call) — a roughly 40–50% reduction in premium outlay
- Maximum profit on the spread: $25 width minus net debit paid = approximately $16–$17.50 per spread — an estimated 183–233% return on the net debit if AMZN is at or above $300 at July 17 expiry
- The $300 cap is generous: even the more conservative analysts (Wells Fargo $307, Stifel $319) see AMZN trading above $300 within 12 months. Capping at $300 for July 17 expiry sacrifices upside above $300 but maintains the full $25 of spread value for the most likely base-case range of $285–$310
Estimated P&L at July 17 expiry:
| AMZN at July 17 | Spread Value | Estimated Net P&L (vs. ~$8.25 debit) |
|---|---|---|
| Below $275 | $0.00 | -$8.25 (maximum loss) |
| $280.00 | ~$5.00 | -$3.25 (partial loss) |
| $283.25 (breakeven) | $8.25 | Breakeven |
| $290.00 | ~$15.00 | +$6.75 profit (+82%) |
| $295.00 | ~$20.00 | +$11.75 profit (+142%) |
| $300+ | $25.00 (max) | +$16.75 profit (+203%) |
Entry considerations:
- Execute as a single spread order (buy $275C / sell $300C simultaneously) to capture the net debit without leg risk
- A move to $280–283 AMZN before entry reduces the spread debit (the $275 call gains intrinsic, the $300 call remains OTM and loses time value) — any early rally improves the entry cost on the spread
- Consider entering 4–6 weeks before July 30 earnings (approximately June 1–15) when pre-earnings IV premium begins building into the July series
Risk parameters:
- Maximum loss: Net debit paid (~$825 estimated per 1-contract spread — verify current pricing)
- Maximum profit: $25 spread width minus net debit = approximately $1,675 per 1-contract spread (~203% return)
- Breakeven at July 17: approximately $283.25 per share (long strike + net debit)
- Position sizing: 5–15 spreads per $5K of speculative capital; maximum loss is net debit × number of spreads
Risk level: Moderate (defined maximum loss, strong fundamental support) | Skill level: Intermediate | Who this is for: Traders who want to express AMZN upside into Prime Day and the pre-Q2-earnings window with a significantly reduced premium outlay relative to outright long calls, and who are comfortable accepting a $300 cap on their upside
Idea 3 — Aggressive: Short May $260 Put — Income Against a Pullback You Would Buy
The "Get Paid to Own AMZN at a Discount" Play
Rather than reaching for upside, this idea monetizes the elevated implied volatility by selling a put at a level where a rational investor would be comfortable buying AMZN stock outright.
Structure: Sell 1–5 AMZN May 15 $260 puts (cash-secured or margin-based) | collect premium upfront for 9 days of put exposure
Rationale:
- With AMZN at $274.31, the $260 put is approximately $14.31 OTM (5.2% below spot). Given that AMZN is at all-time highs following a monster earnings beat with AWS at 15-quarter-high growth, a pullback to $260 in 9 days is an above-average-severity scenario — not a black swan, but a meaningful negative event
- Selling the $260 put collects premium (estimate $3–5/contract at current IV with 9 DTE — verify current market). If AMZN stays above $260 through May 15, the full premium is retained
- The trade is structurally an expression of the same view as the whale's diagonal: AMZN is not going to fall dramatically from here given the Q1 beat and Q2 guidance. If you are wrong and AMZN falls to $260, you are obligated to buy shares at $260 — approximately 5.2% below current market, which most AMZN bulls would welcome as a discount entry after a Q1 blowout
- Effective cost basis if assigned: $260 - premium received = approximately $255–257/share — a roughly 6.3–7% discount to the execution-day price of $274.31
- The $200B capex year compressing FCF is the primary fundamental risk; if macro deteriorates and the market reprices AMZN's 2026 earnings multiple, $260 could be tested. This is the scenario where the put seller absorbs a mark-to-market loss — but they own one of the world's highest-quality businesses at a post-earnings-beat discount
Risk parameters:
- Maximum profit: Premium collected per contract (~$300–$500 estimated for 9 DTE — verify current pricing)
- Maximum loss: Assignment at $260 per share minus premium received. If AMZN trades to $230, the effective loss per contract is ($260 - $230 - premium) = approximately $27–$29/contract. This requires securing full capital to buy 100 shares at $260 per contract ($26,000 per contract of capital commitment)
- Breakeven at May 15 expiry: $260 minus premium received (approximately $255–257)
- Position sizing: 1–2 contracts per $26,000 of available capital; this is a cash-secured put that requires meaningful capital against the potential assignment
Important constraint: This trade requires either (a) cash-secured capital of $26,000 per contract (full purchasing power for 100 AMZN shares at $260), or (b) margin account with sufficient buying power. It is not appropriate for traders who cannot actually afford to own AMZN shares at the $260 strike price. The risk is owning AMZN stock — which most AMZN bulls view favorably — not a pure premium loss like a long call.
Entry timing: Enter immediately (9 DTE is the target window for maximum theta decay per day on OTM puts). Each day closer to May 15 OPEX where AMZN stays above $260 earns a larger fraction of the maximum potential profit from accelerating theta decay.
Risk level: Moderate (limited to stock ownership if assigned; requires substantial capital per contract) | Who this is for: Income-oriented traders or long-term AMZN bulls who want to be paid for their willingness to own AMZN at a discount to today's price, and who have the capital available to take assignment if required
⚠️ Key Risk Factors
This analysis would be incomplete without a candid accounting of the risks that could undermine the $46M diagonal structure.
-
May 15 short call assignment risk is real. With the $210 strike $64.31 in-the-money, assignment is the expected outcome at expiry if the trader does not actively close the short call. This only makes economic sense if they own the shares — if they do not, the P&L on assignment is a realized loss. The assumption throughout this analysis is that this is a covered-call or synthetic hedge structure on an existing equity position.
-
$200B capex is destroying free cash flow. FCF fell from $32.9B (2024) to $7.7B (2025) — a 77% decline — as the capex program scaled up per Converge Digest. If capex does not produce visible revenue acceleration in 2026, multiple compression could cap AMZN's appreciation and make the $290.18 breakeven on the July calls difficult to achieve before expiry.
-
Azure competition is narrowing the AWS growth gap. Azure grew 31–40% YoY in FY26 Q2 per CNBC, while AWS ran at 28%. If Azure sustains or accelerates this growth differential into the Q2 Amazon print (July 30), the market may begin pricing AWS market share loss — a narrative shift that would pressure AMZN's AI-driven multiple.
-
Amazon Leo adds cost before revenue. Q2 guidance already includes ~$1B YoY incremental cost from Leo satellite manufacturing and launches per Sherwood News. The commercial launch is a narrative catalyst but will not contribute meaningful revenue in 2026 — meaning the cost drag is real and recurring while revenue is speculative.
-
Anthropic concentration is a double-edged sword. The $25B investment + $100B committed revenue ties Amazon's AI growth narrative heavily to a single customer/partner. Some investors flag this as circular — Amazon investing in a company that commits to buy Amazon infrastructure, creating revenue that partially offsets the investment cost per Productive AI.
-
FCC denial of Leo deadline extension could create headline risk. If the FCC rejects Amazon's extension request for the 1,600-satellite milestone (currently due July 2026), Amazon could face license-loss exposure on the original mandate per Wikipedia/Amazon Leo. This would not affect AWS or retail fundamentals but could create a sentiment negative that weighs on the stock during the July 17 long call window.
-
Implied volatility crush post-earnings. The July 17 long calls were purchased at a volatility level elevated by the post-Q1 earnings premium. If AMZN drifts or consolidates into July 30 Q2 earnings rather than rallying, the long $275 calls could lose value through IV normalization even if the stock holds flat near $275. The 72-day theta and vega exposure creates a non-trivial carry cost.
-
Macro/tariff sensitivity on retail margins. North America retail margin remains sensitive to tariff policy and consumer demand per About Amazon. Any deterioration in the tariff environment or consumer confidence data in May–July could weigh on the retail segment, even as AWS maintains momentum.
-
FX headwind in Q2 guidance. Q2 guidance already bakes in approximately 10 bps of FX drag per About Amazon. Dollar strength through the period could incrementally compress international revenue relative to guidance.
🎯 The Bottom Line
At 11:10:27 AM on May 6, 2026, an institution executed a $46 million net-credit diagonal call spread on Amazon — selling 9,400 deep-in-the-money May 15 $210 calls for a $60 million credit while simultaneously buying 9,500 near-ATM July 17 $275 calls for $14 million. This is one of the largest single-trade options structures seen on AMZN in recent months, and the strategic message layered within it is nuanced.
The near leg — selling $210 calls 9 days from expiry when spot is at $274.31 — is almost certainly the synthetic covered-call component of a large equity position. No rational institutional participant short-sells a call $64 deep in the money unless they own the underlying or have a delta hedge in place. The $60M credit collected is not "free money" — it comes with the obligation to deliver shares at $210, or to close the short call near intrinsic value. The economic logic is that of a cash and carry: capture the current intrinsic value of the ITM call while retaining forward optionality through the back leg.
The back leg — buying $275 calls with 72 days to expiry and nearly ATM positioning — is the pure-expression bullish statement. With AMZN's consensus PT at $312, AWS running at its fastest pace in four years, Prime Day in June, the Leo commercial launch mid-year, and Q2 earnings on July 30 already guided above consensus, the $275–$290 zone is not a heroic target. It is the midpoint of the expected near-term trading range.
The $46M net credit structure is the institutional equivalent of saying: I own this stock, I am willing to let it be called away at $210 if the near-term pullback materializes (highly unlikely given $274 spot), and I am willing to spend $14M of my $60M credit haul to maintain optionality on any extension to $275+ through July. The credit pays for the call. The call buys participation in the upside that the credit surrenders.
For AMZN long holders: The Q1 beat was not a "one good quarter" story — it was the fastest AWS growth in 15 quarters, a 69% EPS beat, and a Q2 guidance midpoint $7.5B above prior consensus. The whale's diagonal reflects exactly this assessment: be positioned, generate income, stay long optionality. If you own the stock, writing deep-ITM calls to finance OTM July exposure is a textbook way to monetize current intrinsic value while maintaining your seat at the table for any continuation rally.
For bullish options traders: The three trading ideas above express the same underlying conviction at different risk and cost levels — from the outright July $275 call aligned with the whale's back leg, to the $275/$300 bull call spread that reduces premium outlay by 40–50%, to the May $260 put sale that generates income for AMZN bulls willing to own the stock at a 5%+ discount. All three express the same view: Amazon's post-Q1 fundamental picture is intact, the catalyst pipeline through July 17 is rich, and the stock deserves to trade toward and above its consensus PT of $312.
For observers: A trader with sufficient institutional scale to write $60 million in deep-ITM short calls simultaneously paired with a $14 million near-ATM long position is not making a casual directional bet. This is structured risk management at scale — the $46M net credit is the income engine, the July $275 calls are the participation vehicle, and the paired execution at 11:10:27 AM is the signature of an institution that already owns AMZN equity and is managing the risk/reward of that position with derivatives precision.
Key dates to watch:
- May 15, 2026 — Monthly OPEX: May $210 short call resolved (assignment or buyback near intrinsic); near leg of diagonal closed; full $46M net credit effectively crystallized
- June 2026 — Amazon Prime Day: North America retail catalyst; first post-earnings upward revision in retail segment consensus
- Mid-2026 — Amazon Leo commercial service launch across five markets: sentiment and narrative catalyst; FCC extension ruling
- July 17, 2026 — Long $275 call expiry: the settlement date for the back leg; traders in any of the three trading ideas should plan exit or roll strategy 5–7 days before this date
- July 30, 2026 — Q2 2026 Earnings: the quarter that will validate or challenge the AWS reacceleration thesis; Q2 guidance midpoint $196.5B already above prior $188.9B consensus
The trade is elegant. The structure is rational. The fundamental backdrop — coming off the strongest AWS quarter in four years, with $100B+ in Anthropic/OpenAI committed revenue locked in, a $312 consensus PT, and the richest upcoming catalyst density Amazon has had in years — provides the context that makes a $46M net-credit diagonal not a leap of faith but a calculated institutional expression of high conviction.
Disclaimer: Options trading involves substantial risk of loss and is not suitable for all investors. The diagonal call spread described in this analysis involves both short and long options positions; the short call leg ($210 May 15) is deep in-the-money and carries near-certain assignment risk unless actively managed or covered by an existing equity position. Executing naked short deep-ITM calls without owning the underlying shares exposes the trader to immediate and substantial losses equal to the difference between the current market price and the strike price on each contract, multiplied by 100 shares per contract. The long call leg ($275 July 17) carries the risk of total loss of the $14M premium paid if AMZN fails to trade above $290.18 at expiry. All breakeven calculations, premium estimates, and P&L projections in this analysis use the trade's reported execution premiums ($64.50/contract for the short leg, $15.18/contract for the long leg) as of 11:10:27 AM on May 6, 2026; actual options prices will vary and must be verified with a broker before execution. The scenario probabilities (Bear 20%, Base 55%, Bull 25%) are analytical estimates based on fundamental and catalyst analysis and do not represent mathematical probability calculations derived from options pricing models. Gamma S/R and Implied Move visuals were unavailable for today's data feed and should not be inferred from their absence. This analysis is for educational and informational purposes only and does not constitute financial advice, a solicitation, or a recommendation to buy or sell any security or options contract. Always conduct your own due diligence and consider consulting a licensed financial advisor before trading options.
About Amazon.com, Inc.: Amazon.com, Inc. (NASDAQ: AMZN) is the world's largest online retailer and the dominant cloud infrastructure provider through Amazon Web Services. Operating across North America retail, International retail, AWS, and Advertising, Amazon generated $181.5B in Q1 2026 revenue (+17% YoY) with AWS growing at 28% — its fastest pace in 15 quarters. The company is headquartered in Seattle, Washington, led by CEO Andy Jassy, and trades at approximately $2.94 trillion market capitalization as of May 6, 2026. Amazon's $200B 2026 capex program, $25B Anthropic partnership, $225B+ Trainium revenue backlog, and early Amazon Leo satellite internet service position it as one of the central AI infrastructure platforms for the second half of the decade.