🔄 AMZN $12M Call — Resolved: A Position CLOSE, Not a Bullish Open (the Feed's "OI 10" Was Wrong)
🔄 Updated 2026-06-12: Next-day OPRA OI resolved this as a CLOSE — open interest fell 15,670 → 8,320 (Δ −7,350 ≈ the 7,500 traded). The screenshot's "OI 10" was a bad feed value; real prior OI was ≈15,670. This was a desk closing/exiting an existing call position, not opening a bullish bet.
📅 June 11, 2026 | 🔄 OI-Resolved: CLOSE (Updated June 12, 2026)
🎯 The Quick Take
UPDATED — This read has been inverted by next-day OI. At 10:26:12 on June 11, a desk crossed a $12M block of Amazon (AMZN) August 21 $240 calls — 7,500 contracts at ≈$237.57 spot. The same-day article called this a confirmed bullish open because the screenshot showed "OI 10," making 7,500 seem like a massive fresh position. That feed value was wrong. The real prior OI (EOD 2026-06-10) was 15,670 contracts. The next-day OPRA snapshot (EOD 2026-06-11) came in at 8,320 — a drop of ≈7,350, almost exactly the trade size. Open interest fell, not rose. This was a CLOSE — a desk exiting or taking profit on an existing long-call position, not opening a new bullish bet. With Q2 earnings still ahead (July 30), the desk chose to reduce call exposure rather than add to it. The signal is mildly neutral-to-bearish — an unwind of bullish positioning, not fresh conviction.
📊 Company Overview
Amazon.com (AMZN) is one of the most diversified large-cap businesses in the world:
- Market Cap: ≈$2.56 trillion
- Sector / Industry: Consumer Discretionary — Internet & Direct Marketing Retail / Cloud Computing / Digital Advertising
- What they do: Amazon runs the dominant U.S. e-commerce marketplace, the world's #1 cloud infrastructure platform (AWS), the #3 U.S. digital advertising business (>$70B TTM), Prime Video, Alexa devices, and a rapidly scaling AI infrastructure business anchored by custom Trainium/Graviton silicon. They are also the largest external investor in Anthropic ($13B committed, up to $20B more tied to milestones).
- Recent performance: AMZN is up ≈+5.6% year-to-date — a relative laggard vs. mega-cap peers — having pulled back ≈14% from its May 6 all-time closing high of $274.99 after investors fixated on the ≈$200B 2026 AI capex plan. The stock traded ≈$239 this morning, ≈$2 below the crossed call strike.
💰 The Option Flow Breakdown
The Tape — June 11, 2026 @ 10:26:12: 🤝 BLOCK CROSS
| Time | Buy/Sell | Call/Put | Expiration | Premium | Strike | Volume | OI | Size | Spot | Option Price | Option Symbol |
|---|---|---|---|---|---|---|---|---|---|---|---|
| 10:26:12 | BUY | CALL | 2026-08-21 | $12M | $240 | 7,700 | 15,670† | 7,500 | $237.57 | $15.55 | AMZN20260821C240 |
† OI shown is the true OPRA prior-day open interest (15,670). The original screenshot feed displayed "10," which was erroneous — see the resolution box below.
Flow type: 🤝 BLOCK CROSS — The tape shows a single-leg cross accounting for 91% of the day's volume on this strike. A broker matched a buyer and seller off the open book, with a known counterparty on the other side. This is a negotiated block — "crossed" / "facilitated block." The $15.55 option price × 7,500 contracts × 100 shares = $11.66M net premium (≈$12M rounded). Order type: Close (STC — Sell to Close / BTC — Buy to Close proxy) — OI-confirmed. The BUY side of this cross was the party closing out an existing long; the cross net-reduced open interest by ≈7,350 contracts.
✅ RESOLVED — Next-Day OI Confirms a CLOSE (2026-06-12)
The next-day OPRA open-interest snapshot is in, and it inverts the same-day read:
| Snapshot | Open Interest |
|---|---|
| Pre-print baseline (EOD 2026-06-10) | 15,670 |
| Resolving (EOD 2026-06-11) | 8,320 |
| Δ | −7,350 (≈ the 7,500 traded) |
Open interest FELL by ≈7,350, almost exactly the trade size. That is the signature of a closing transaction — a desk exited / took profit on an existing long-call position, not a new bullish bet. The earlier "size 7,500 ≫ OI 10 → fresh open" read relied on a bad feed value for prior OI; the true baseline was ≈15,670, so the trade was always size-below-OI, and the OI drop now proves it closed.
🤓 What This Actually Means — Plain English
UPDATED READ (OI-confirmed close).
A desk crossed 7,500 AMZN Aug-21 $240 calls at $15.55 per share (≈$12M) on June 11. On the day of the trade, the screenshot feed showed "OI 10" — which made the 7,500-contract print look like an obvious fresh open (you can't close 7,500 against 10). The article was written accordingly.
That feed value was wrong. The real EOD 2026-06-10 OI was 15,670 contracts. The trade-size (7,500) was therefore well below prior OI — the classic "could be open OR close" ambiguity. The EOD 2026-06-11 snapshot resolved it: OI dropped to 8,320, a decline of ≈7,350 — nearly identical to the trade size.
What this means in plain English: A desk that already owned roughly 7,500 of the existing 15,670 AMZN Aug-21 $240C contracts sold / closed their position via a block cross. They collected ≈$12M in premium by exiting. The other side of that cross (the buyer) now holds those contracts — but the original holder reduced their bullish call exposure by ≈7,500 contracts ahead of Q2 earnings.
What is the signal? A desk closing a long call position before Q2 earnings (July 30) is a neutral-to-mildly-bearish signal — it means someone who was positioned for upside chose to exit and take their proceeds off the table rather than ride through the catalyst. It is not a new bearish bet (no put buying), but it is a reduction of existing bullish conviction. The counterparty who bought the cross may be adding a new long position — but the dominant read from the OI change is an unwind, not a build.
Order type: Close (STC — Sell to Close) — OI-confirmed. This was an exit of an existing position, not a fresh bullish open. Confidence: HIGH (ΔOI ≈ −7,350 ≈ trade size).
📈 Technical Setup / Chart Check-Up
YTD Performance
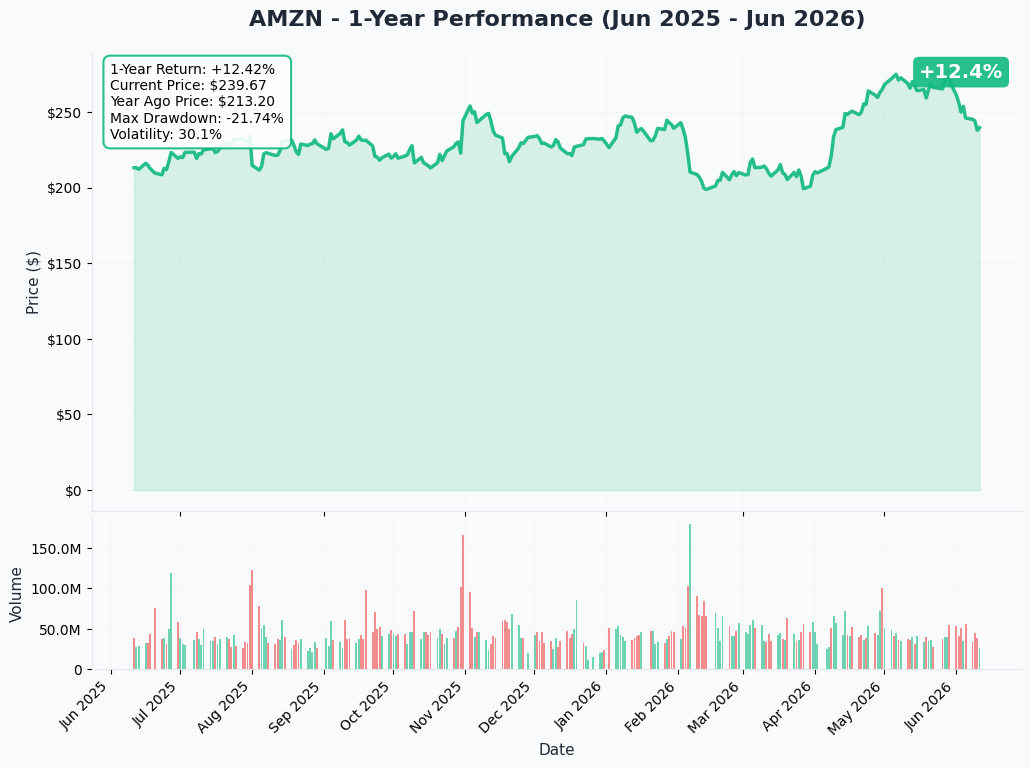
Amazon has been the laggard in mega-cap tech this year — up just ≈+5.6% YTD while peers like NVDA and META ran significantly further. The stock hit an all-time closing high of $274.99 on May 6, then sold off ≈14% through mid-June, almost entirely on capex anxiety after Amazon disclosed a ≈$200B 2026 AI infrastructure plan. As Money Morning noted, the 7.6% week of June 5 drop was sentiment-driven, not fundamental — AWS, advertising and logistics fundamentals all strengthened in Q1. The current price near $239 represents the desk's entry point, ≈14% below the all-time high.
Key chart observations:
- 📉 Down ≈14% from the May 6 high at ≈$239, which is the lowest relative to mega-cap peers the stock has been all year
- 📈 The Q1 2026 beat (revenue $181.5B, EPS $2.78, AWS +28%) was followed by a dip — the capex overhang, not the fundamentals, drove the selloff
- 🎯 Wall Street's ≈66-analyst average price target is ≈$312.79, implying ≈30%+ upside from here — the stock is ≈26% below where the analyst community already thinks it should trade
Gamma-Based Support & Resistance
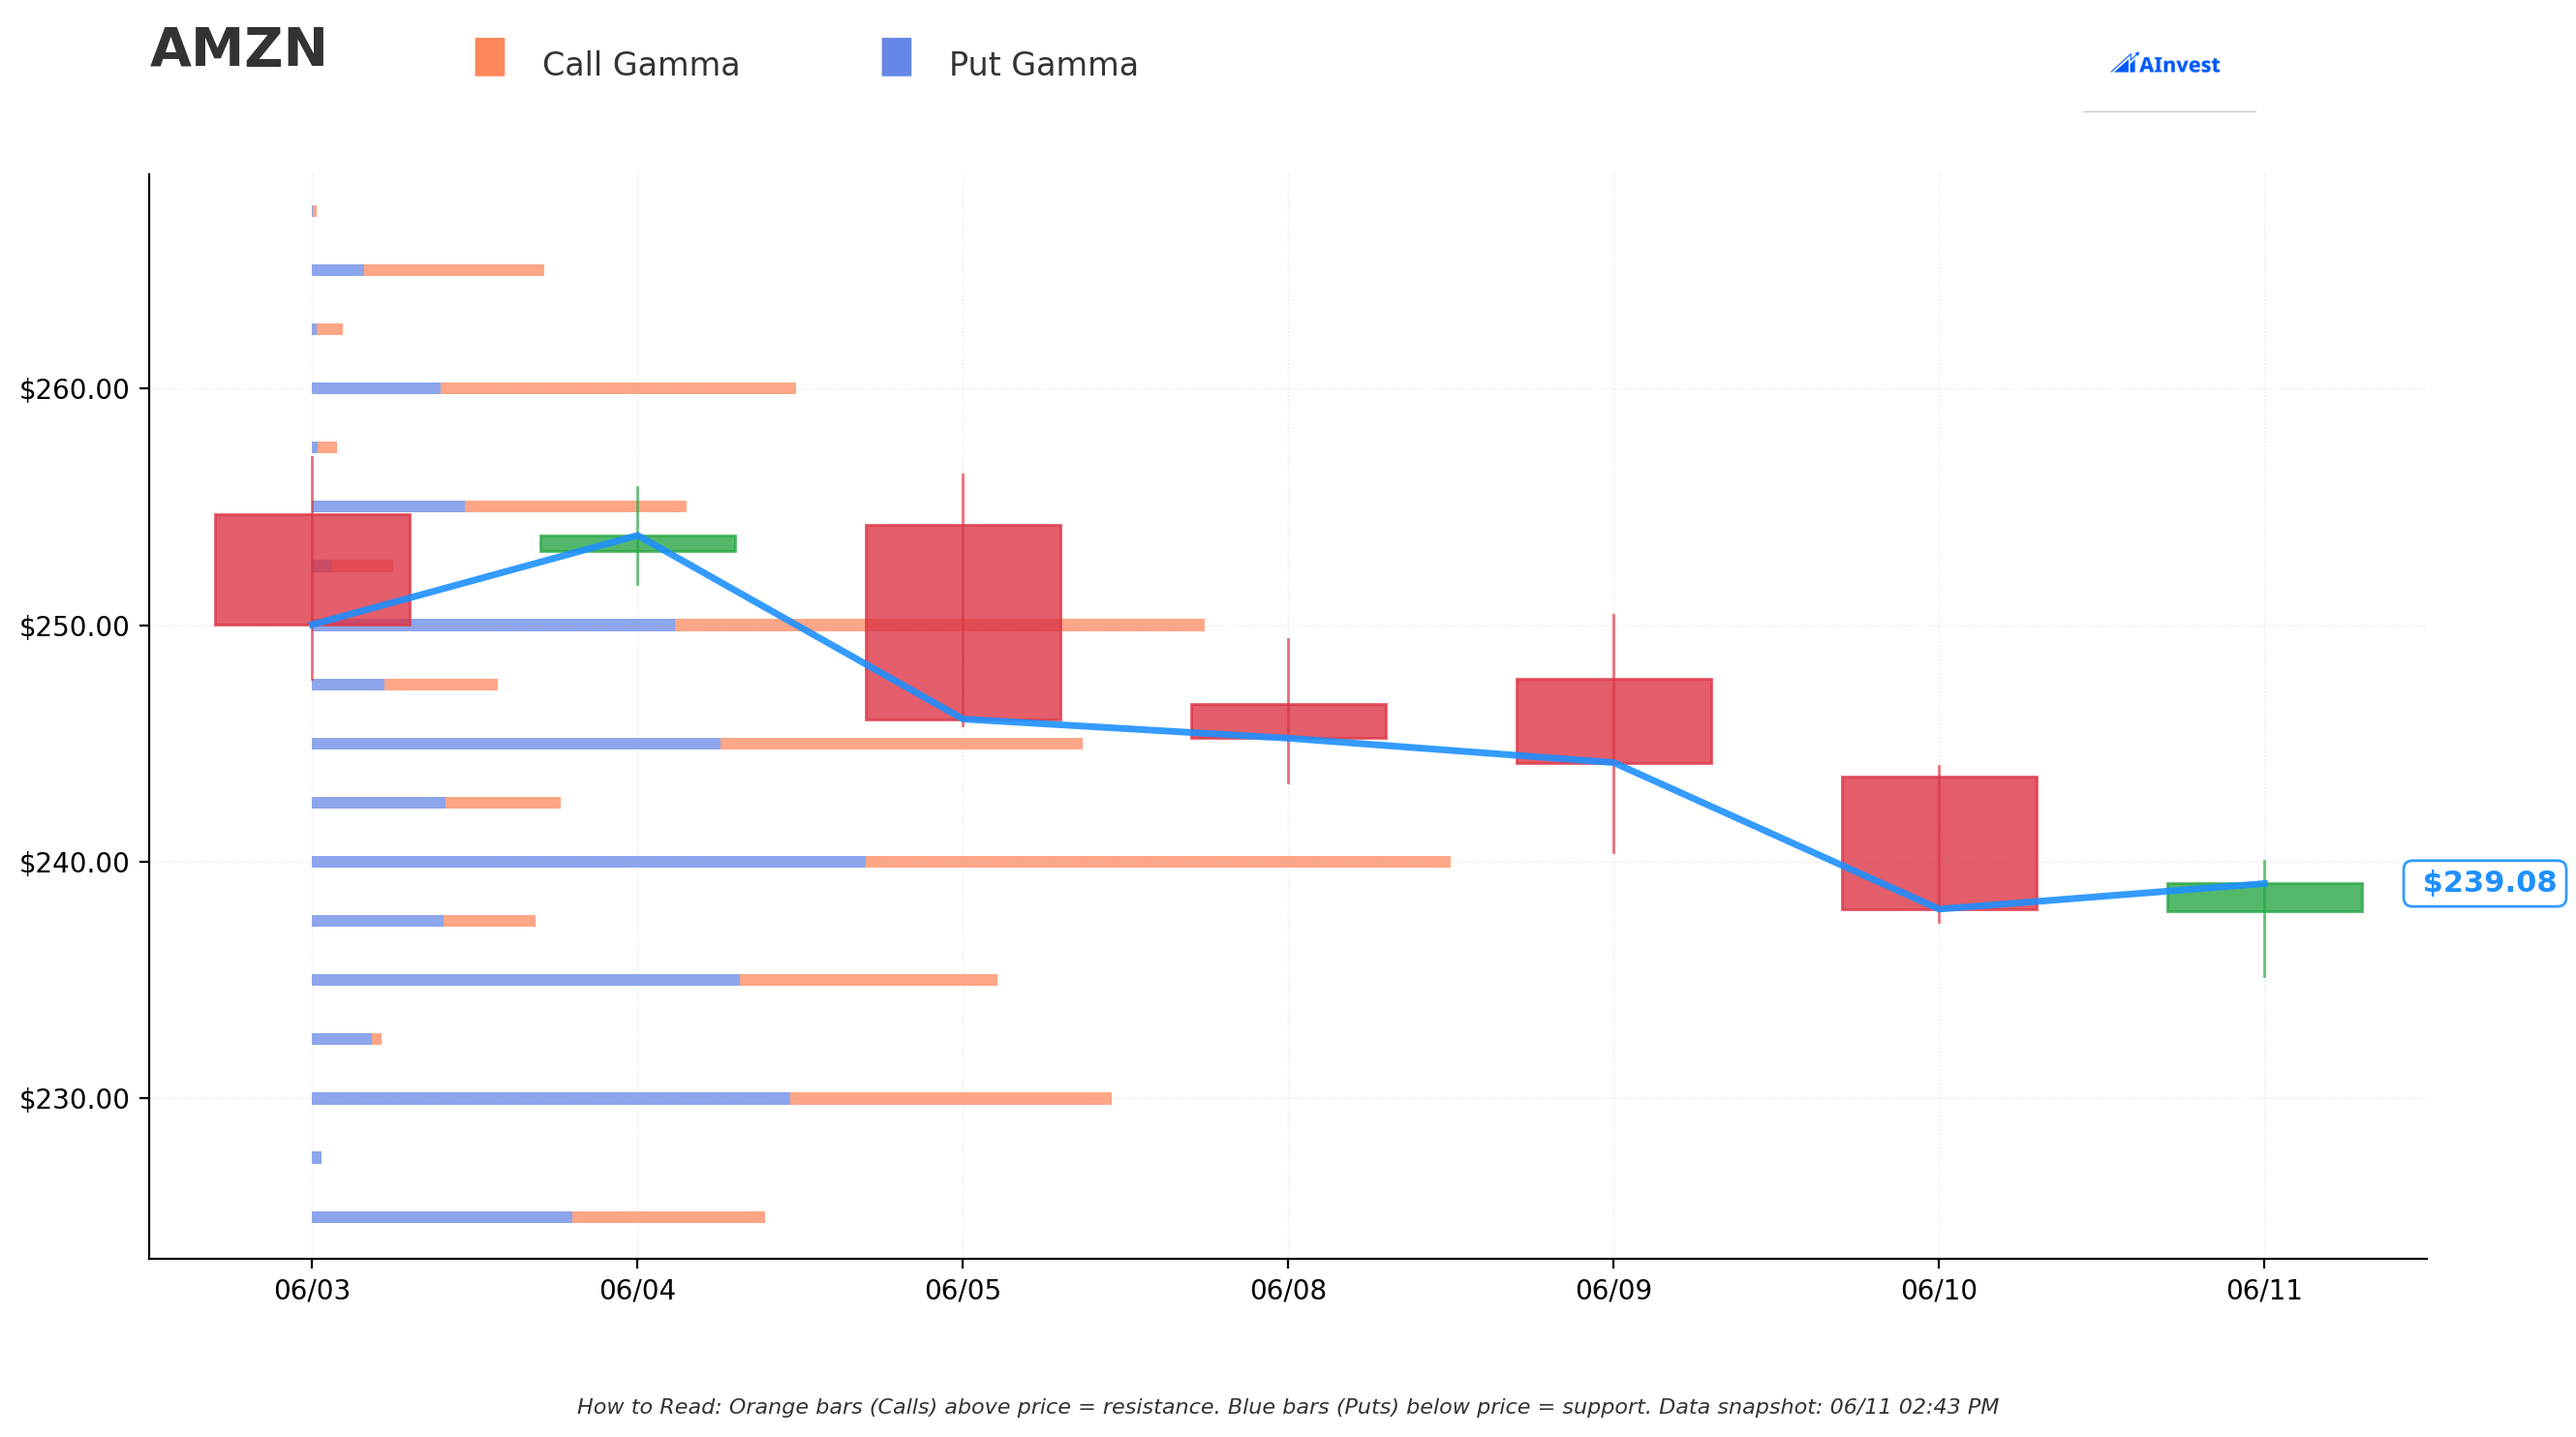
Current Price: ≈$239.23
The gamma exposure map reveals a layered structure of call walls above and put support below. Here is what the gex.json data shows:
🔵 Support Levels (Put Gamma Below Price):
- $235 — First Support Floor. Put gamma is concentrated here, meaning market makers tend to defend this level when price dips. A close below $235 removes this support and could open a faster move toward the next floor.
- $230 — Deeper Support. A stronger put gamma wall further down. If $235 breaks, $230 is the next meaningful floor that dealer positioning would defend.
🟠 Resistance Levels (Call Gamma Above Price):
- $240 — First Gamma Wall. This is the immediate resistance ceiling and — notably — it is exactly where the block cross was struck. Heavy call open interest here means market makers carry short gamma exposure that creates mechanical selling pressure as price approaches $240 from below. The desk crossed this strike: they're betting AMZN breaks cleanly through it post-earnings.
- $245 — Secondary Resistance. A meaningful call gamma concentration above the first wall. Breaking $240 cleanly sets up a run toward $245 as the next test.
- $250 — Strong Resistance Wall. A significant gamma ceiling further up. Above $250, call gamma gets lighter and the stock can move more freely — which is the bull case territory for this trade.
Translation for traders: AMZN is currently pinned just below the $240 gamma wall. This explains the cross at exactly $240 — the desk is buying a strike at the first mechanical resistance, betting that Q2 earnings delivers enough fundamental force to push through all three walls ($240, $245, $250) and into open air above $250. The trade is not profitable at $241. It needs to get meaningfully above $255 by August 21.
Implied Move Analysis
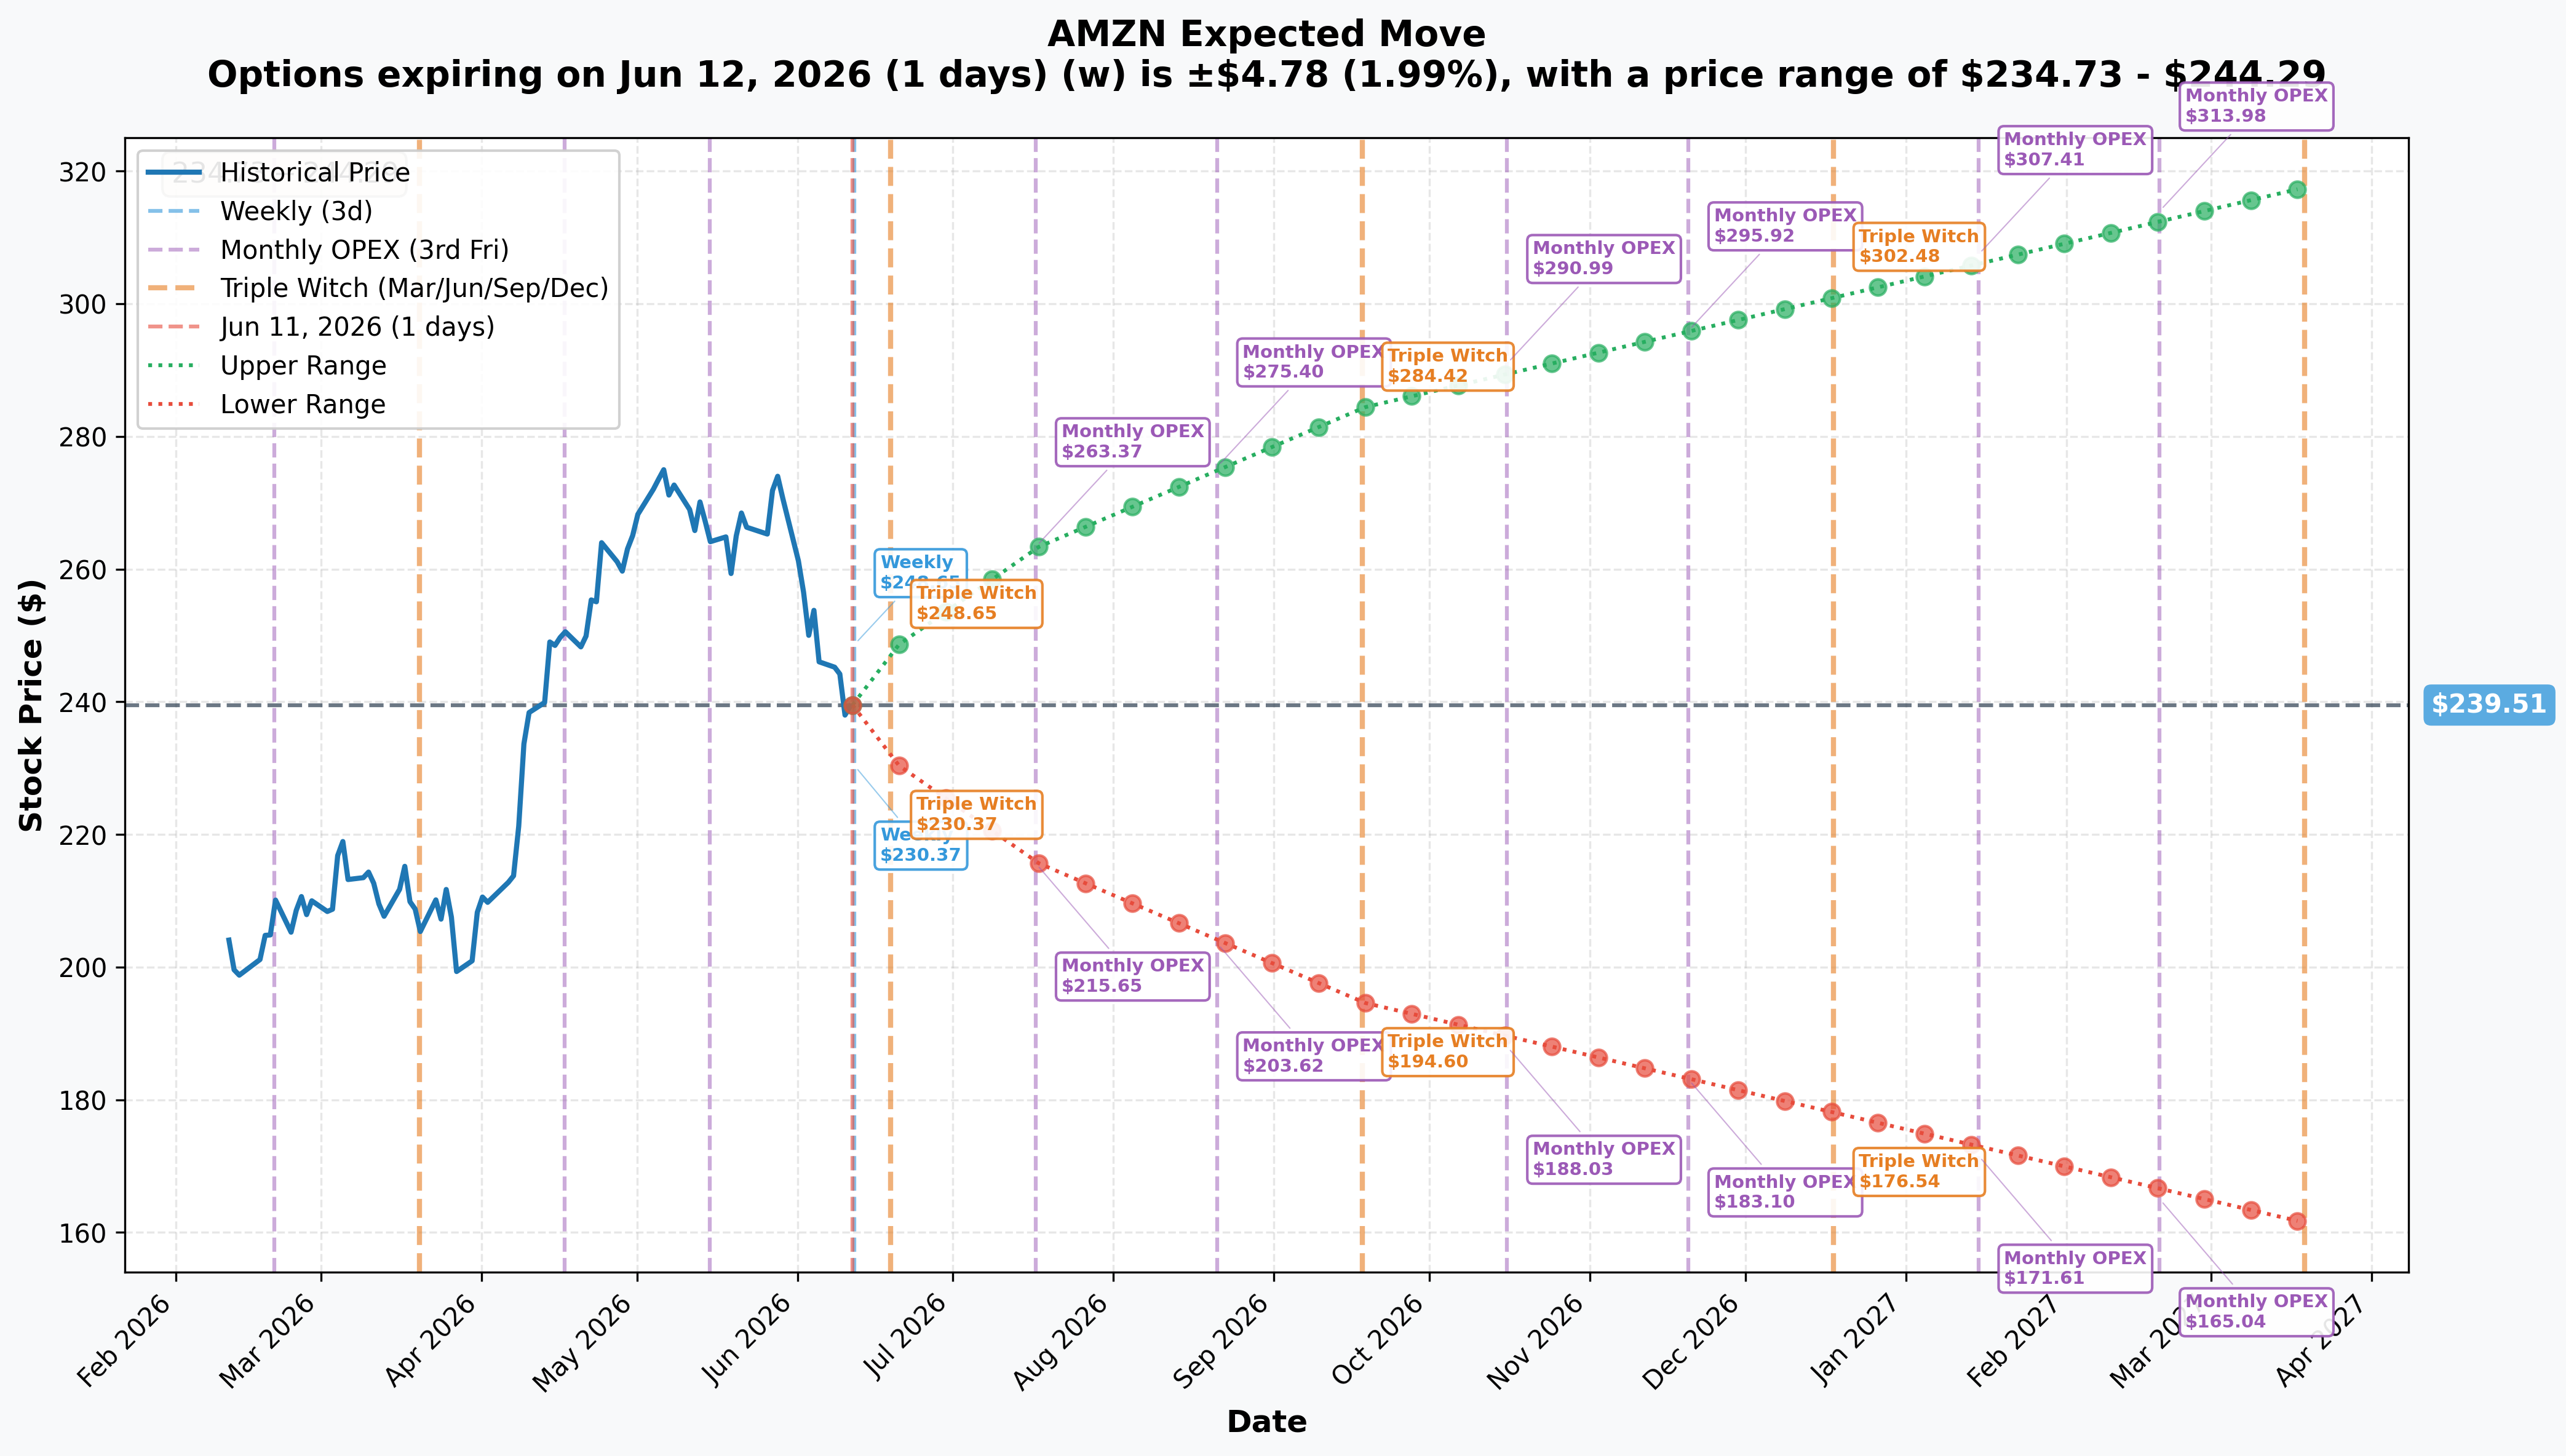
The options market is pricing in substantial moves across every horizon — and the August 21 expiry (this trade's expiry) falls in a particularly catalytic window:
- 📅 Monthly OPEX (July 17, 36 days out): ≈±9.96% → Range $215.65 – $263.37 — straddles the Q2 earnings announcement (July 30 is after July monthly OPEX, so the July monthly cycle does not fully capture the earnings print)
- 📅 August 21 Expiry (this trade, 71 days): The Aug-21 expiry is positioned to fully capture the Q2 earnings reaction (July 30–31) with ≈22 days of post-earnings runway. Prime Day (June 23–26) also falls before expiry, adding a potential Q2 revenue tailwind into the print.
- 📅 Quarterly (September 18, 99 days): ≈±18.75% → Range $194.60 – $284.42 — the upper cone reaches toward analyst target territory
- 📅 Yearly LEAP (annual): ≈±32.6% → Range $161.39 – $317.63 — the upper LEAP range aligns with the ≈$312 analyst consensus
Key takeaway for this trade: The $255.55 breakeven is roughly 7% above current spot. The monthly implied move already prices a ±10% range by mid-July. For this trade to work, the desk needs a post-earnings re-rating that pushes AMZN through the breakeven within 71 days — which sits comfortably within the market's own implied probability cone for the quarterly timeframe.
🎪 Catalysts
Already Happened (Supports the Bull Thesis)
Q1 2026 Earnings — Record Margins, AWS Acceleration (Reported April 29, 2026)
- Revenue: $181.5B, +17% YoY; EPS: $2.78 vs ≈$1.65 consensus — a wide beat on both lines.
- AWS: $37.59B, +28% YoY — fastest growth in 15 quarters. Demand is outpacing available capacity.
- Operating income: $23.9B at a 13.1% margin — the highest operating margin Amazon has ever posted.
- AWS backlog: $364B, with $57B of new backlog added in just one quarter. That is committed future revenue already under contract.
- Advertising: $17.2B, up ≈22–24% YoY — surpassing $70B on a trailing-12-month basis.
- North America margin hit a record 9.0% — same-day delivery and logistics efficiency compounding.
- The twist: Shares fell ≈2% after-hours despite the all-line beat, as investors fixated on the ≈$200B capex plan. That valuation fear — not fundamental deterioration — is what created the current entry.
Amazon's Anthropic Investment Expanded (Closed April 20, 2026)
- Amazon closed an additional $5B equity stake in Anthropic, bringing cumulative direct investment to $13B with up to $20B more committed.
- Anthropic committed to a $100B, 10-year AWS agreement covering Trainium2/3/4 silicon — a structural anchor tenant.
- Anthropic already runs 1M+ Trainium2 chips; 100,000+ customers use Claude on Amazon Bedrock. This validates custom silicon at massive scale.
OpenAI's $100B+ AWS Commitment (Disclosed Q1 2026)
- CEO Jassy disclosed that OpenAI has committed over $100B to AWS, directly underpinning a major portion of the 2026 capex. The capex is not speculative spending — it is fulfilling signed commitments from named customers.
Analyst Community Strongly Aligned
- Consensus: "Strong Buy", average target ≈$312.79 across 66 analysts.
- The three most-recent ratings average $327.33 — Truist ($320), Wells Fargo, TD Cowen. Targets rising into 2026, not falling.
Upcoming Catalysts (This Is Where the Trade Lives)
Prime Day 2026 — June 23–26 📅 Prime Day was pulled forward to June 23–26, landing fully within Q2 to avoid the FIFA World Cup and U.S. 250th-anniversary July 4 weekend (NBC News, 9to5Mac). In prior years, Prime Day sometimes straddled Q2/Q3. Landing it cleanly in Q2 front-loads retail revenue into the July 30 earnings print — a direct tailwind for the Q2 revenue beat the desk appears to be pricing.
Q2 2026 Earnings — July 30, 2026 (after market close) 📅 This is the bullseye. The August 21 expiry was chosen specifically to capture the Q2 print with room to breathe.
- Company guidance: Net sales $194–$199B, operating income $20–$24B. Guidance explicitly assumed Prime Day falls in Q2.
- Consensus: Revenue ≈$195.71B, EPS ≈$1.81.
- What to watch: AWS growth rate (≥26% would confirm structural reacceleration), AWS backlog delta, AI revenue run-rate update, advertising growth, capex pace, and North America operating margin progression.
- A strong AWS print + a capex narrative that frames the spend as supply meeting committed demand — rather than speculative overbuilding — could re-rate AMZN toward the ≈$312 average analyst target in the following weeks.
AWS Trainium2/Trainium3 Capacity Ramp — H2 2026 📅 Nearly 1 GW of combined Trainium2+3 capacity is expected online by end of 2026. Converting the $364B backlog into recognized revenue is the key driver of sustained AWS acceleration — and it is cumulative, quarter by quarter. Each Trainium chip deployed against Anthropic's or OpenAI's existing commitments is revenue that does not depend on winning new customers.
Prime Video Ad Expansion — 2026 📅 Prime Video advertising is expanding into Belgium, Denmark, Norway and Turkey in 2026, with more interactive ad formats rolling out globally. This is part of the path toward what analysts project could be ≈$85B in annual ad revenue on a compounding trajectory — a ≈18.7% CAGR.
🎲 4-Reader Interpretation
🚀 YOLO Trader
This structure was already done for you. The AMZN Aug-21 $240C at ≈$15.55 is the vehicle the desk chose — near-the-money, 71 days, straddling Q2 earnings. If you believe the AWS reacceleration story and think Q2 delivers a clean beat, you could buy these same calls and ride alongside. The lever: each $1 AMZN moves above $240 is ≈$100/contract in P&L. The risk: if AMZN is at or below $240 on August 21, 100% of the premium is gone. The earnings print on July 30 is a binary event — size accordingly and do not put in more than you are comfortable losing entirely.
📊 Swing Trader
Watch the $240 gamma wall as your key near-term level. AMZN is currently pinned just below it (≈$239). A confirmed close above $240 on meaningful volume would signal the mechanical resistance is breaking, which historically tends to accelerate moves toward the next wall ($245, then $250). A near-term swing setup: wait for AMZN to close above $240 cleanly, then look at a call spread (e.g., Aug $240/$250 bull call spread) to define your cost. Buying the spread instead of outright calls lowers your cost basis and reduces theta burn. Key date to mark: July 30 is the earnings binary. Size your position to survive a ±10% earnings gap in either direction.
🛡️ Premium Collector
With AMZN pinned below the $240 gamma wall and Q2 earnings on July 30, implied volatility will be elevated heading into the print — making premium selling attractive, but with a significant caveat. Cash-secured puts at the $230 or $235 gamma support level (July expiry, before earnings) could generate income while staying below the mechanical floor. After the July 30 earnings, IV will crush sharply — that is typically the better window to sell covered calls or cash-secured puts against a stronger post-earnings baseline. Do not sell naked options that span the July 30 binary event without hedging; earnings gaps of ±10% are within normal range for AMZN.
🌱 Entry-Level / Beginner
Here is the plain-English version of what happened today.
A single desk crossed 7,500 call option contracts on Amazon stock at the $240 strike, expiring August 21, 2026. They paid ≈$15.55 per share for these contracts, totaling ≈$12 million.
A call option gives the buyer the right — but not the obligation — to purchase Amazon shares at $240 anytime before August 21. Amazon was trading at ≈$237.57 when the block crossed, so the stock needs to go up and hold above $240 for the option to have value at expiration. The trade starts making money above ≈$255.55 (the strike plus the premium paid).
Why does this matter? Because Amazon's Q2 2026 earnings are on July 30 — and the August 21 expiry was specifically chosen to land 22 days after that earnings date, giving time for a re-rating if the numbers are strong. The desk is betting Amazon's cloud business, Prime Day, and AI momentum deliver a Q2 beat that pushes the stock meaningfully above $255 before late August. The most they can lose is the $12M premium. The whole bet is about whether Q2 earnings re-rate the stock upward.
⚠️ Risk Factors
Options trading involves substantial risk of loss and is not suitable for all investors. Here are the specific risks for this trade and thesis:
The Capex Overhang Is the Central Bear Case The ≈$200B 2026 capex plan is what drove the June selloff — a nearly 50% YoY increase in capital spending. If AWS growth decelerates even modestly below the ≈26% consensus bar for Q2, investors will question whether the spending is outpacing the return. Any Q2 capex upsizing or AWS growth below 26% could re-trigger the same sentiment that caused the 7.6% drop the week of June 5. The calls expire worthless if AMZN is at or below $240 on August 21.
Q2 Bar Is High Consensus expects ≈$195.71B revenue and ≈$1.81 EPS for Q2. Amazon also guided operating income to $20–$24B — a wide range with downside optionality baked in. The setup is favorable, but a "meet" rather than "beat-and-raise" could leave the stock flat or lower, which is sufficient to wipe out this call position.
The $240 Strike Is a Gamma Wall — Not Free Air The same gamma structure that creates support below the current price creates selling resistance above it. Breaking through $240, $245, and $250 requires sustained buying that overcomes mechanical dealer hedging flows at each level. The trade's breakeven of ≈$255 is well above the first two walls. This is not a given.
This Is a Block Cross — The Counterparty Had a Reason A known party sold 7,500 $240 calls at $15.55. That counterparty may be a dealer running a neutral book, but they may also be an existing AMZN long selling covered calls at a strike they do not expect the stock to clear. The cross structure means someone agreed at that price — their view is the equal and opposite of the buyer's. Read it as information, not a one-sided signal.
Valuation Leaves Little Cushion for Disappointment At ≈35x earnings, AMZN is not cheap. A multiple compression on macro/rate shifts could pressure the stock independent of operational results. The FTC monopoly antitrust trial is now scheduled for February 9, 2027, outside the August 21 window, but it remains a headline overhang.
AI-Capex Sector Rotation Is a Tail Risk Amazon is one of several Big Tech names in a >$650B aggregate AI-capex surge. Any sector-wide "AI digestion" rotation would hit AMZN regardless of company-specific execution. The stock is not immune to macro sentiment shifts in the large-cap tech space.
What the OPRA Tape CANNOT Tell Us: We know the mechanism (single-leg block cross), size (7,500 contracts), price ($15.55), direction (BUY), and that this is a confirmed new open (size ≫ OI). We do not know the buyer's identity, their existing portfolio, whether this is standalone or part of a hedged book, or their exit strategy. We decode the tape; we do not read minds.
🎯 The Bottom Line
UPDATED READ — this is a CLOSE, not a new bullish open.
A desk crossed ≈$12M in AMZN August 21 $240 calls on June 11 — but next-day OI proves this was an exit of an existing position, not a new directional bet. The same-day article called it a confirmed BTO because the screenshot feed showed "OI 10," making 7,500 seem like a structurally proven open. The feed was wrong. Real prior OI was 15,670; EOD OI fell to 8,320 (Δ ≈ −7,350). The desk reduced its existing long-call exposure by ≈7,500 contracts, collecting ≈$12M in the process — ahead of Q2 earnings on July 30.
The fundamental backdrop for AMZN remains intact as described below (the Q1 results, AWS reacceleration, Prime Day, analyst targets are all factual). But the trade no longer supports "a desk positioned bullishly through Q2 earnings" — it supports "a desk took profits on a long-call position before Q2 earnings." That is a meaningfully different signal.
What to watch (revised framing):
- 📅 June 23–26: Prime Day — Q2 retail momentum signal. The closed position had no direct read on whether this was Prime Day positioning or simply a P&L take.
- 📅 July 30 (after close): Q2 2026 earnings — still the key AMZN catalyst. The position that was closed here had been running into this event; the desk chose to monetize rather than hold. Watch AWS growth rate (≥26%), capex narrative, NA margin.
- 📅 August 21, 2026: AMZN Aug-21 $240C expiration — still relevant for the 8,320 contracts of remaining OI on this strike.
- ✅ Next-day OI (resolved June 12): OI fell 15,670 → 8,320 (Δ ≈ −7,350). CLOSE confirmed.
If you own AMZN stock: The gamma structure and $240 wall remain technically relevant regardless of this trade's resolution. A close above $240 on volume is still your key near-term signal. This unwind does not change the fundamental or technical picture for the stock — it just removes one large speculative long from the call side.
If you are watching from the sidelines: The closing of a long-call block ahead of earnings is a subtle caution signal — a sophisticated desk decided the risk/reward of holding through Q2 no longer warranted the position. That does not mean AMZN is going lower; it means one player reduced directional optionality. The implied move cones (±10% monthly, ±18.75% quarterly) and the $255 breakeven math in the original analysis are still accurate for anyone newly evaluating the Aug-21 $240C.
If you are bearish: This unwind adds a minor data point in your favor — less bullish call exposure outstanding on this strike than before the trade. But with 8,320 contracts still open, the strike remains populated. A decisive Q2 miss remains the catalyst that tests the $235 and $230 gamma floors.
A $12M block cross on Amazon that the tape initially read as a new bullish open — and that next-day OI revealed was a clean position exit. The desk did not bet on the numbers. They took their chips off the table first.
Correction note: The same-day read ("confirmed BTO, fresh bullish position, size ≫ OI") was based on a bad feed value of OI = 10. The true prior OI was 15,670. This is the exact scenario the ⏳ come-back-tomorrow callout exists to catch — size ≤ real OI is always ambiguous until the next-day snapshot arrives. The lesson: always verify screenshot OI values against the OPRA tape before asserting open/close conviction.
Disclaimer: Options trading involves substantial risk of loss and is not suitable for all investors. This analysis is for educational and informational purposes only and does not constitute financial advice or a recommendation to buy or sell any security. Past unusual options activity does not guarantee future returns. The AMZN August 21 $240 call requires AMZN to trade meaningfully above $255.55 by expiration to be profitable, and can expire entirely worthless — resulting in 100% loss of the premium paid. Block cross trades involve a known counterparty; the counterparty who bought this cross may be opening a new position. Amazon's Q2 earnings on July 30, 2026 are a binary event with potential for large gaps in either direction. Always conduct your own due diligence and consider consulting a licensed financial advisor before making any trading decisions. Open/close classification UPDATED June 12: next-day OPRA OI confirmed a CLOSE (OI fell 15,670 → 8,320, Δ ≈ −7,350 ≈ trade size). The same-day "OI 10" screenshot value was a bad feed; true prior OI was ≈15,670.
Last updated: June 12, 2026